A spatially varying change points model for monitoring glaucoma progression using visual field data
Publication
Metrics
AI Quick Summary
This paper introduces a spatially varying change points model to predict glaucoma progression using visual field data, incorporating anatomical information to detect shifts in disease trajectory. The method improves estimation and prediction compared to existing approaches, as demonstrated through simulations and real-data applications.
Paper Preview
Abstract
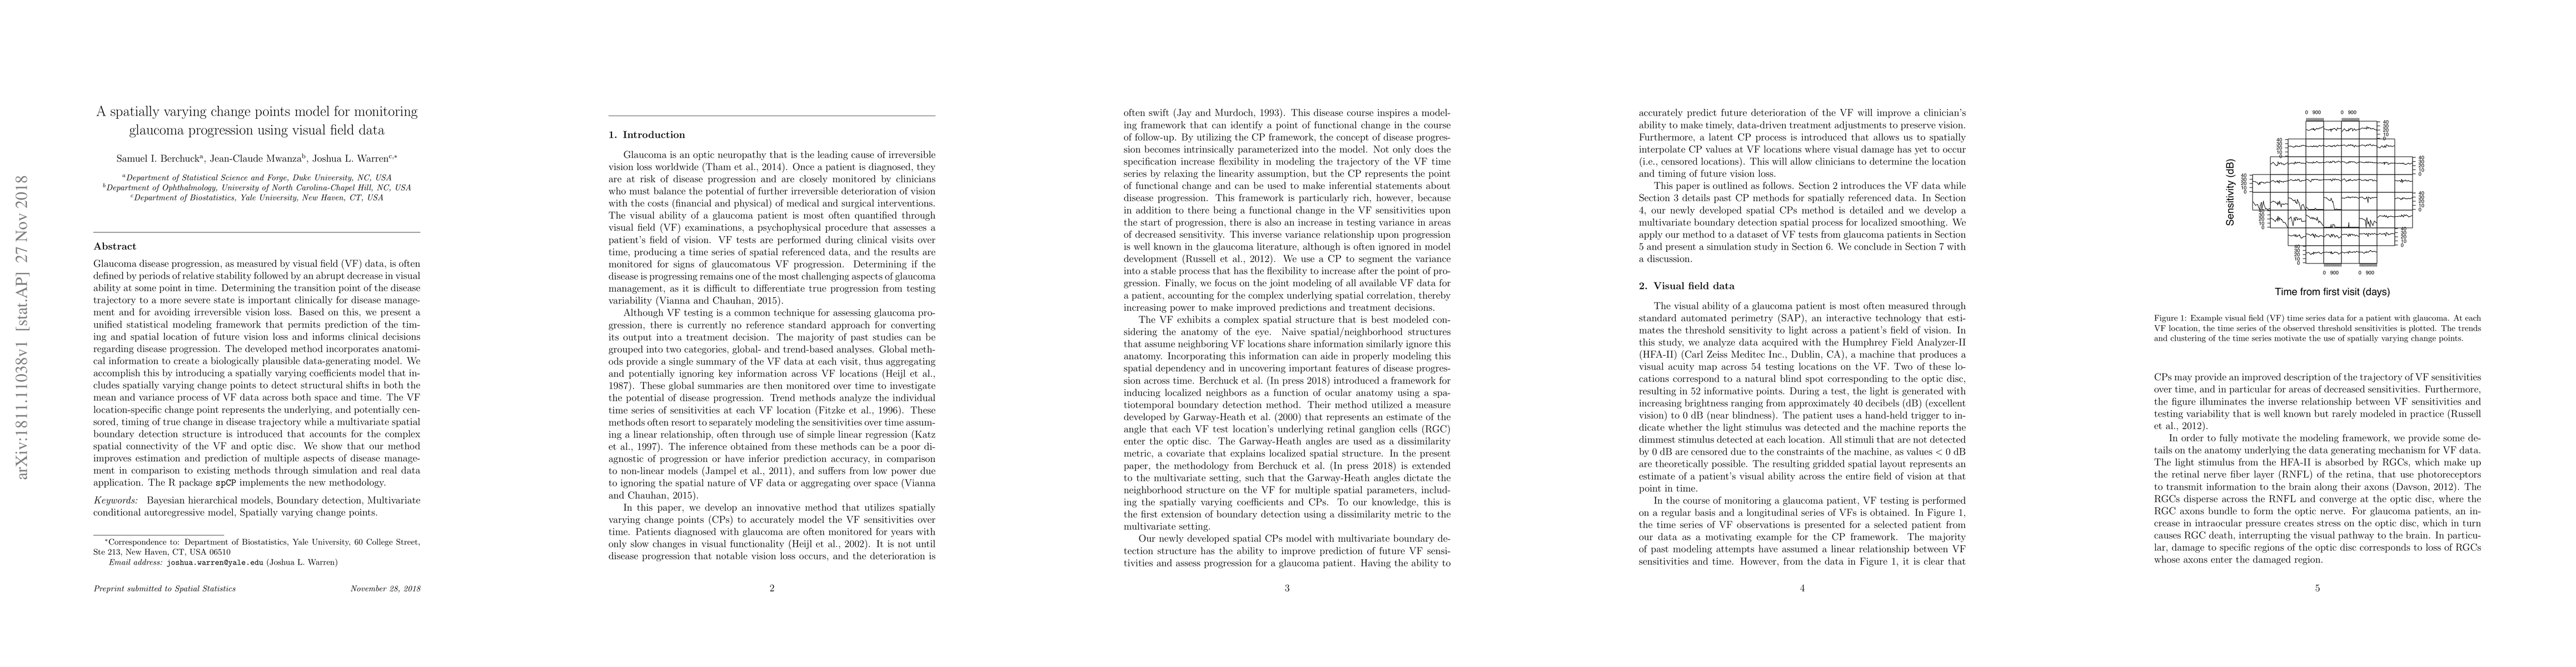
Glaucoma disease progression, as measured by visual field (VF) data, is often defined by periods of relative stability followed by an abrupt decrease in visual ability at some point in time. Determining the transition point of the disease trajectory to a more severe state is important clinically for disease management and for avoiding irreversible vision loss. Based on this, we present a unified statistical modeling framework that permits prediction of the timing and spatial location of future vision loss and informs clinical decisions regarding disease progression. The developed method incorporates anatomical information to create a biologically plausible data-generating model. We accomplish this by introducing a spatially varying coefficients model that includes spatially varying change points to detect structural shifts in both the mean and variance process of VF data across both space and time. The VF location-specific change point represents the underlying, and potentially censored, timing of true change in disease trajectory while a multivariate spatial boundary detection structure is introduced that accounts for the complex spatial connectivity of the VF and optic disc. We show that our method improves estimation and prediction of multiple aspects of disease management in comparison to existing methods through simulation and real data application. The R package spCP implements the new methodology.
AI Key Findings
Get AI-generated insights about this paper's methodology, results, significance, and more — seven facets brought into focus.
Impact
Paper Details
PDF Preview
Key Terms
Citation Network
Current paper (gray), citations (green), references (blue)
Display is limited for performance on very large graphs.
Discussion 0