Publication
Metrics
AI Quick Summary
This study compares the effects of 3D immersive and 2D desktop network visualizations on mental map comprehension, finding that immersive environments aid in interpreting network structure, especially for larger networks, while 2D visualizations are superior for spatial memory tasks.
Paper Preview
Abstract
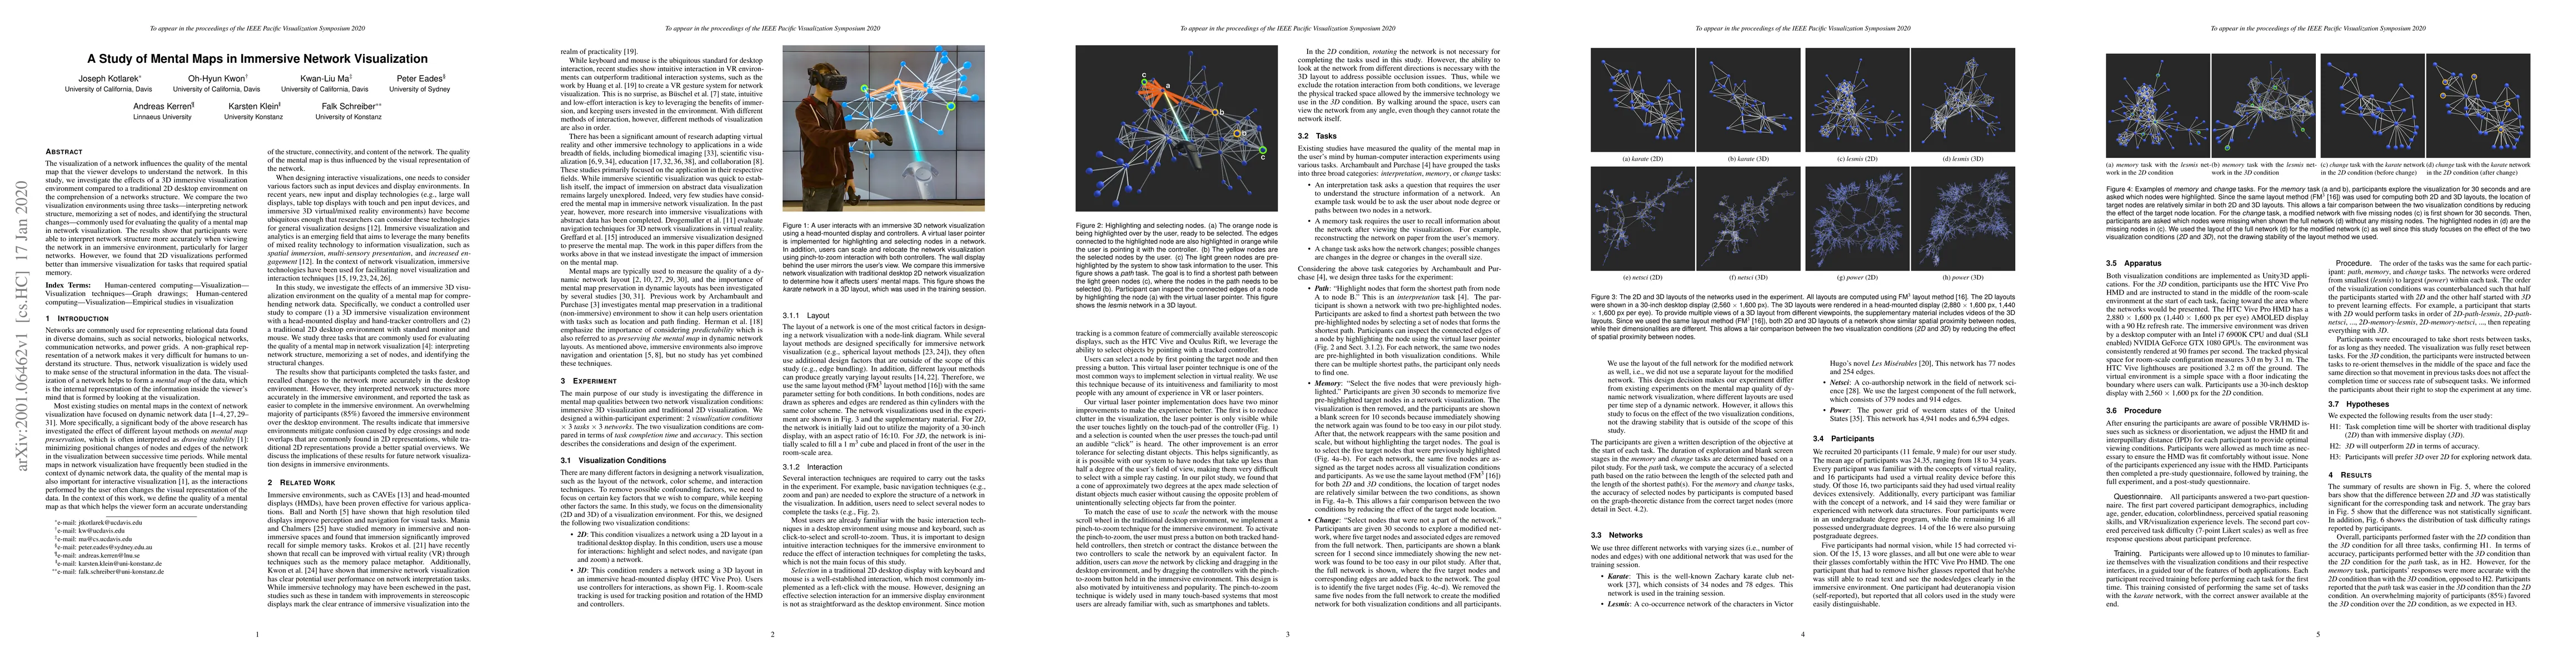
The visualization of a network influences the quality of the mental map that the viewer develops to understand the network. In this study, we investigate the effects of a 3D immersive visualization environment compared to a traditional 2D desktop environment on the comprehension of a network's structure. We compare the two visualization environments using three tasks--interpreting network structure, memorizing a set of nodes, and identifying the structural changes--commonly used for evaluating the quality of a mental map in network visualization. The results show that participants were able to interpret network structure more accurately when viewing the network in an immersive environment, particularly for larger networks. However, we found that 2D visualizations performed better than immersive visualization for tasks that required spatial memory.
AI Key Findings
Get AI-generated insights about this paper's methodology, results, significance, and more — seven facets brought into focus.
Impact
Paper Details
Authors
PDF Preview
Key Terms
Citation Network
Current paper (gray), citations (green), references (blue)
Display is limited for performance on very large graphs.
Discussion 0