This paper introduces a multi-layout design for immersive visualization of network data using extended reality, addressing the limitation of static layouts in prior works. The proposed system dynamically adjusts layouts based on tasks and network complexity, outperforming traditional methods in user studies.
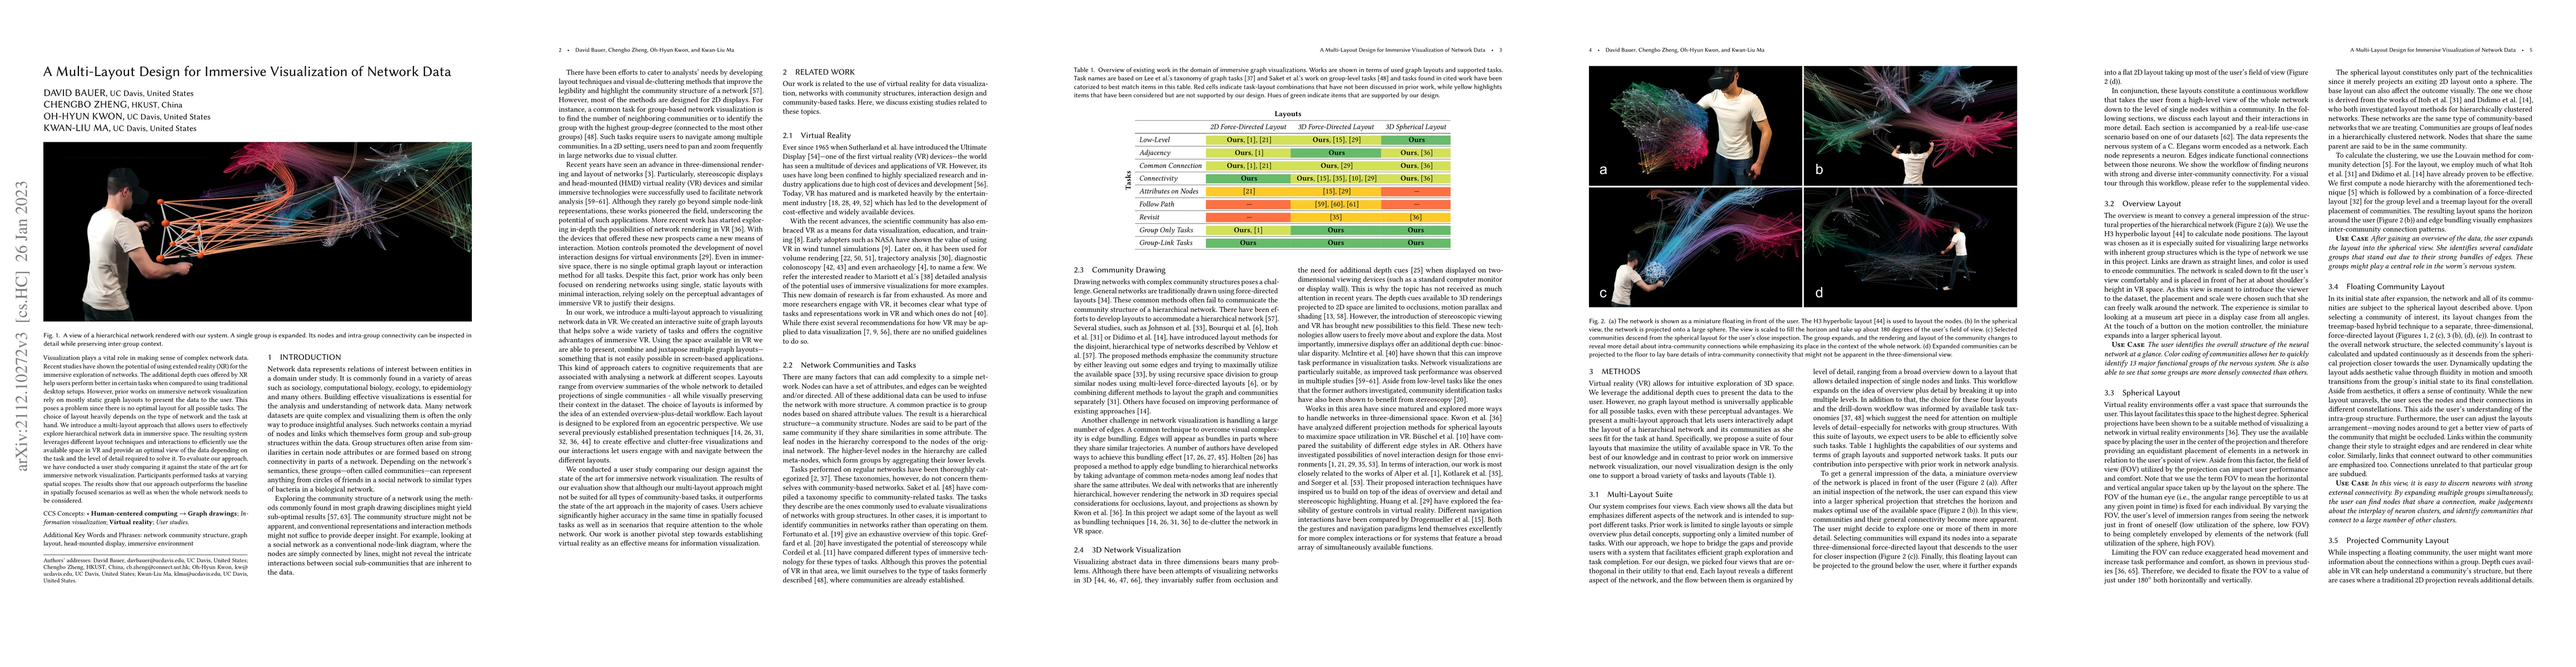
Visualization plays a vital role in making sense of complex network data. Recent studies have shown the potential of using extended reality (XR) for the immersive exploration of networks. The additional depth cues offered by XR help users perform better in certain tasks when compared to using traditional desktop setups. However, prior works on immersive network visualization rely on mostly static graph layouts to present the data to the user. This poses a problem since there is no optimal layout for all possible tasks. The choice of layout heavily depends on the type of network and the task at hand. We introduce a multi-layout approach that allows users to effectively explore hierarchical network data in immersive space. The resulting system leverages different layout techniques and interactions to efficiently use the available space in VR and provide an optimal view of the data depending on the task and the level of detail required to solve it. To evaluate our approach, we have conducted a user study comparing it against the state of the art for immersive network visualization. Participants performed tasks at varying spatial scopes. The results show that our approach outperforms the baseline in spatially focused scenarios as well as when the whole network needs to be considered.
This graph shows how this paper is connected to other research. The current paper is shown in dark gray, papers that cite it are in green, and papers it references are in blue. You can:
• Hover over any node to see the paper title
• Click a node to view that paper's details
• Drag nodes to rearrange the graph
• Use the zoom controls (bottom right) to zoom in/out
No citations found for this paper.
Title | Authors | Year | Actions |
---|---|---|---|
A Comparison of the Fatigue Progression of Eye-Tracked and Motion-Controlled Interaction in Immersive Space
|
Lukas Maximilian Masopust, David Bauer, Siyuan Yao, Kwan-Liu Ma
|
2021
|
View Paper |
Examining virtual reality navigation techniques for 3D network visualisations
|
Adam Drogemuller, Andrew Cunningham, James A. Walsh, B. Thomas, Maxime Cordeil, W. Ross
|
2020
|
View Paper |
A Study of Mental Maps in Immersive Network Visualization
|
Joseph Kotlarek, Oh-Hyun Kwon, K. Ma, P. Eades, A. Kerren, Karsten Klein, F. Schreiber
|
2020
|
View Paper |
Immersive Analytics of Large Dynamic Networks via Overview and Detail Navigation
|
J. Sorger, Manuela Waldner, Wolfgang Knecht, Alessio Arleo
|
2019
|
View Paper |
Augmented Reality Graph Visualizations
|
Wolfgang Büschel, Stefan Vogt, Raimund Dachselt
|
2019
|
View Paper |
Immersive Virtual Colonoscopy
|
Seyedkoosha Mirhosseini, Ievgeniia Gutenko, Sushant Ojal, Joseph Marino, A. Kaufman
|
2019
|
View Paper |
Virtual Reality Interfaces for Interacting with Three-Dimensional Graphs
|
U. Erra, Delfina Malandrino, L. Pepe
|
2019
|
View Paper |
FiberClay: Sculpting Three Dimensional Trajectories to Reveal Structural Insights
|
C. Hurter, N. Riche, S. Drucker, Maxime Cordeil, Richard Alligier, Romain Vuillemot
|
2019
|
View Paper |
Exploring the Limits of Complexity: A Survey of Empirical Studies on Graph Visualisation
|
Vahan Yoghourdjian, D. Archambault, S. Diehl, Tim Dwyer, Karsten Klein, H. Purchase, Hsiang-Yun Wu
|
2018
|
View Paper |
Visualizing Group Structures in Graphs: A Survey
|
Corinna Vehlow, Fabian Beck, D. Weiskopf
|
2017
|
View Paper |
A gesture system for graph visualization in virtual reality environments
|
Yi-Jheng Huang, Takanori Fujiwara, Yun-Xuan Lin, Wen-Chieh Lin, K. Ma
|
2017
|
View Paper |
Immersive Collaborative Analysis of Network Connectivity: CAVE-style or Head-Mounted Display?
|
Maxime Cordeil, Tim Dwyer, K. Klein, B. Laha, K. Marriott, B. Thomas
|
2017
|
View Paper |
A Study of Layout, Rendering, and Interaction Methods for Immersive Graph Visualization
|
Oh-Hyun Kwon, C. Muelder, Kyungwon Lee, K. Ma
|
2016
|
View Paper |
Eight Common but False Objections to the Discontinuation of Significance Testing in the Analysis of Research Data
|
L. Harlow, S. Mulaik, J. H. Steiger
|
2016
|
View Paper |
Beyond the classical monoscopic 3D in graph analytics: An experimental study of the impact of stereoscopy
|
Nicolas Greffard, Fabien Picarougne, P. Kuntz
|
2014
|
View Paper |
Comparison of interactive environments for the archaeological exploration of 3D landscape data
|
R. Bennett, David J. Zielinski, Regis Kopper
|
2014
|
View Paper |
The (possible) utility of stereoscopic 3D displays for information visualization: The good, the bad, and the ugly
|
J. McIntire, Kristen Liggett
|
2014
|
View Paper |
Benefits of 3D immersion for virtual colonoscopy
|
Koosha Mirhosseini, Qi Sun, K. Gurijala, B. Laha, A. Kaufman
|
2014
|
View Paper |
Interactive volume rendering for immersive virtual environments
|
Claudia Hänel, B. Weyers, B. Hentschel, T. Kuhlen
|
2014
|
View Paper |
ForceAtlas2, a Continuous Graph Layout Algorithm for Handy Network Visualization Designed for the Gephi Software
|
Mathieu Jacomy, T. Venturini, Sebastien Heymann, Mathieu Bastian
|
2014
|
View Paper |
Fast layout computation of clustered networks: Algorithmic advances and experimental analysis
|
W. Didimo, F. Montecchiani
|
2014
|
View Paper |
Group-Level Graph Visualization Taxonomy
|
B. Saket, Paolo Simonetto, S. Kobourov
|
2014
|
View Paper |
PIWI: Visually Exploring Graphs Based on Their Community Structure
|
Jing Yang, Yujie Liu, Xin Zhang, Xiaoru Yuan, Ye Zhao, S. Barlowe, Shixia Liu
|
2013
|
View Paper |
Spring Embedders and Force Directed Graph Drawing Algorithms
|
S. Kobourov
|
2012
|
View Paper |
Stereoscopic Highlighting: 2D Graph Visualization on Stereo Displays
|
Basak Alper, Tobias Höllerer, J. Kuchera-Morin, A. Forbes
|
2011
|
View Paper |
Skeleton-Based Edge Bundling for Graph Visualization
|
O. Ersoy, C. Hurter, F. Paulovich, Gabriel Cantareiro, A. Telea
|
2011
|
View Paper |
Community detection in graphs
|
S. Fortunato
|
2009
|
View Paper |
Force‐Directed Edge Bundling for Graph Visualization
|
Danny Holten, J. V. Wijk
|
2009
|
View Paper |
A hybrid space-filling and force-directed layout method for visualizing multiple-category graphs
|
Takayuki Itoh, C. Muelder, K. Ma, Jun Sese
|
2009
|
View Paper |
Exploring Semantic Social Networks Using Virtual Reality
|
H. Halpin, David J. Zielinski, R. Brady, Glenda Kelly
|
2008
|
View Paper |
Fast unfolding of communities in large networks
|
V. Blondel, Jean-Loup Guillaume, R. Lambiotte, E. Lefebvre
|
2008
|
View Paper |
Visualizing graphs in three dimensions
|
C. Ware, Peter Mitchell
|
2008
|
View Paper |
How to Draw ClusteredWeighted Graphs using a Multilevel Force-Directed Graph Drawing Algorithm
|
Romain Bourqui, D. Auber, Patrick Mary
|
2007
|
View Paper |
Hierarchical Edge Bundles: Visualization of Adjacency Relations in Hierarchical Data
|
Danny Holten
|
2006
|
View Paper |
Low-level components of analytic activity in information visualization
|
R. Amar, James R. Eagan, J. Stasko
|
2005
|
View Paper |
Flow map layout
|
Doantam Phan, Ling Xiao, Ron B. Yeh, P. Hanrahan, T. Winograd
|
2005
|
View Paper |
Reevaluating stereo and motion cues for visualizing graphs in three dimensions
|
C. Ware, Peter Mitchell
|
2005
|
View Paper |
3D User Interfaces: Theory and Practice
|
D. Bowman, E. Kruijff, J. Laviola, I. Poupyrev
|
2004
|
View Paper |
Immersive VR for Scientific Visualization: A Progress Report
|
A. V. Dam, Andrew S. Forsberg, D. Laidlaw, J. Laviola, R. M. Simpson
|
2000
|
View Paper |
Information visualization: perception for design by Colin Ware
|
Veit Jahns
|
2000
|
View Paper |
What's Real About Virtual Reality?
|
F. Brooks
|
1999
|
View Paper |
Collective dynamics of ‘small-world’ networks
|
D. Watts, S. Strogatz
|
1998
|
View Paper |
H3: laying out large directed graphs in 3D hyperbolic space
|
T. Munzner
|
1997
|
View Paper |
Evaluating stereo and motion cues for visualizing information nets in three dimensions
|
C. Ware, Glenn Franck
|
1996
|
View Paper |
Virtual reality in scientific visualization
|
S. Bryson
|
1993
|
View Paper |
Normal range of motion of the cervical spine: an initial goniometric study.
|
J. Youdas, T. R. Garrett, Vera J. Suman, C. Bogard, Horace O. Hallman, J. Carey
|
1992
|
View Paper |
Tree-maps: a space-filling approach to the visualization of hierarchical information structures
|
Brian Johnson, B. Shneiderman
|
1991
|
View Paper |
Cone Trees: animated 3D visualizations of hierarchical information
|
G. Robertson, J. Mackinlay, S. Card
|
1991
|
View Paper |
HTC Corporation
|
2020
|
||
PlayStation
|
2020
|
||
Oculus | Headsets & Equipment
|
2020
|
||
Samsung Gear
|
2020
|
||
MedicVR - Acceleration and Enhancement Techniques for Direct Volume Rendering in Virtual Reality
|
Ingrid Scholl, A. Bartella, Cem Moluluo, Berat Ertural, F. Laing, Sebastian Suder
|
2019
|
View Paper |
Immersiveanalyticsoflargedynamicnetworksviaoverviewanddetailnavigation Proceedings-2019IEEEInternationalConferenceonArtificialIntelligenceandVirtual Reality
|
2019
|
||
Direct Volume Rendering in Virtual Reality
|
Ingrid Scholl, Sebastian Suder, S. Schiffer
|
2018
|
View Paper |
Immersive Analytics: Time to Reconsider the Value of 3D for Information Visualisation
|
K. Marriott, Jian Chen, Marcel Hlawatsch, T. Itoh, Miguel A. Nacenta, G. Reina, W. Stuerzlinger
|
2018
|
View Paper |
WhatIfThereWereNoSignificanceTests?
|
2016
|
||
3D Graph Visualization with the Oculus Rift
|
Farshad Barahimi, S. Wismath
|
2014
|
View Paper |
The New Statistics: Why and How
|
2014
|
||
Lecture Notes in Computer Science (including subseries Lecture Notes in Artificial Intelligence and Lecture Notes in Bioinformatics)
|
F. Amirabdollahian, K. Dautenhahn, C. Dixon, K. Eder, Michael Fisher, K. Koay, E. Magid, Tony Pipe, Maha Salem, J. Saunders, M. Webster
|
2013
|
View Paper |
Task Taxonomy for Graph Visualization Categories and Subject Descriptors
|
2006
|
||
Graph Visualization and Navigation in Information Visualization: A Survey
|
I. Herman, G. Melançon, M. S. Marshall
|
2000
|
View Paper |
Cognitive Architecture and Instructional Design
|
J. Sweller, J. V. van Merrienboer, F. Paas
|
1998
|
View Paper |
ThreeDimensionalInformationVisualization
|
1996
|
||
Chapter 3 – Perceiving Layout and Knowing Distances: The Integration, Relative Potency, and Contextual Use of Different Information about Depth*
|
J. Cutting, P. Vishton
|
1995
|
View Paper |
The Information Cube: Using Transparency in 3D Information Visualization
|
Mark W. Green
|
1993
|
View Paper |
Development of NASA-TLX (Task Load Index): Results of Empirical and Theoretical Research
|
S. Hart, L. Staveland
|
1988
|
View Paper |
The magical number seven plus or minus two: some limits on our capacity for processing information.
|
G. A. Miller
|
1956
|
View Paper |
Collectivedynamicsof ‘ small-world ’ networks
|
D. Watts, S. Strogatz
|
View Paper | |
A Multi-Layout Design for Immersive Visualization of Network Data • 13
|
Showing first page preview. Click "Open Full PDF" to view the complete paper.
Wei Zeng, Yihan Hou, Hao Cui, Rongrong Chen
Published: 2024-03-26
You need to log in to post a comment.
Your comment contains inappropriate language.
Are you sure you want to remove this tag?
Someone just favorited a paper!
Comments (0)