Academic Profile
Statistics
Similar Authors
Papers on arXiv
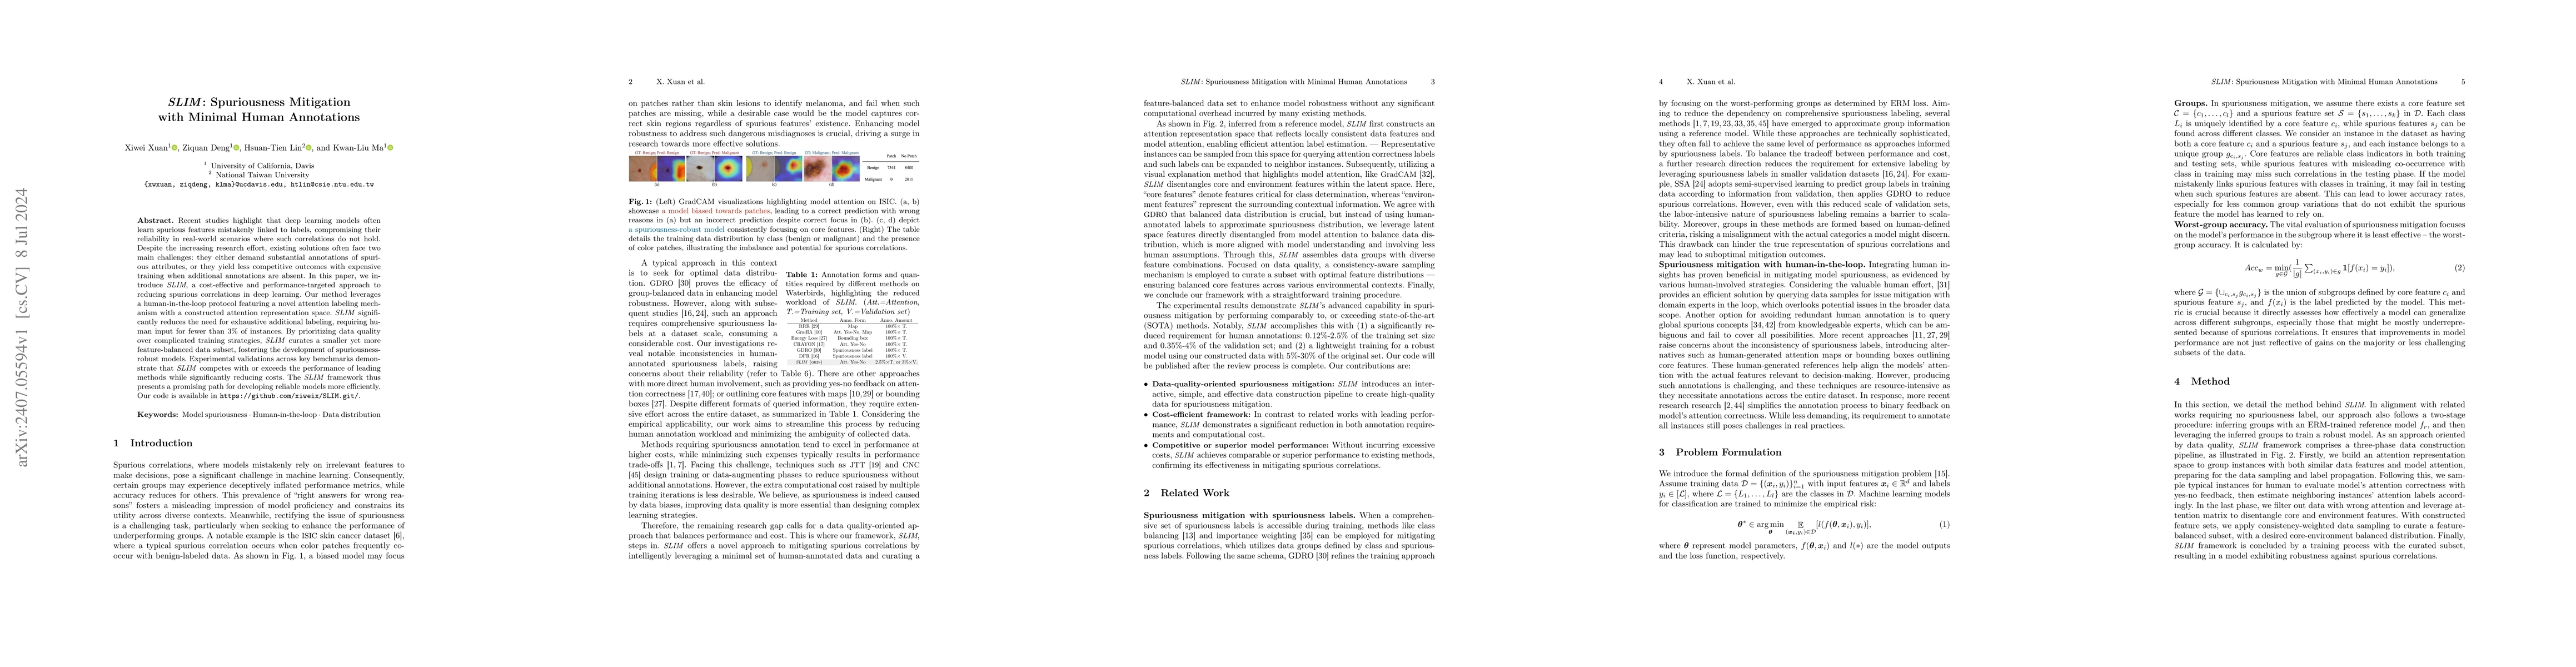
Recent studies highlight that deep learning models often learn spurious features mistakenly linked to labels, compromising their reliability in real-world scenarios where such correlations do not hold...
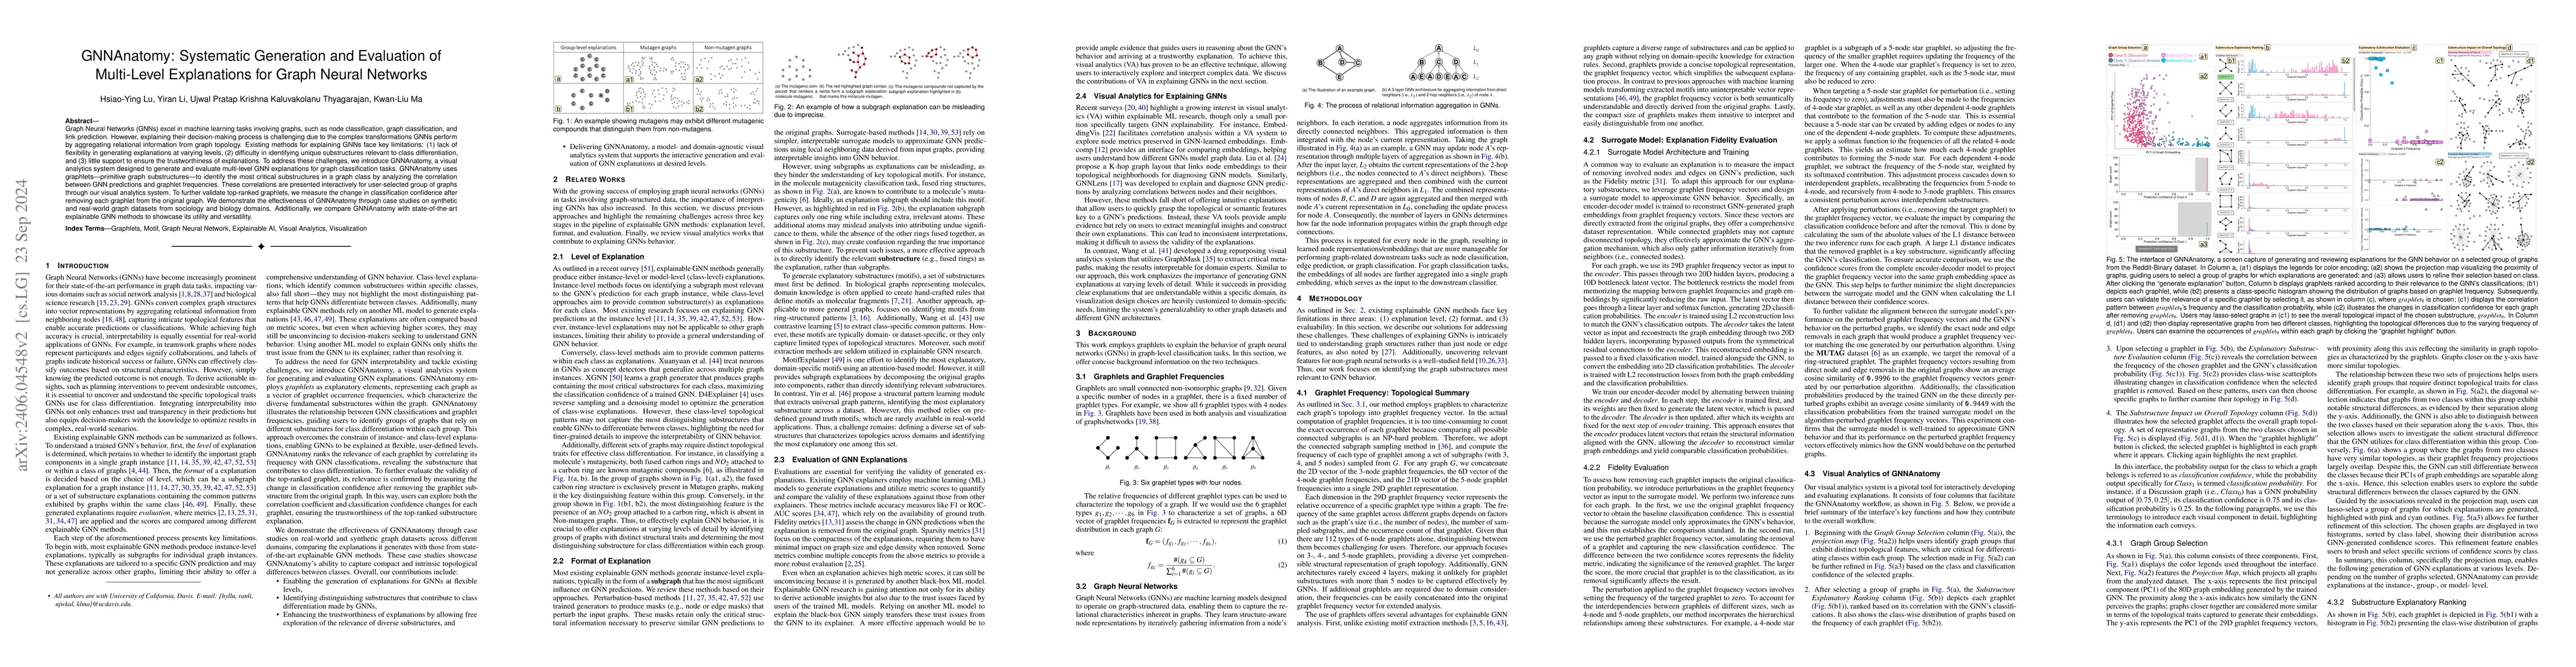
Graph Neural Networks (GNNs) have proven highly effective in various machine learning (ML) tasks involving graphs, such as node/graph classification and link prediction. However, explaining the deci...
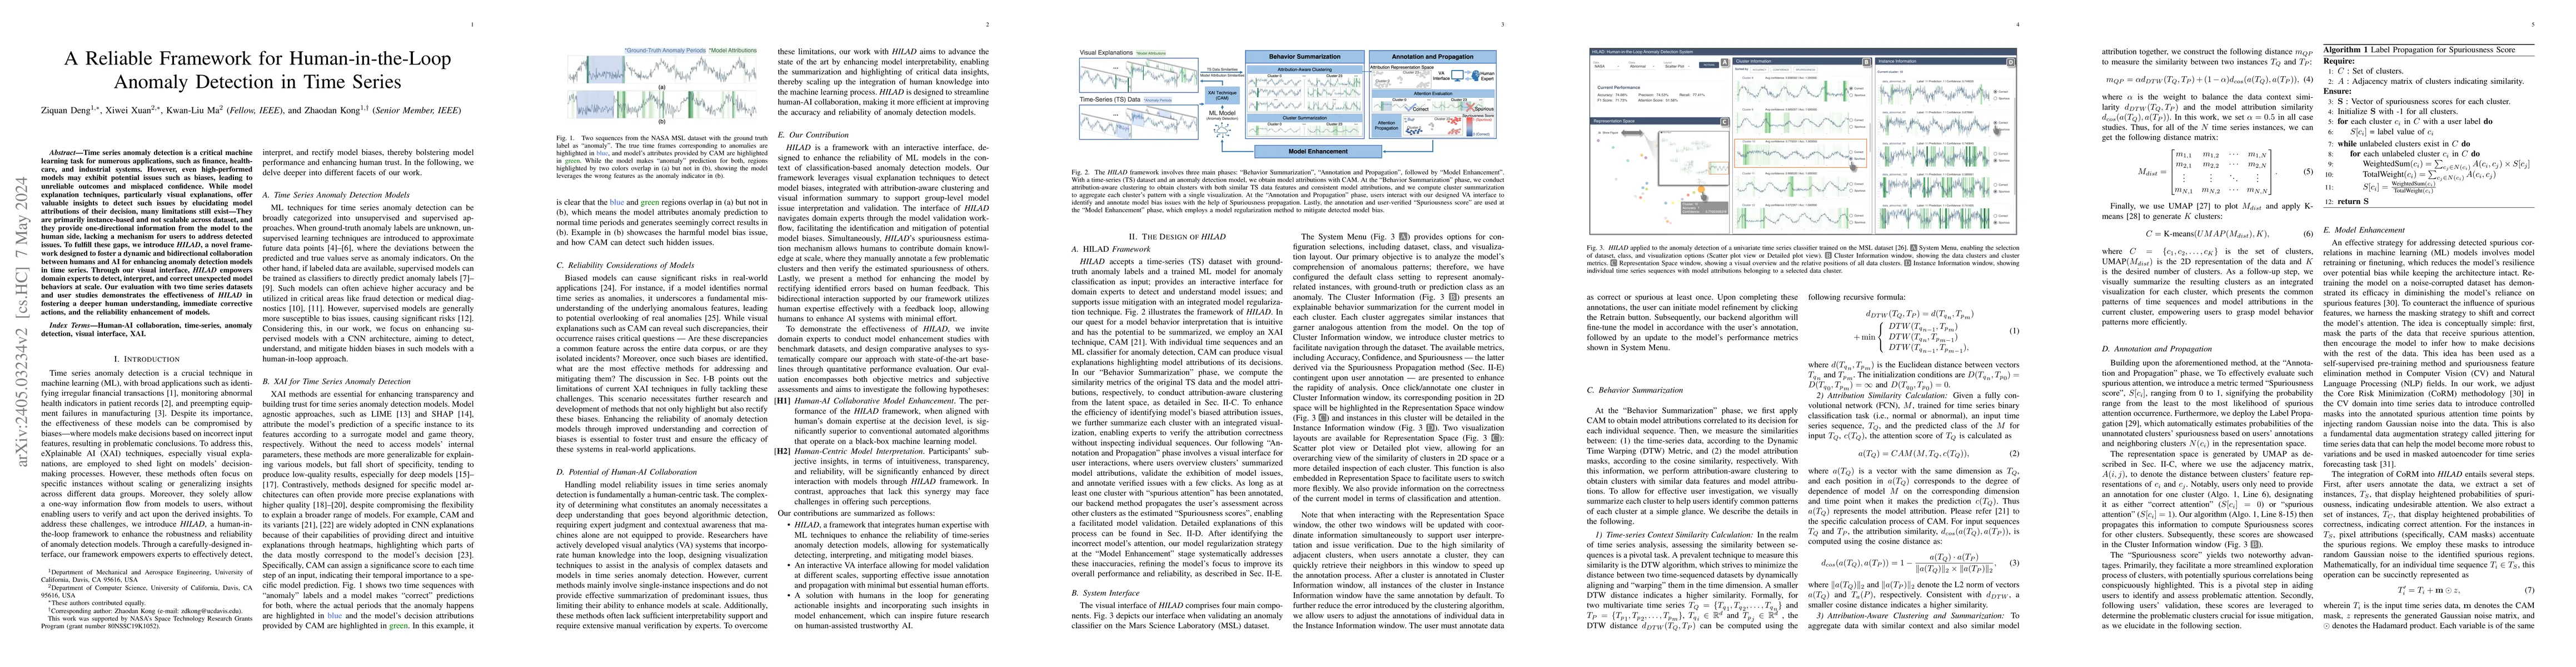
Time series anomaly detection is a critical machine learning task for numerous applications, such as finance, healthcare, and industrial systems. However, even high-performed models may exhibit pote...
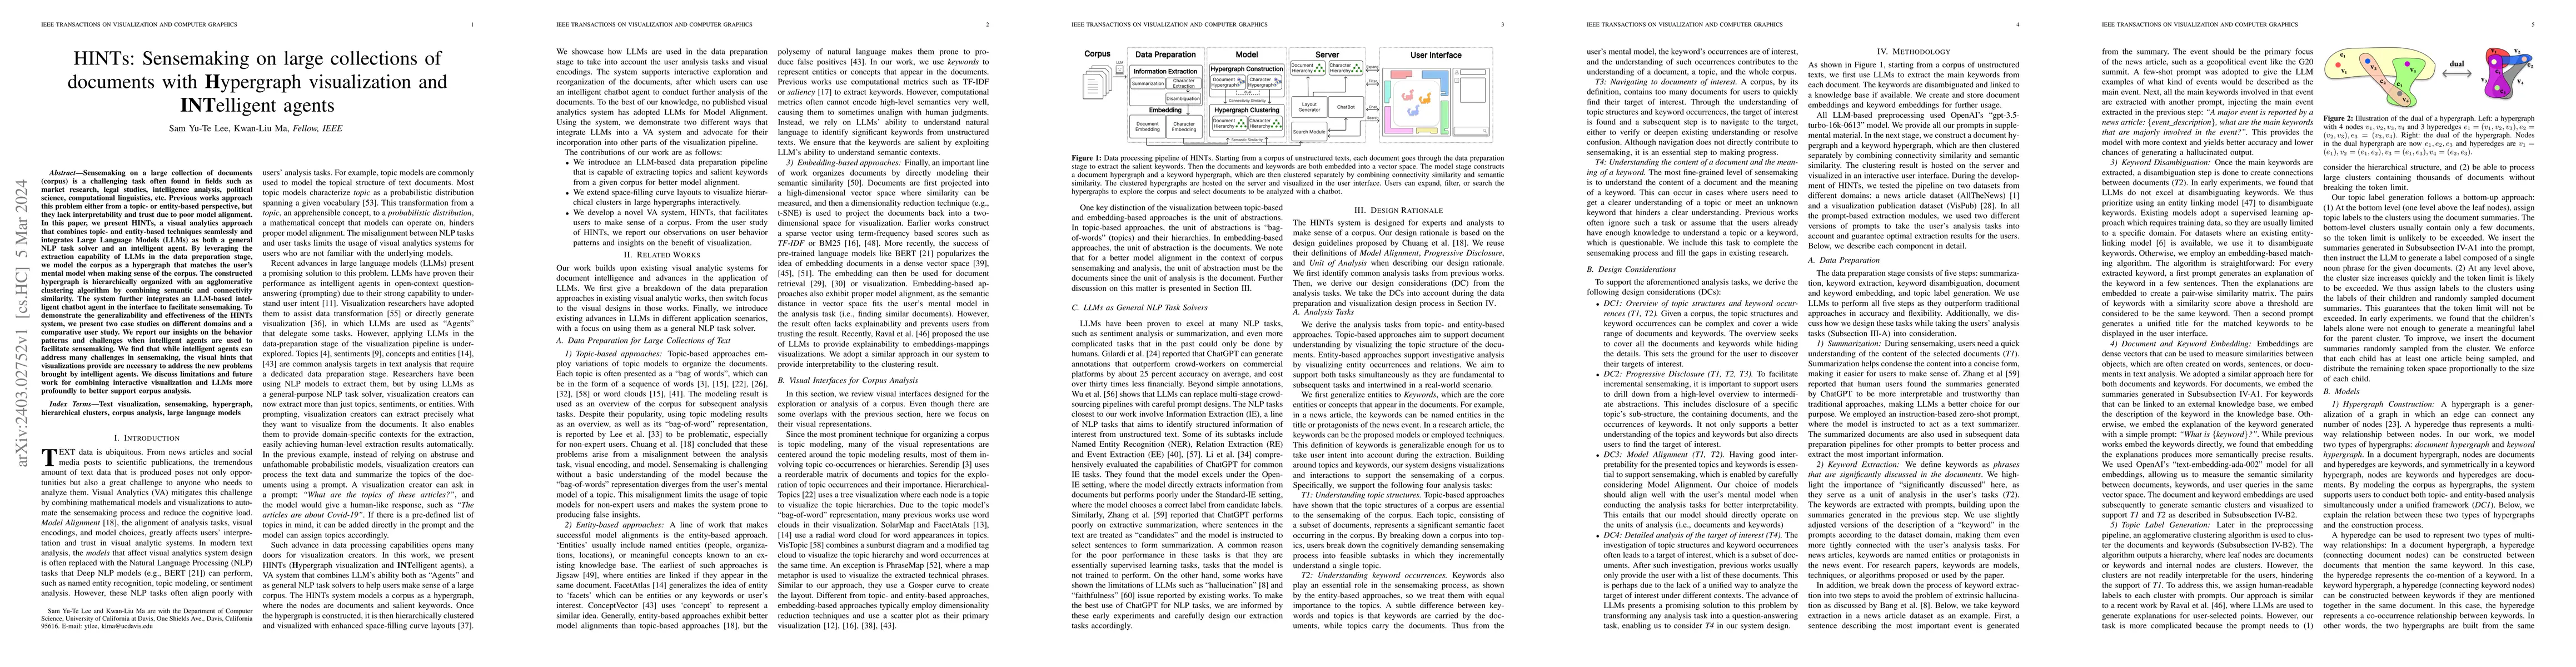
Sensemaking on a large collection of documents (corpus) is a challenging task often found in fields such as market research, legal studies, intelligence analysis, political science, computational li...
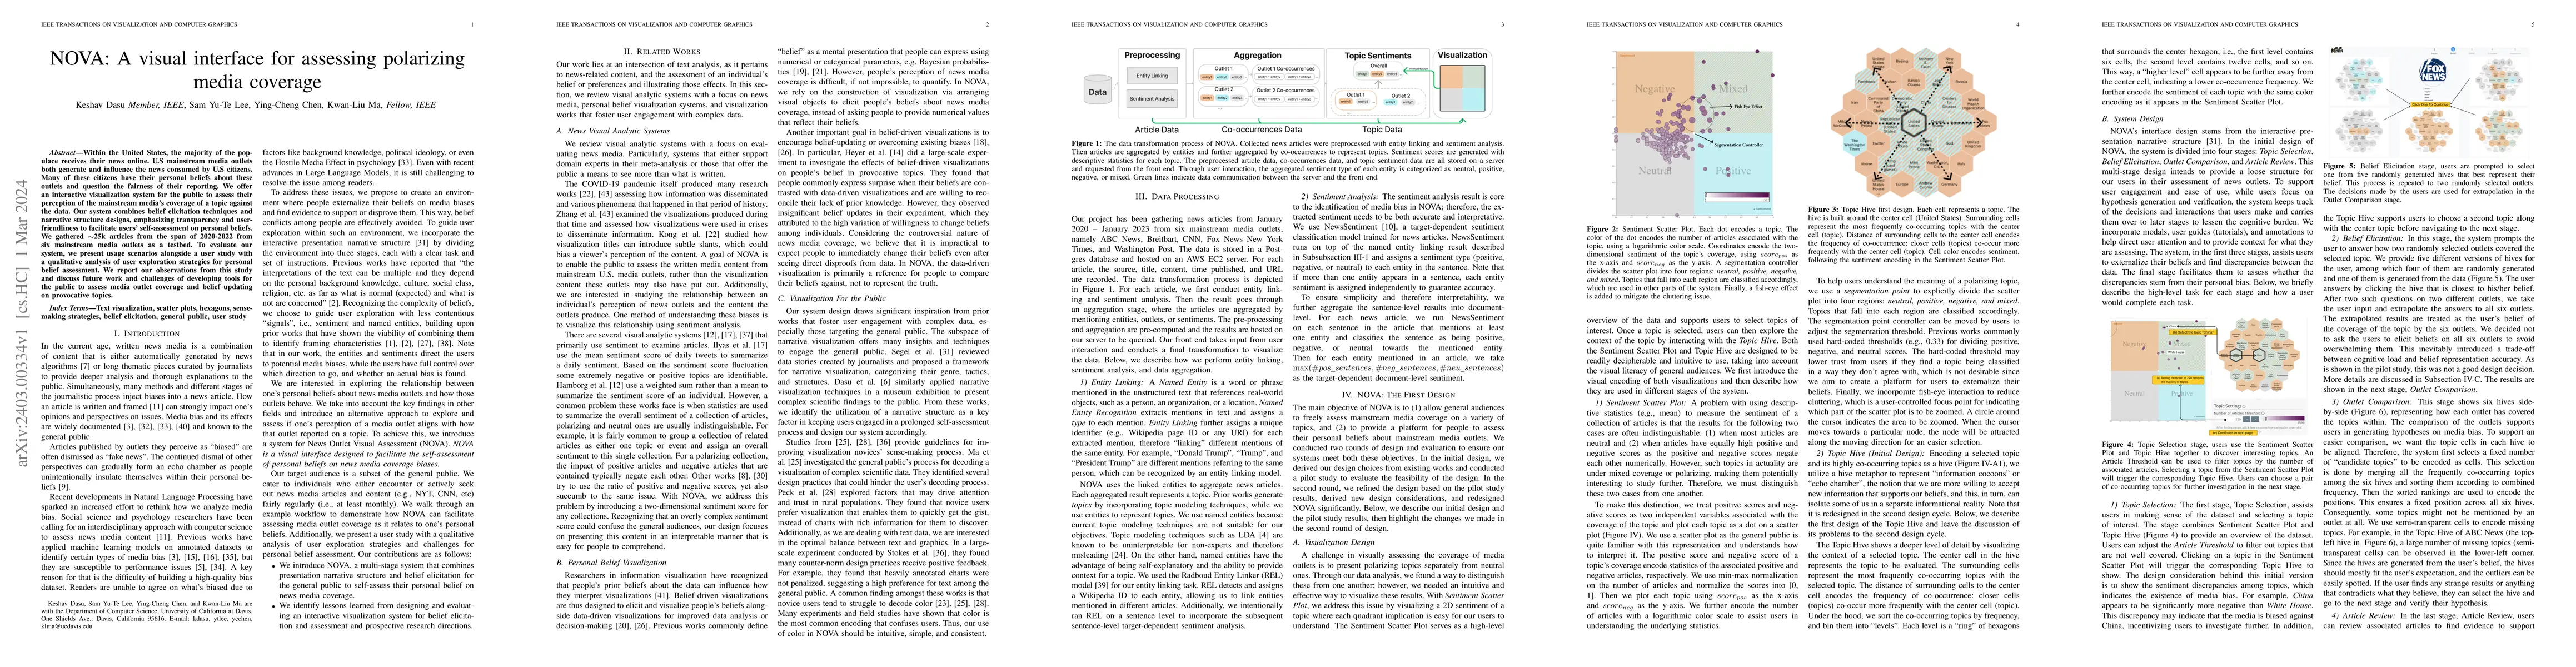
Within the United States, the majority of the populace receives their news online. U.S mainstream media outlets both generate and influence the news consumed by U.S citizens. Many of these citizens ...
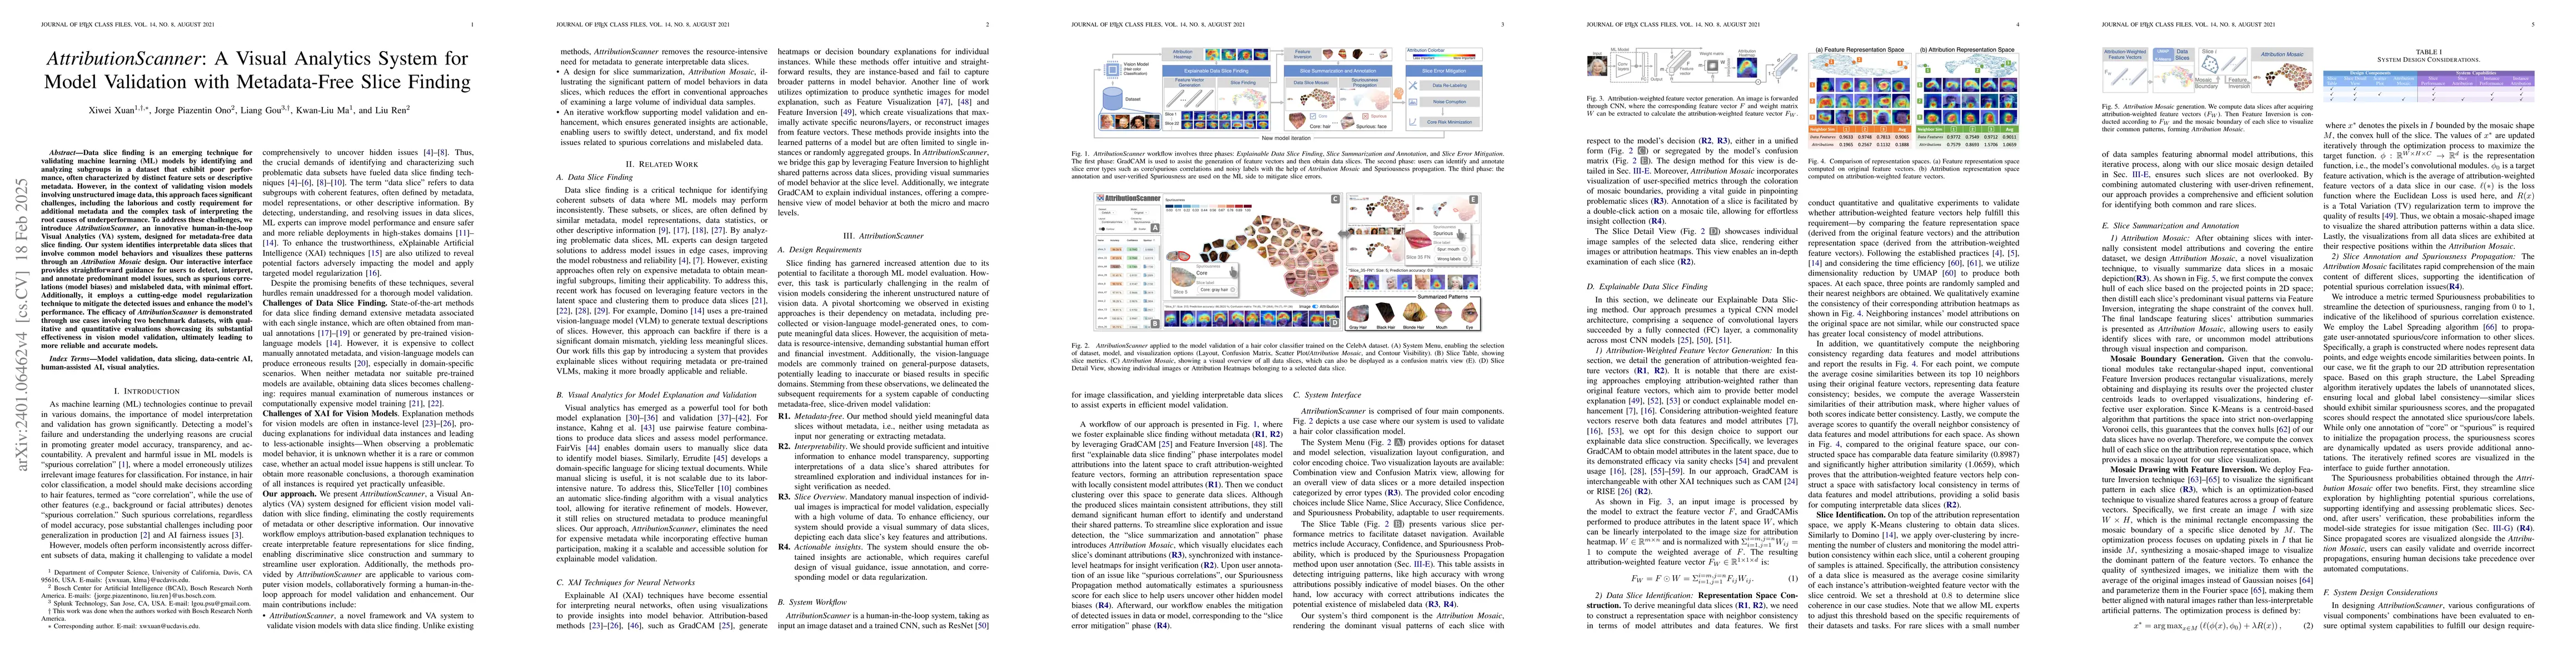
Data slice finding is an emerging technique for validating machine learning (ML) models by identifying and analyzing subgroups in a dataset that exhibit poor performance, often characterized by dist...
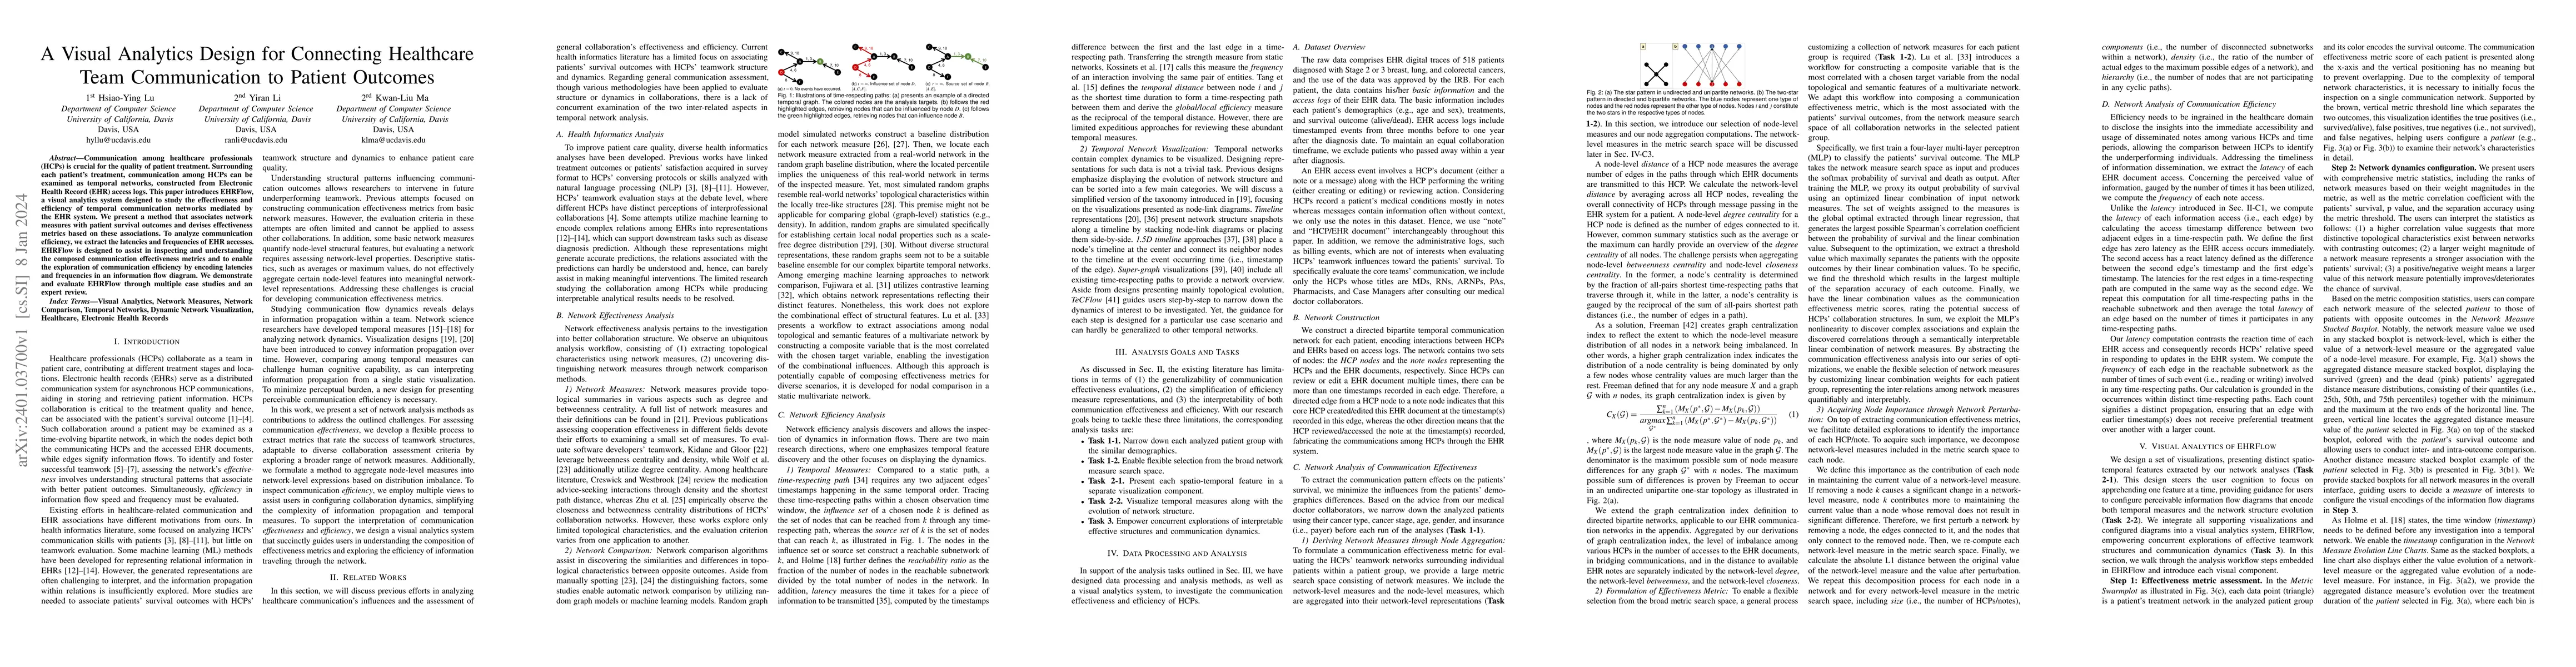
Communication among healthcare professionals (HCPs) is crucial for the quality of patient treatment. Surrounding each patient's treatment, communication among HCPs can be examined as temporal networ...
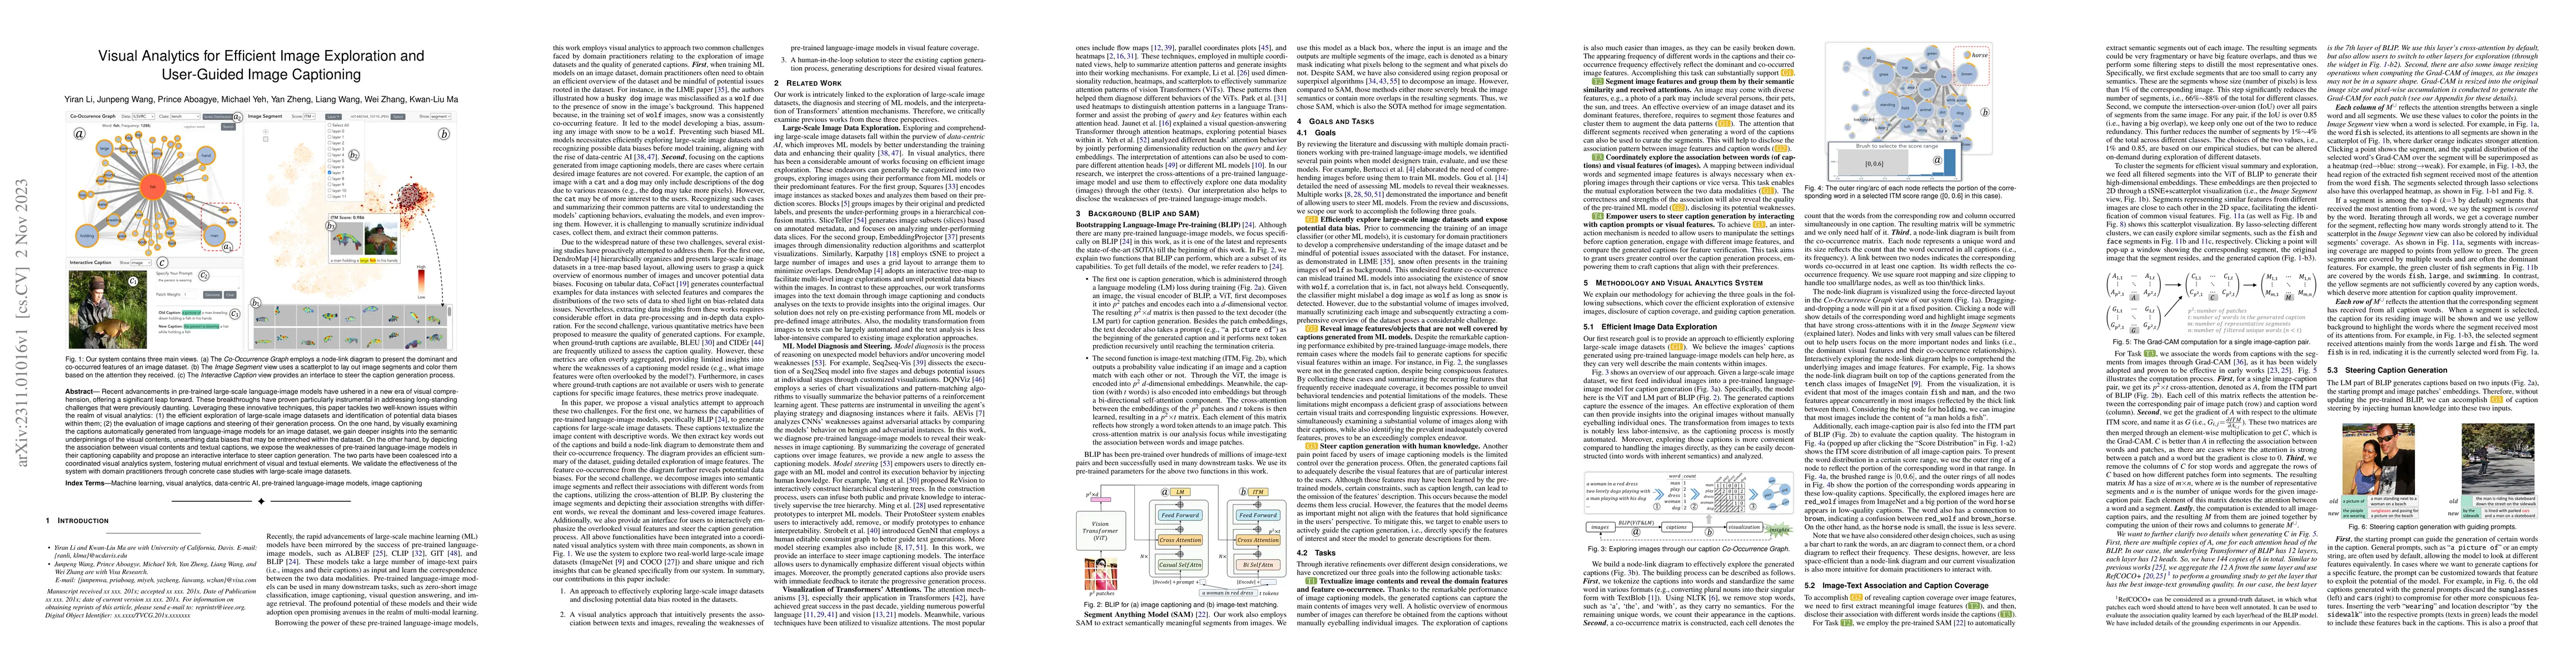
Recent advancements in pre-trained large-scale language-image models have ushered in a new era of visual comprehension, offering a significant leap forward. These breakthroughs have proven particula...
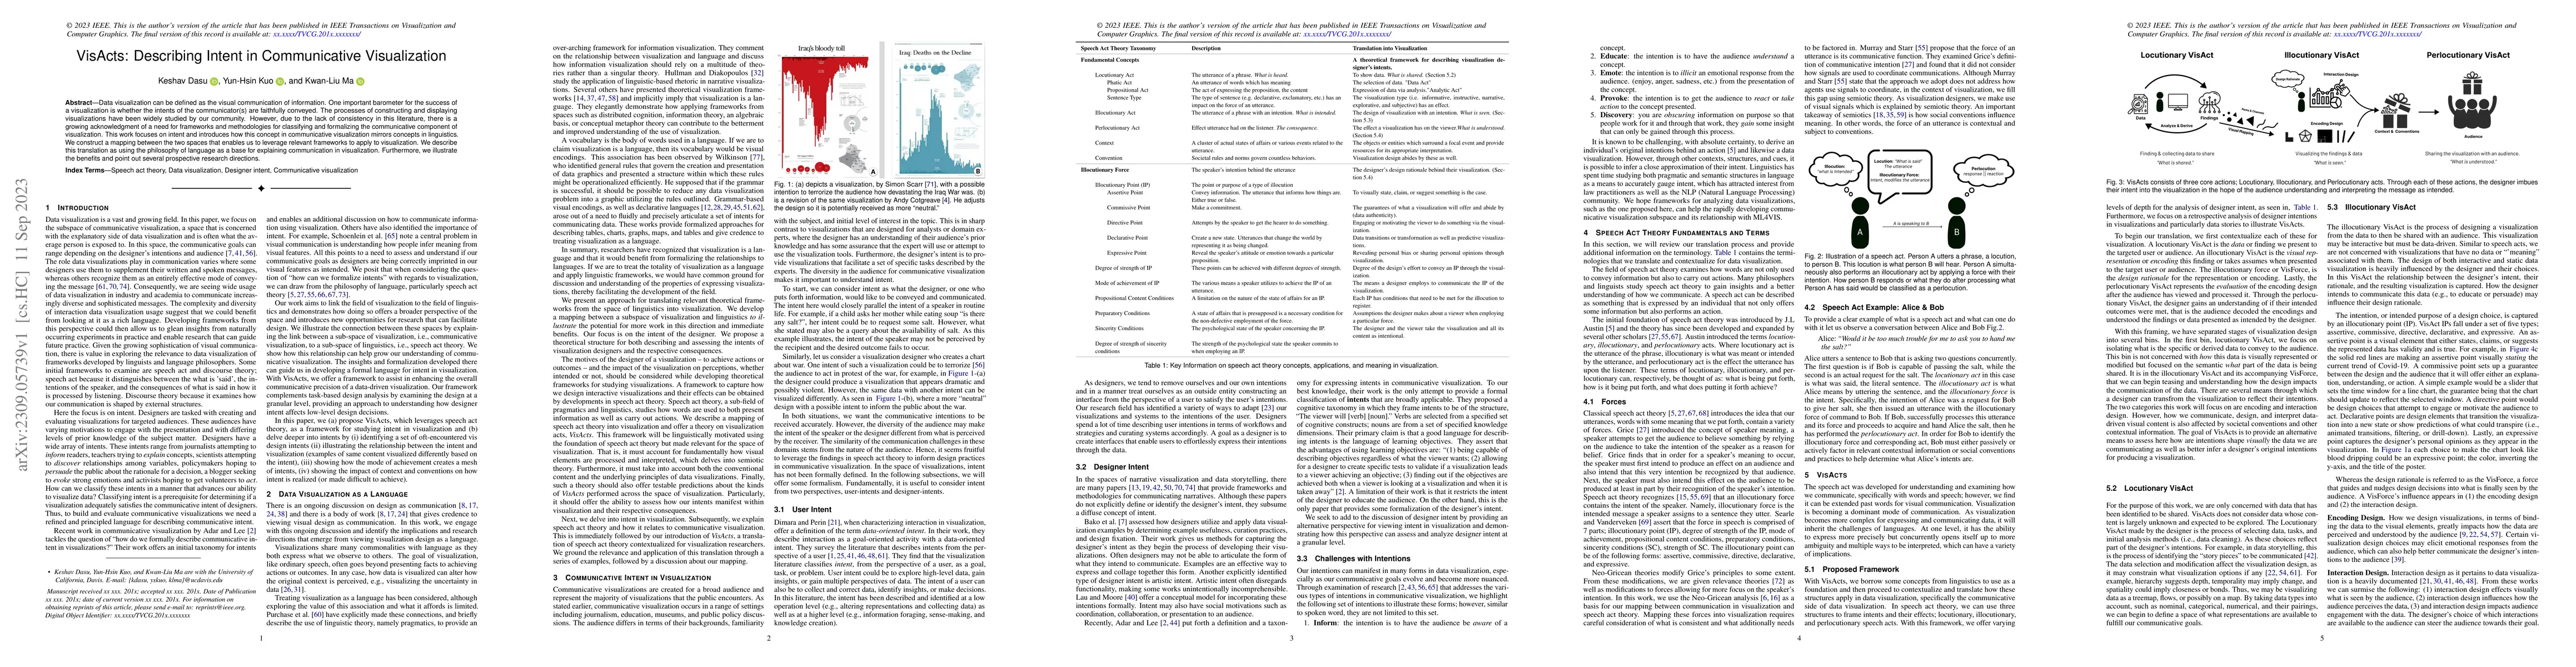
Data visualization can be defined as the visual communication of information. One important barometer for the success of a visualization is whether the intents of the communicator(s) are faithfully ...
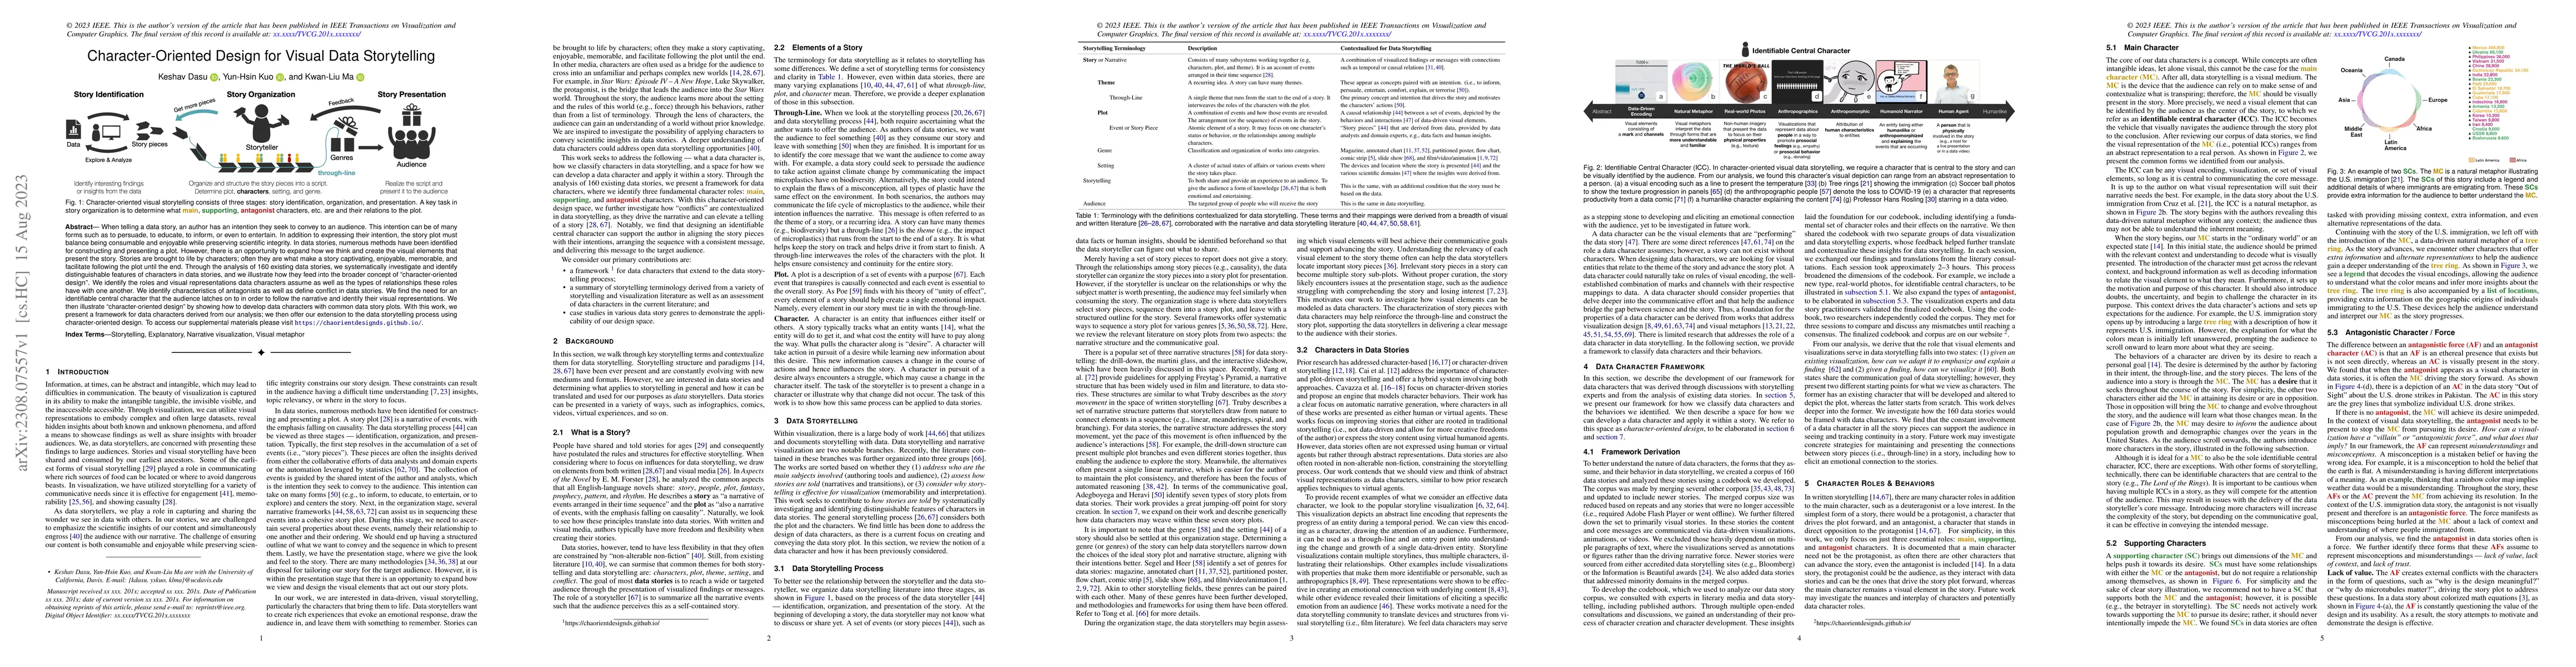
When telling a data story, an author has an intention they seek to convey to an audience. This intention can be of many forms such as to persuade, to educate, to inform, or even to entertain. In add...
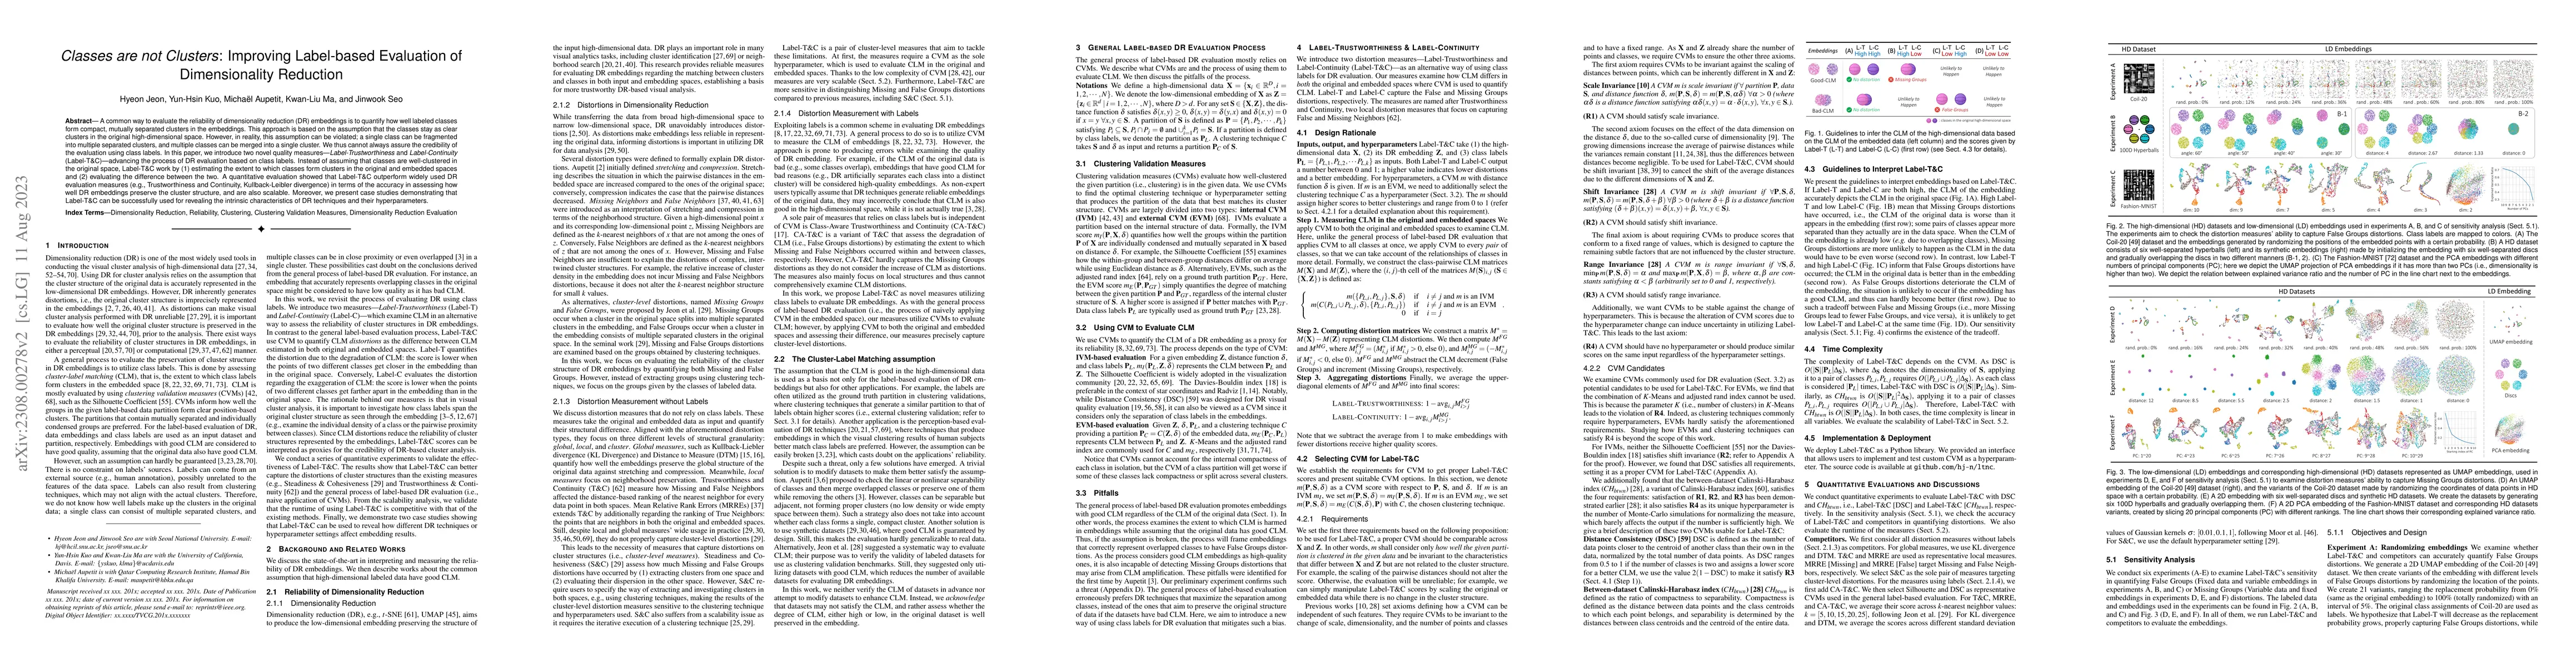
A common way to evaluate the reliability of dimensionality reduction (DR) embeddings is to quantify how well labeled classes form compact, mutually separated clusters in the embeddings. This approac...
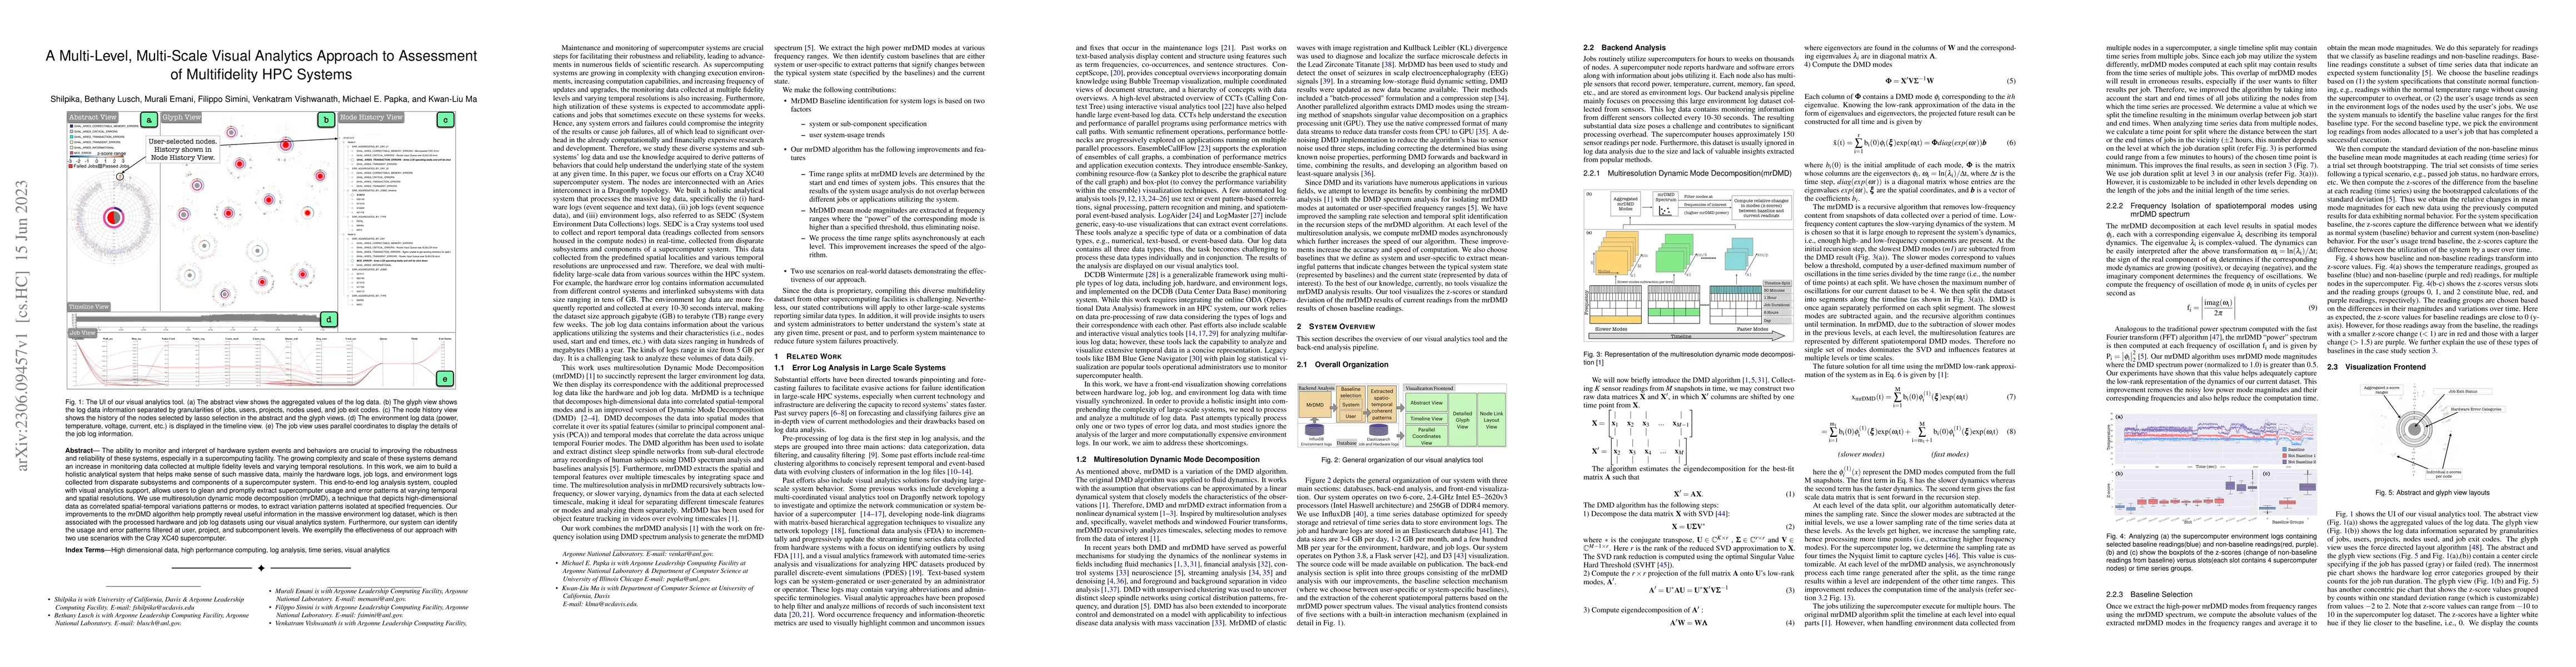
The ability to monitor and interpret of hardware system events and behaviors are crucial to improving the robustness and reliability of these systems, especially in a supercomputing facility. The gr...
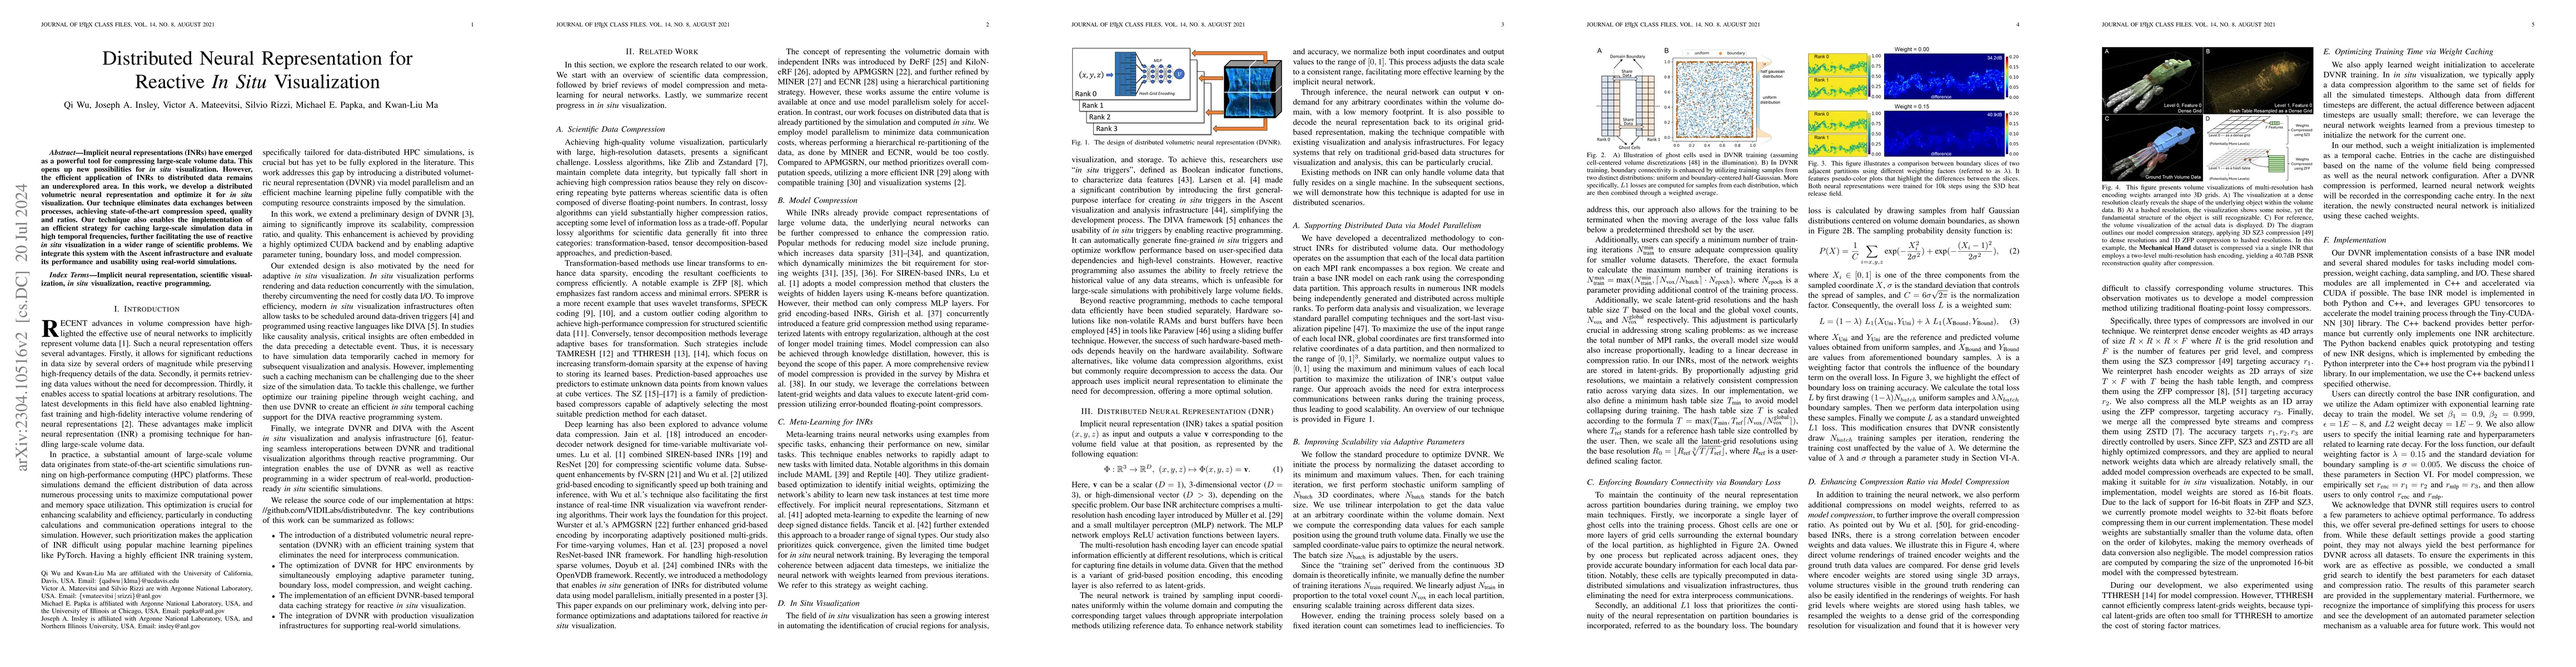
In situ visualization and steering of computational modeling can be effectively achieved using reactive programming, which leverages temporal abstraction and data caching mechanisms to create dynami...
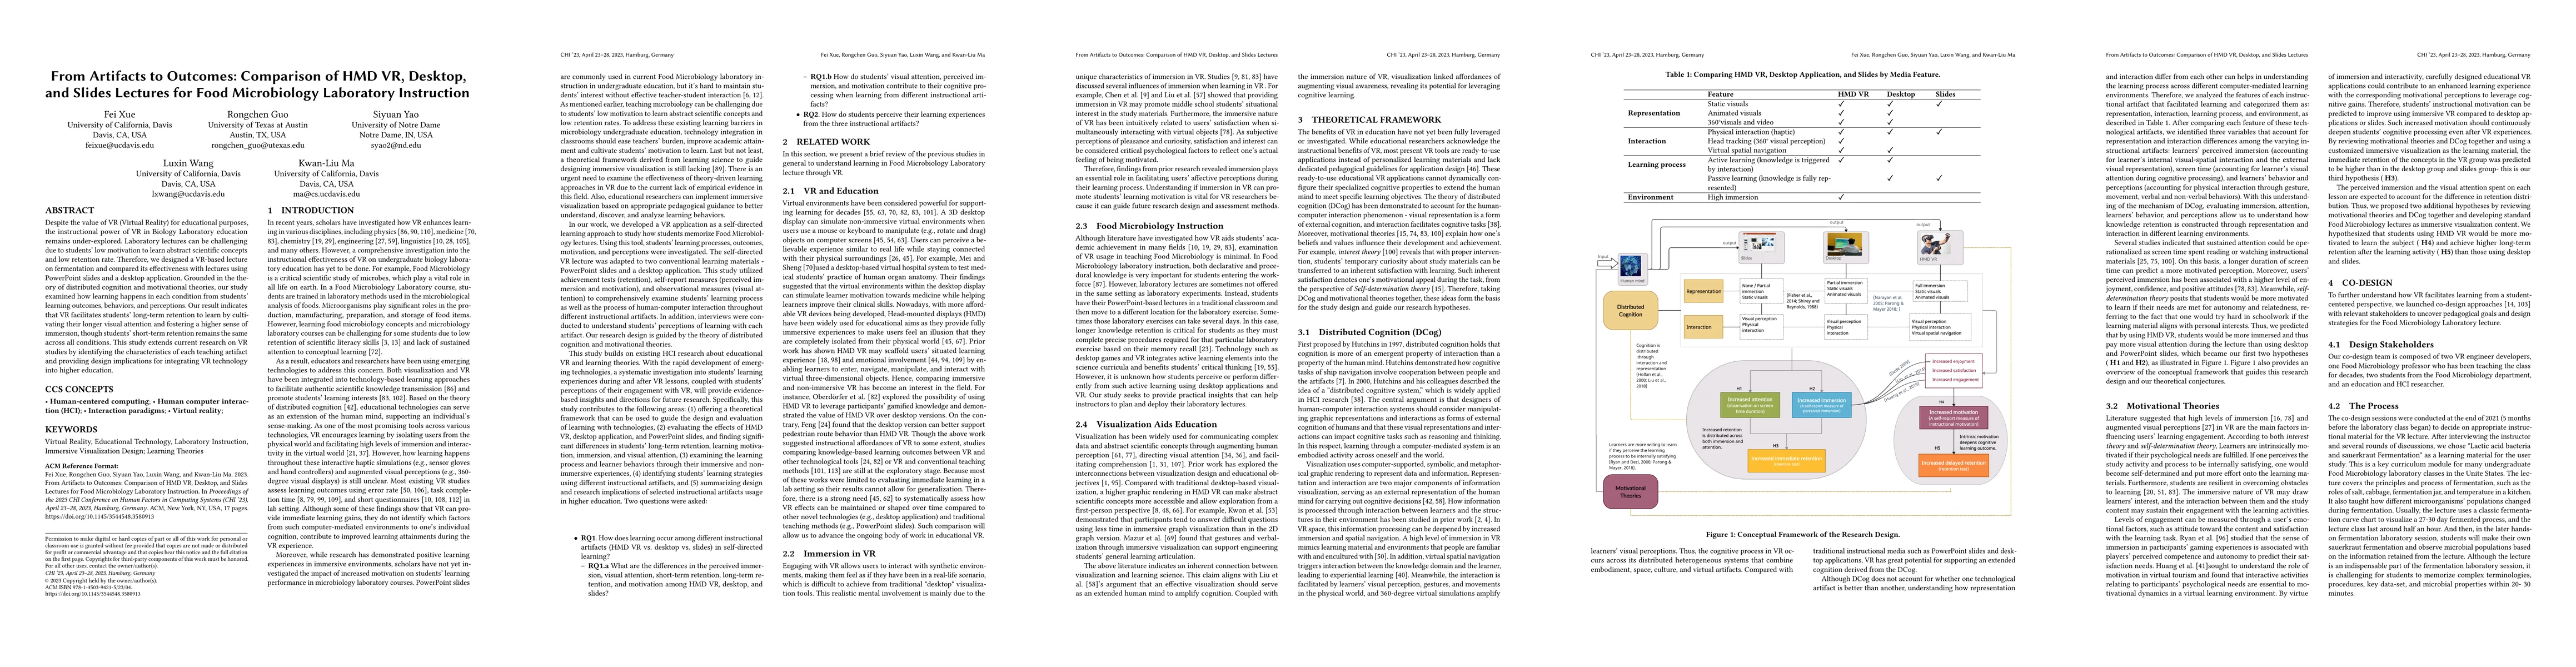
Despite the value of VR (Virtual Reality) for educational purposes, the instructional power of VR in Biology Laboratory education remains under-explored. Laboratory lectures can be challenging due t...
Volume data is commonly found in many scientific disciplines, like medicine, physics, and biology. Experts rely on robust scientific visualization techniques to extract valuable insights from the da...
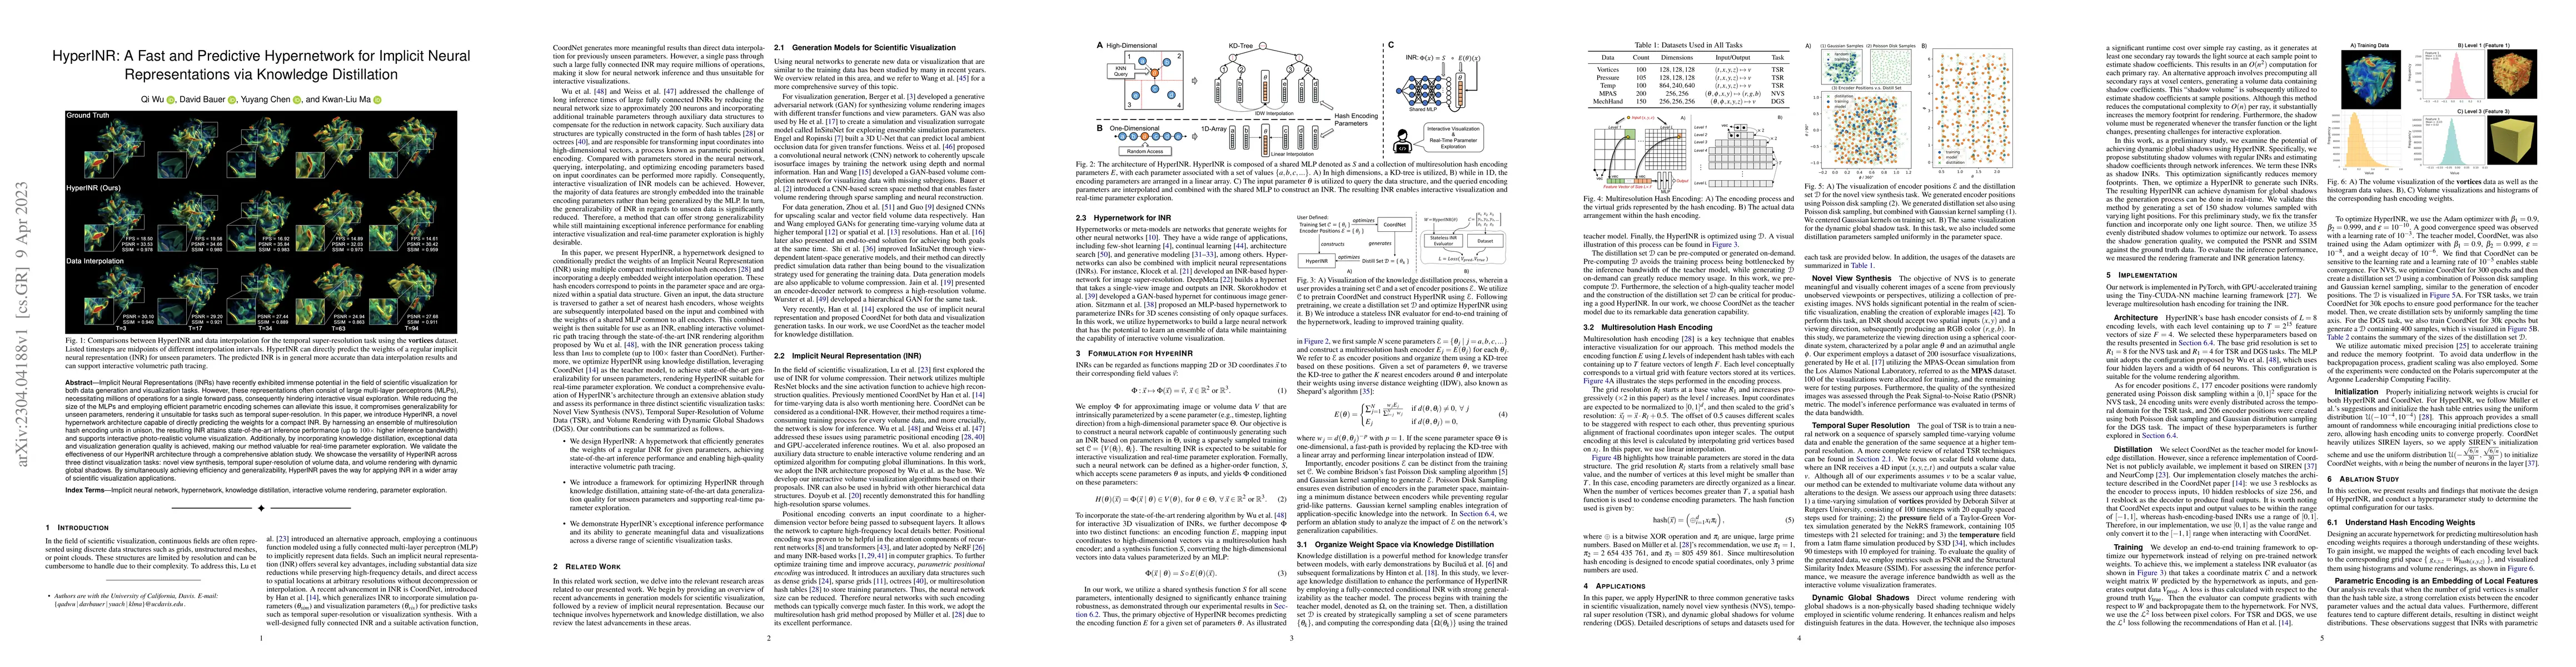
Implicit Neural Representations (INRs) have recently exhibited immense potential in the field of scientific visualization for both data generation and visualization tasks. However, these representat...
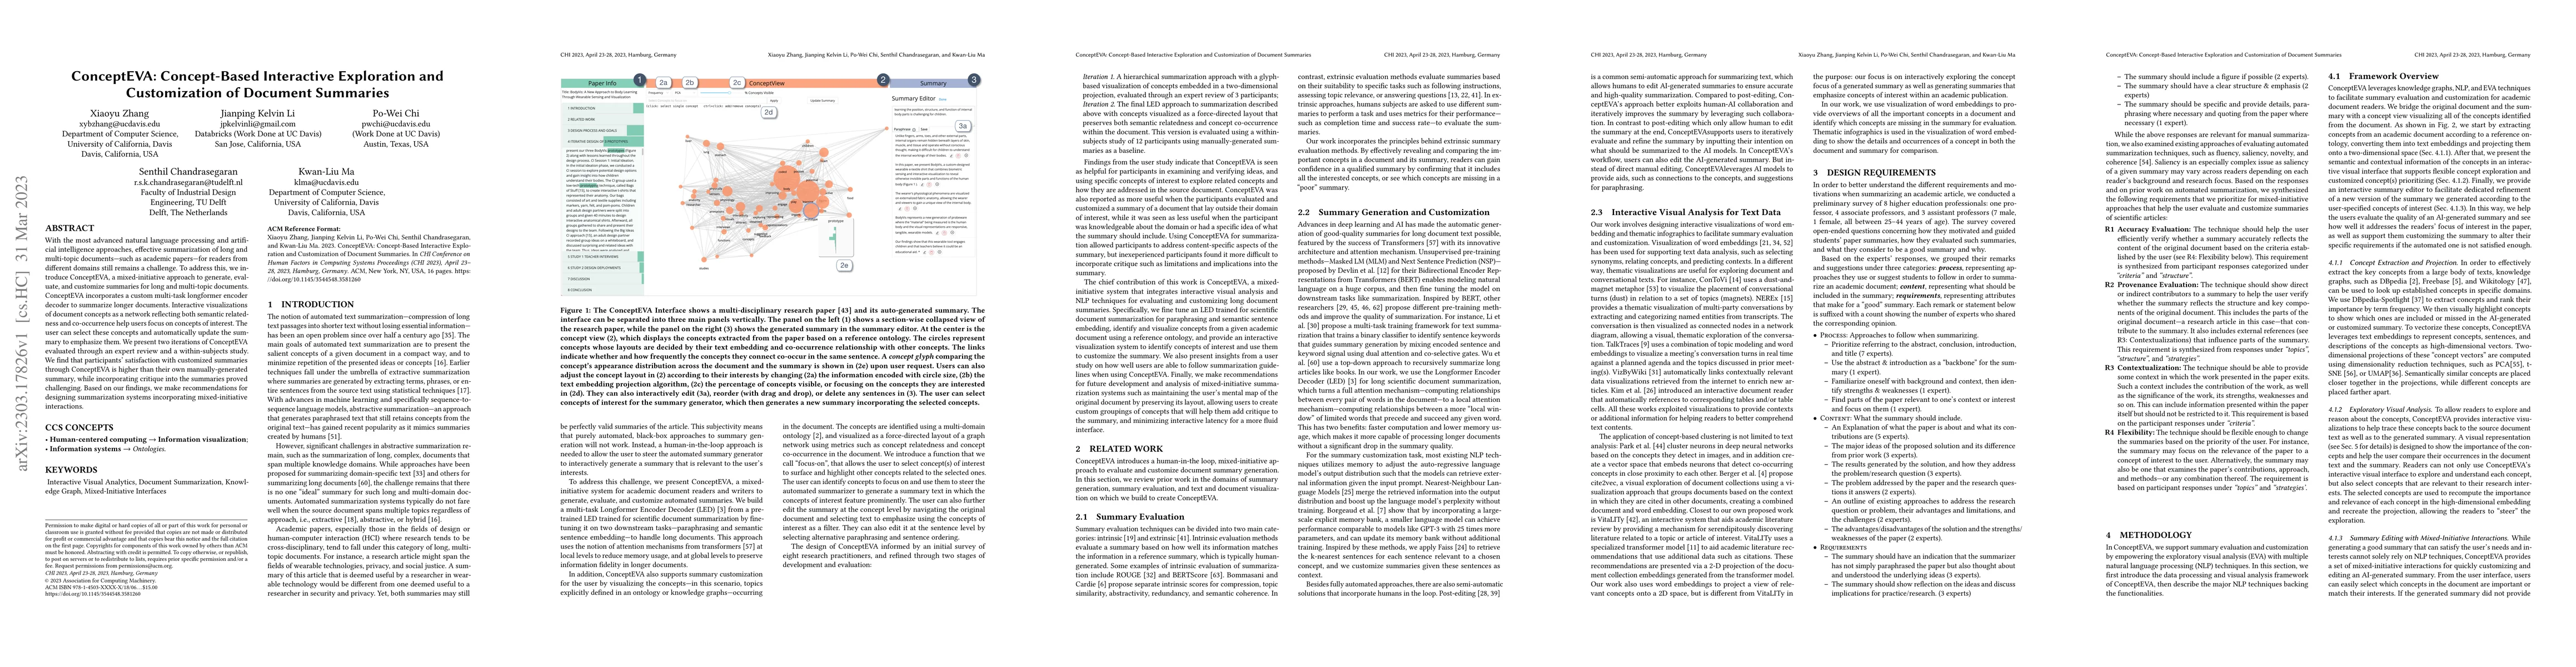
With the most advanced natural language processing and artificial intelligence approaches, effective summarization of long and multi-topic documents -- such as academic papers -- for readers from di...
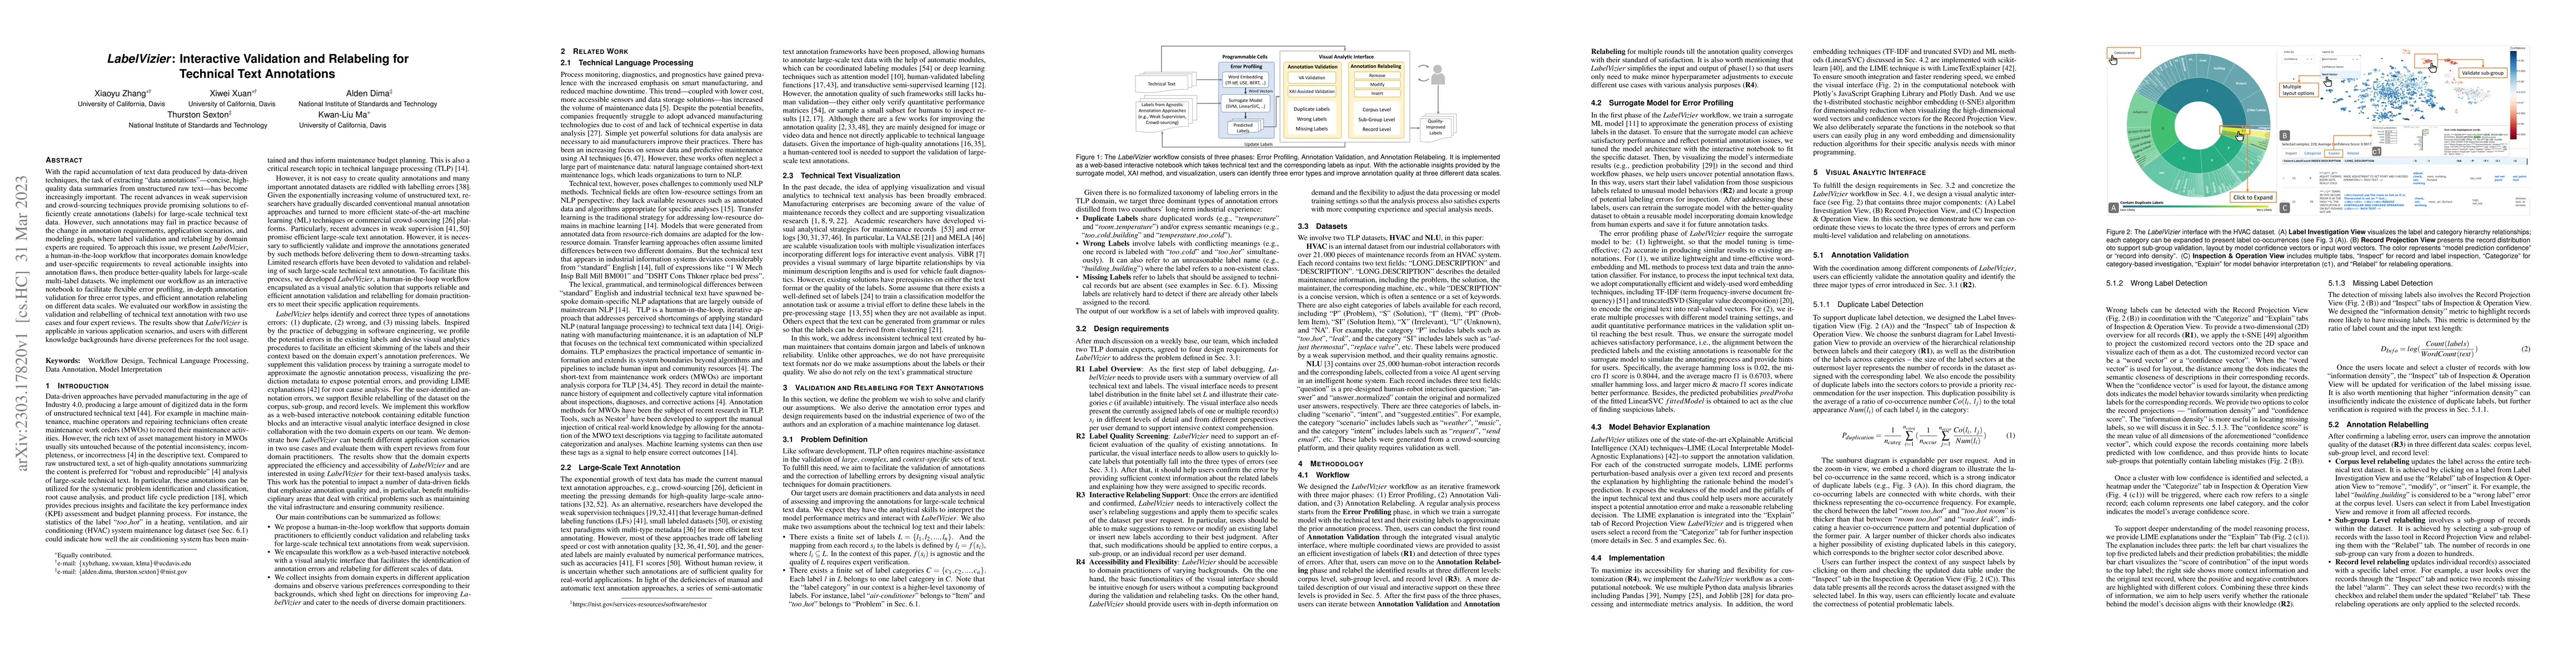
With the rapid accumulation of text data produced by data-driven techniques, the task of extracting "data annotations"--concise, high-quality data summaries from unstructured raw text--has become in...
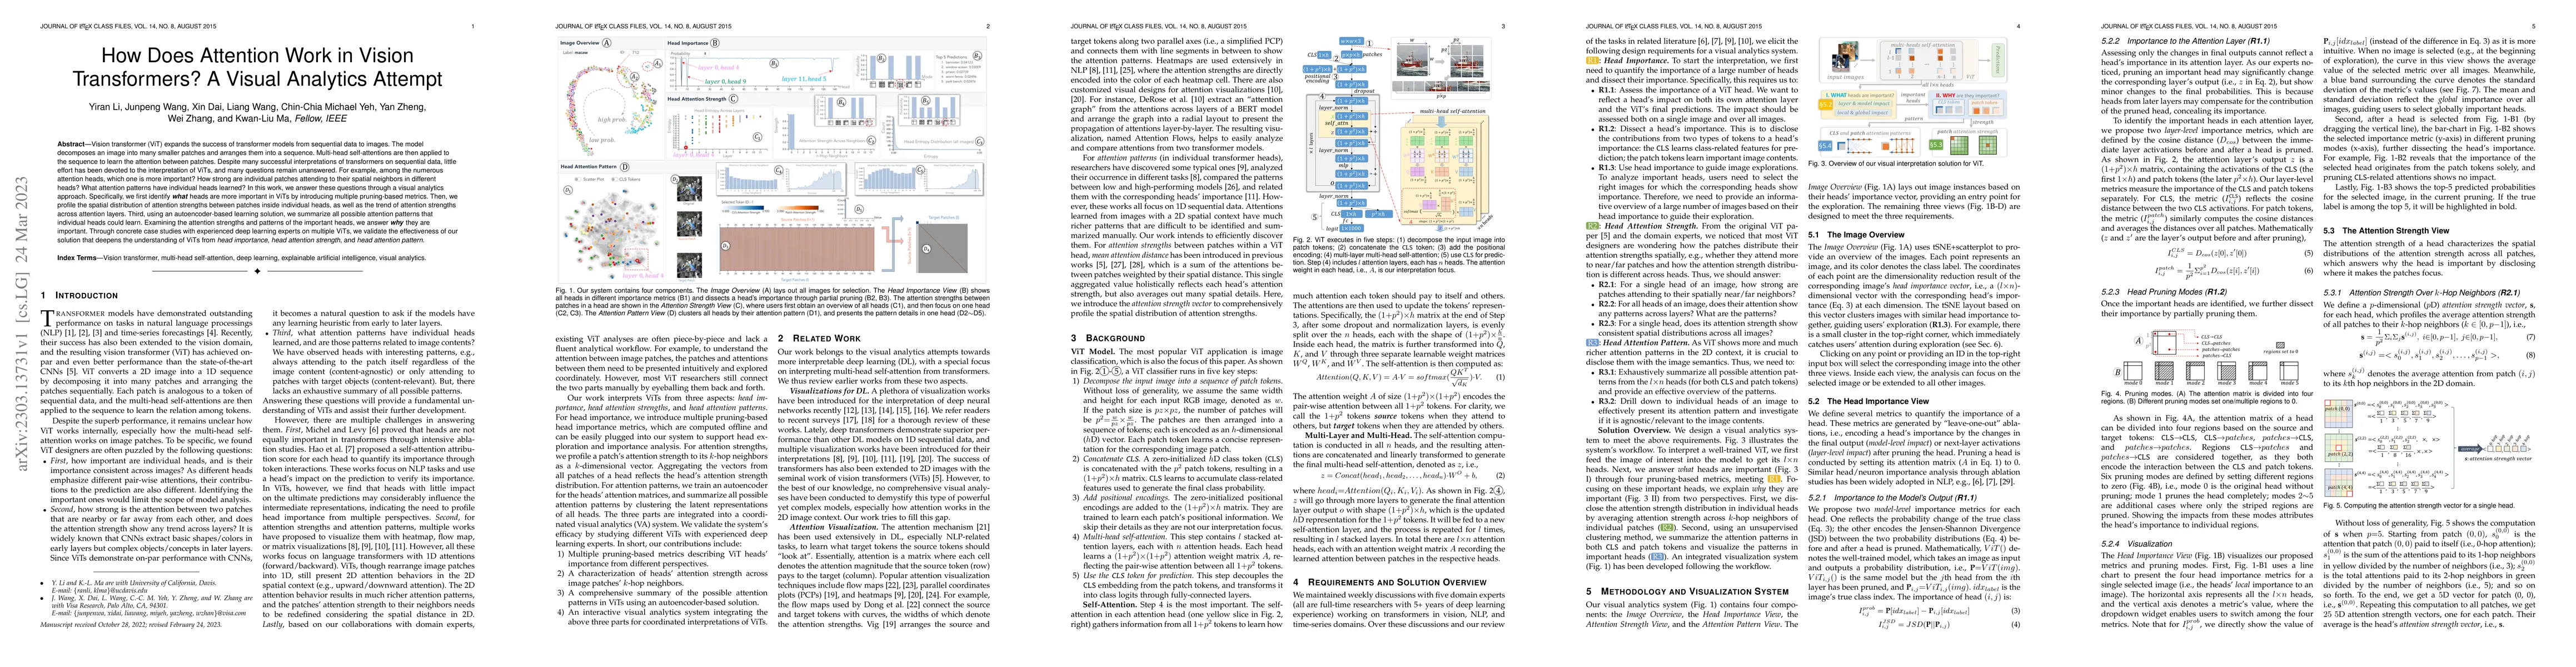
Vision transformer (ViT) expands the success of transformer models from sequential data to images. The model decomposes an image into many smaller patches and arranges them into a sequence. Multi-he...
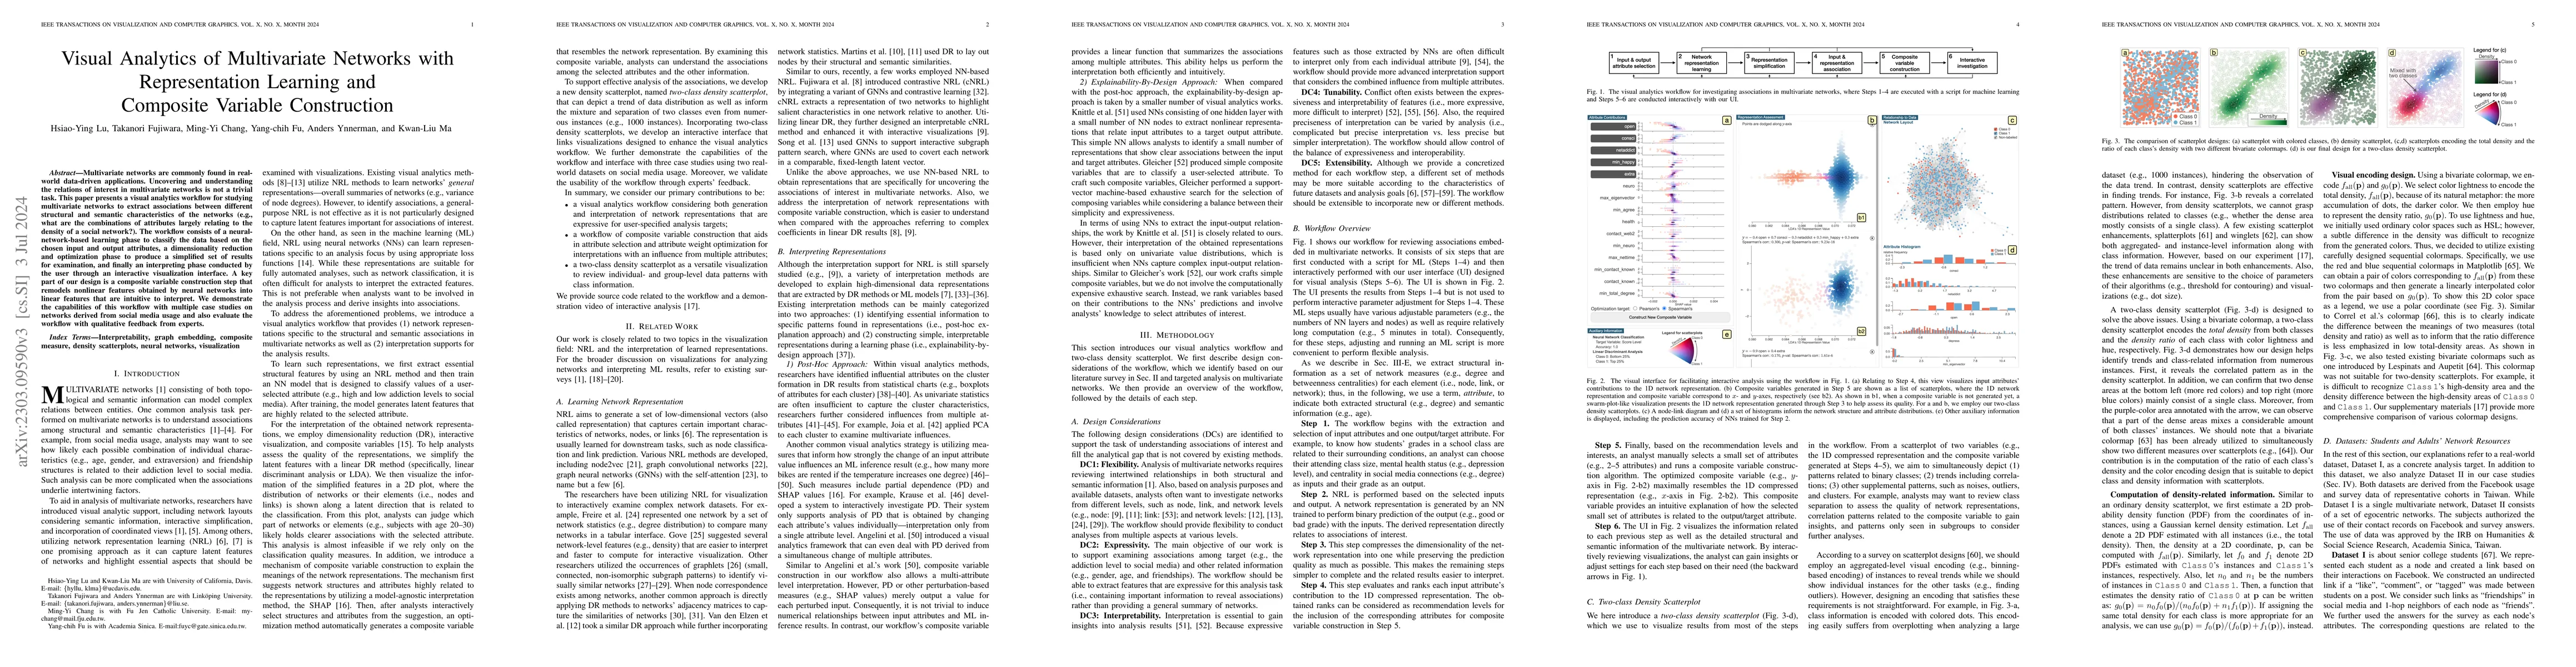
Multivariate networks are commonly found in real-world data-driven applications. Uncovering and understanding the relations of interest in multivariate networks is not a trivial task. This paper pre...
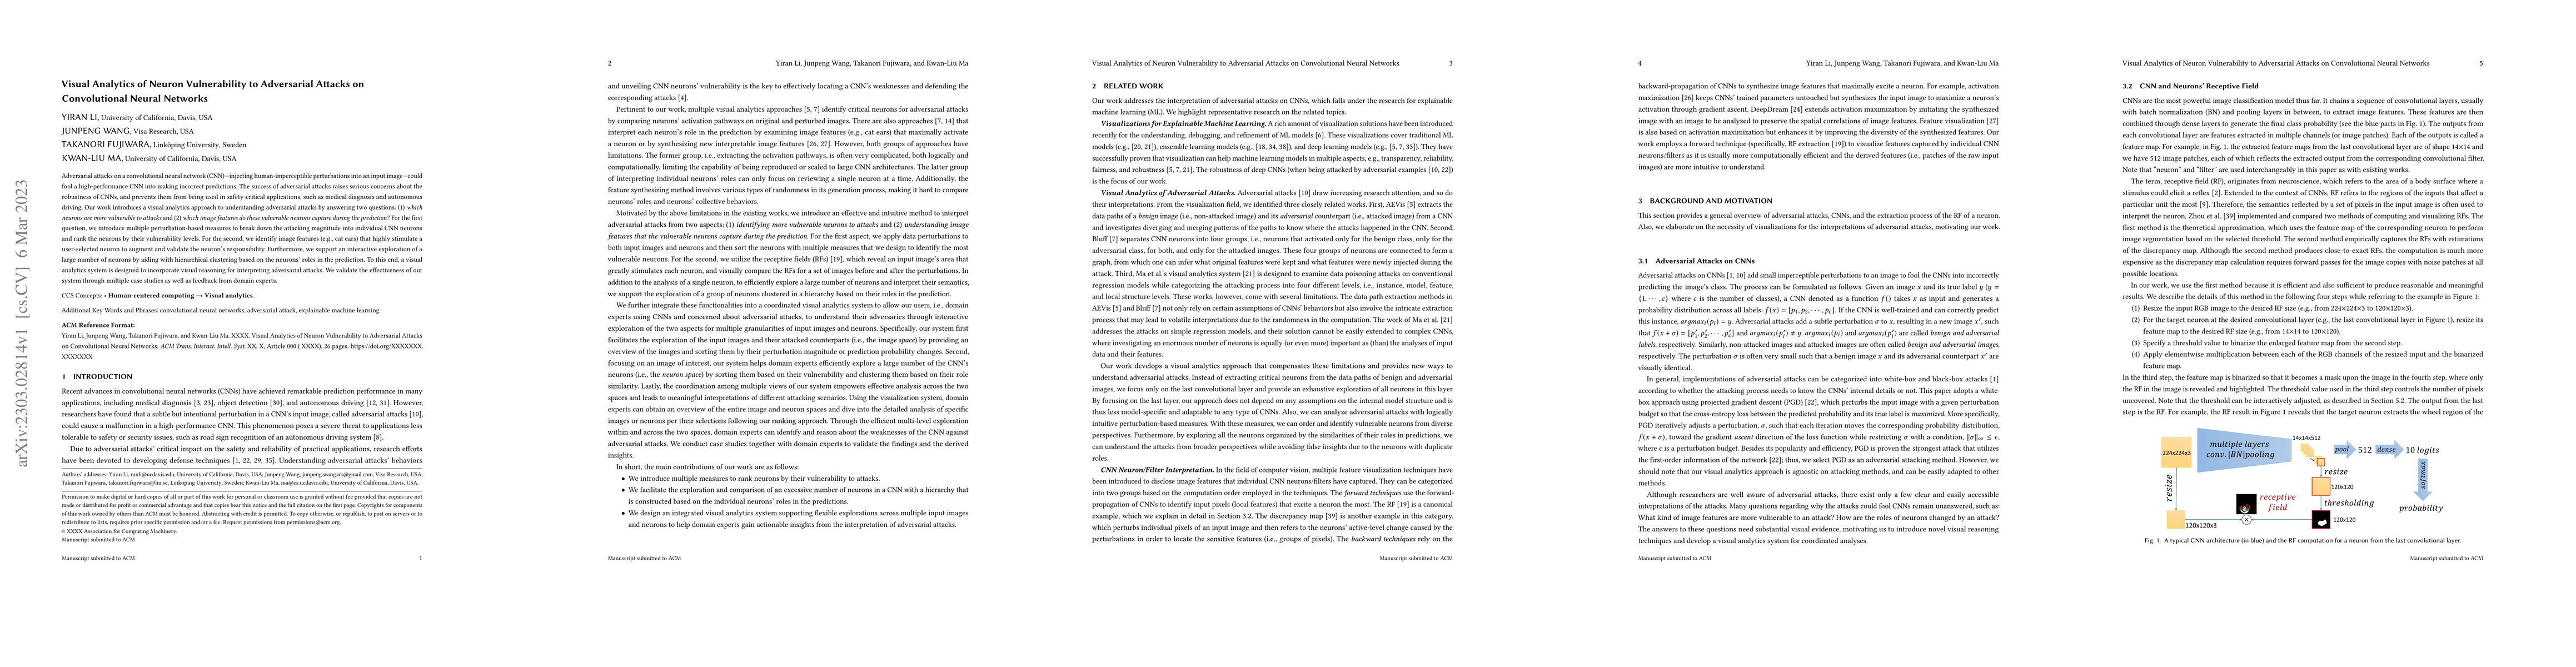
Adversarial attacks on a convolutional neural network (CNN) -- injecting human-imperceptible perturbations into an input image -- could fool a high-performance CNN into making incorrect predictions....
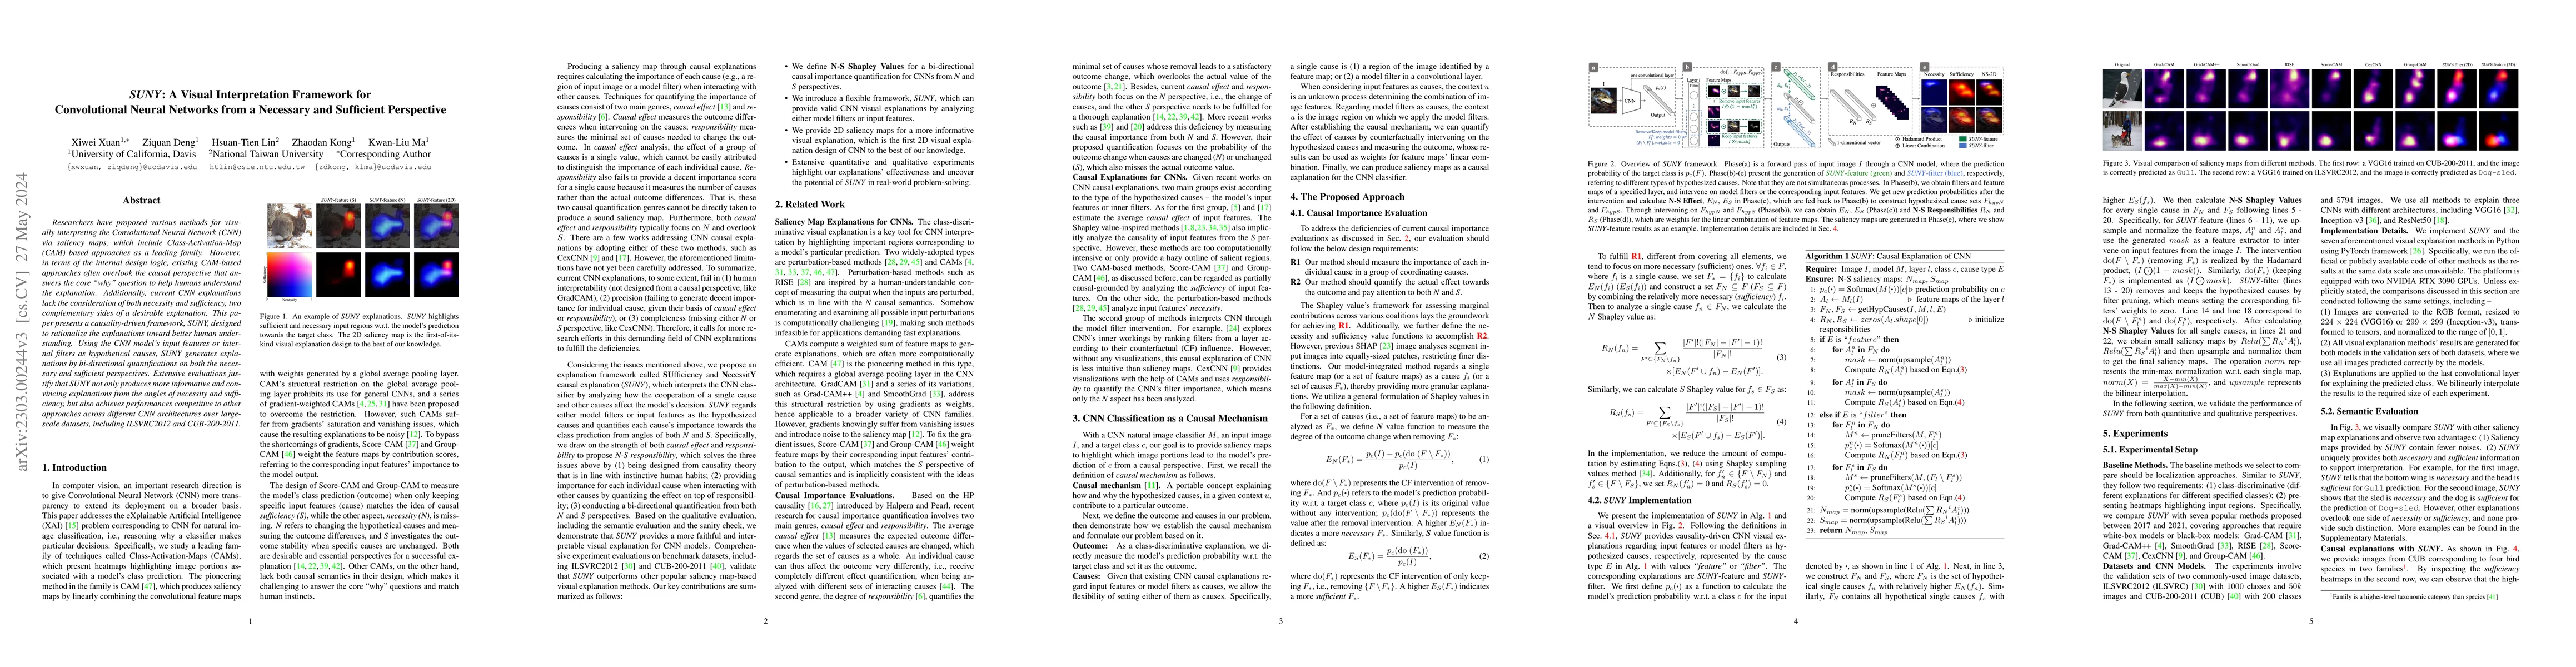
Researchers have proposed various methods for visually interpreting the Convolutional Neural Network (CNN) via saliency maps, which include Class-Activation-Map (CAM) based approaches as a leading f...
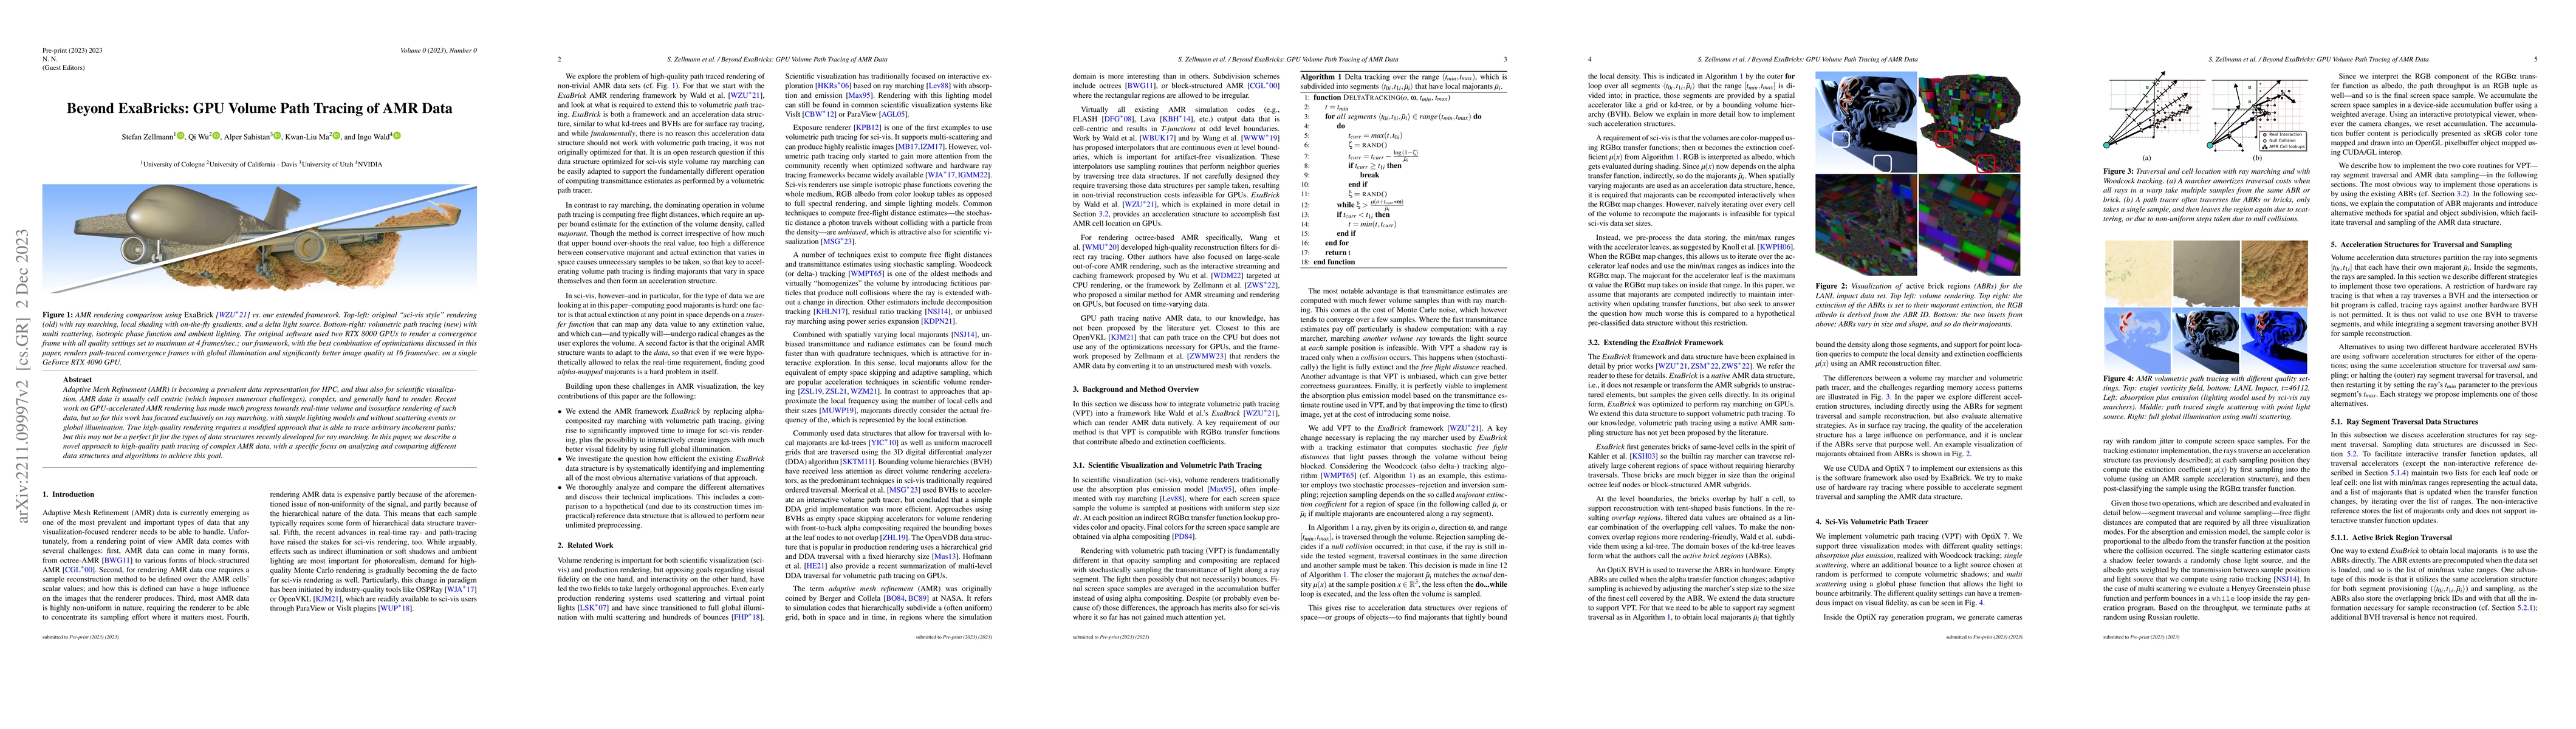
Adaptive Mesh Refinement (AMR) is becoming a prevalent data representation for scientific visualization. Resulting from large fluid mechanics simulations, the data is usually cell centric, imposing ...
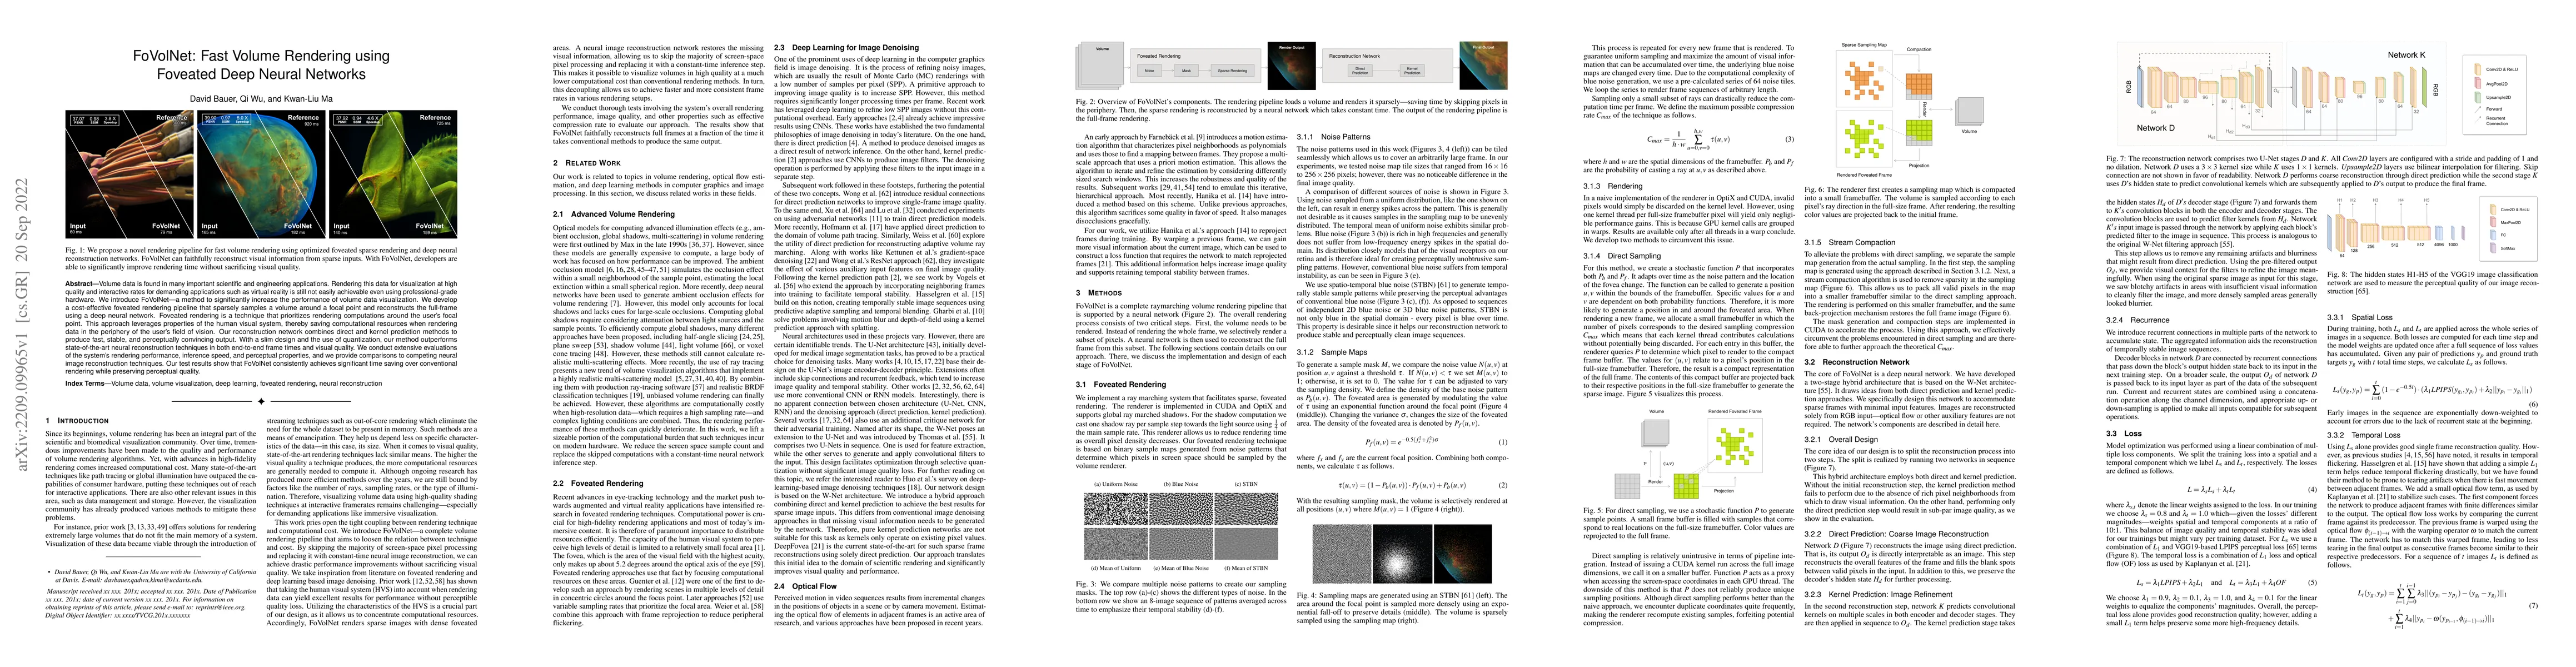
Volume data is found in many important scientific and engineering applications. Rendering this data for visualization at high quality and interactive rates for demanding applications such as virtual...
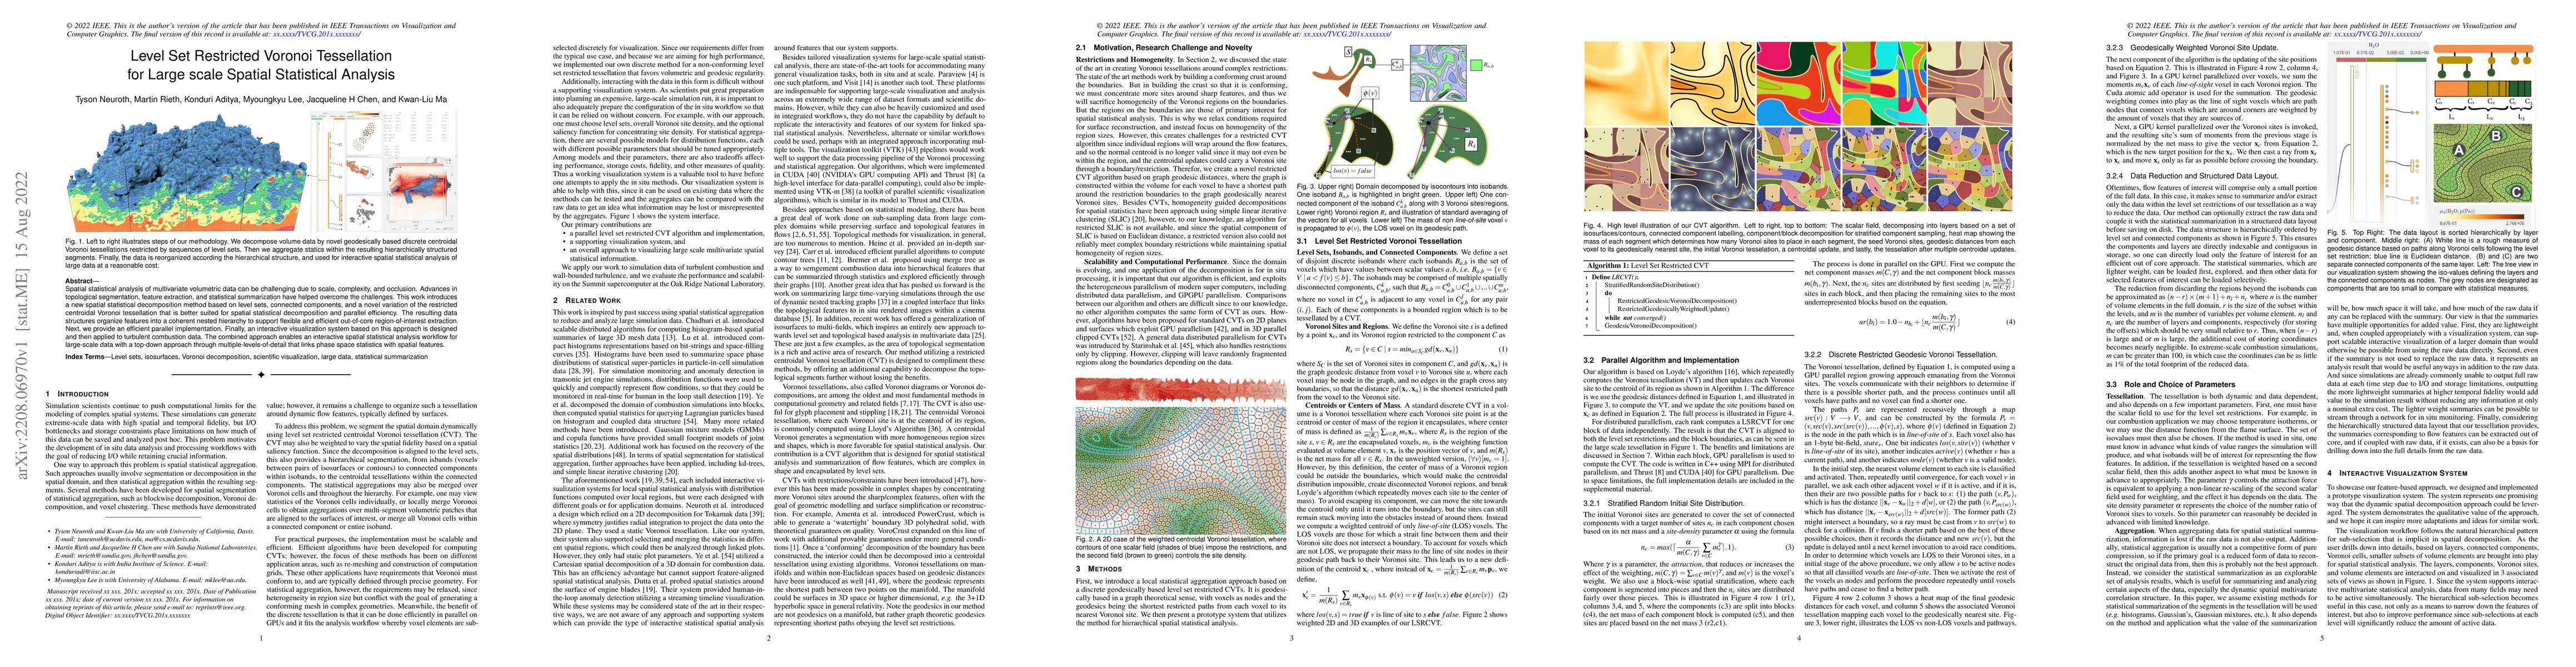
Spatial statistical analysis of multivariate volumetric data can be challenging due to scale, complexity, and occlusion. Advances in topological segmentation, feature extraction, and statistical sum...
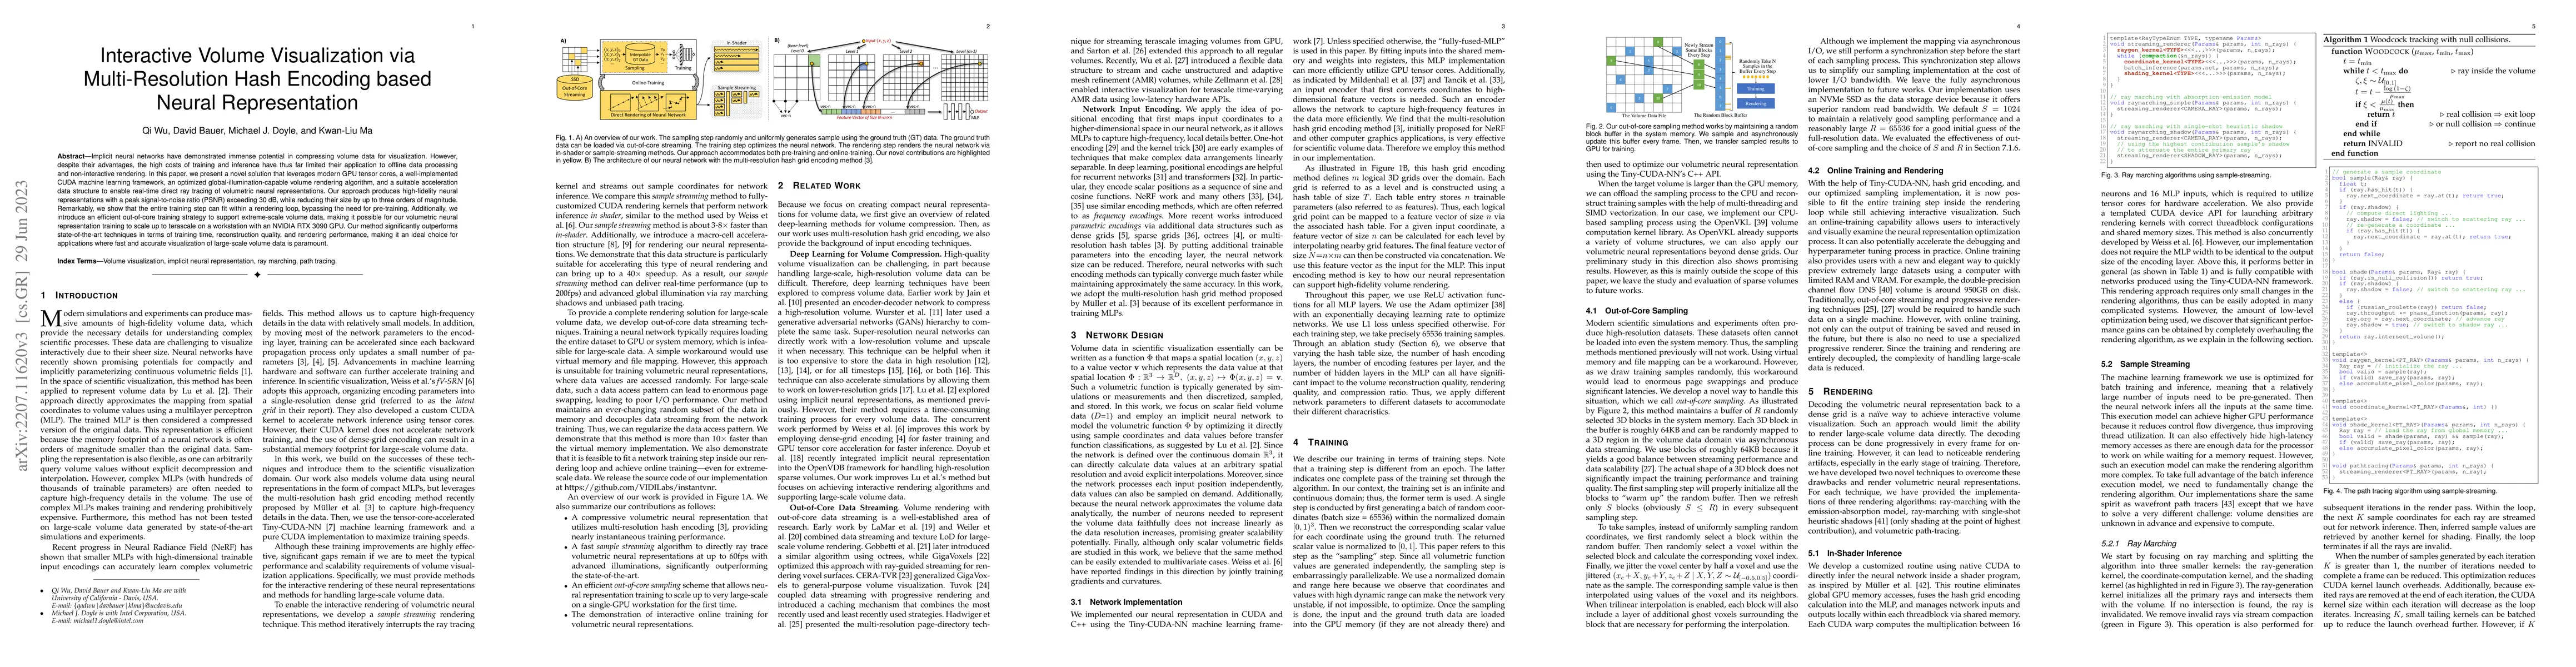
Neural networks have shown great potential in compressing volume data for visualization. However, due to the high cost of training and inference, such volumetric neural representations have thus far...
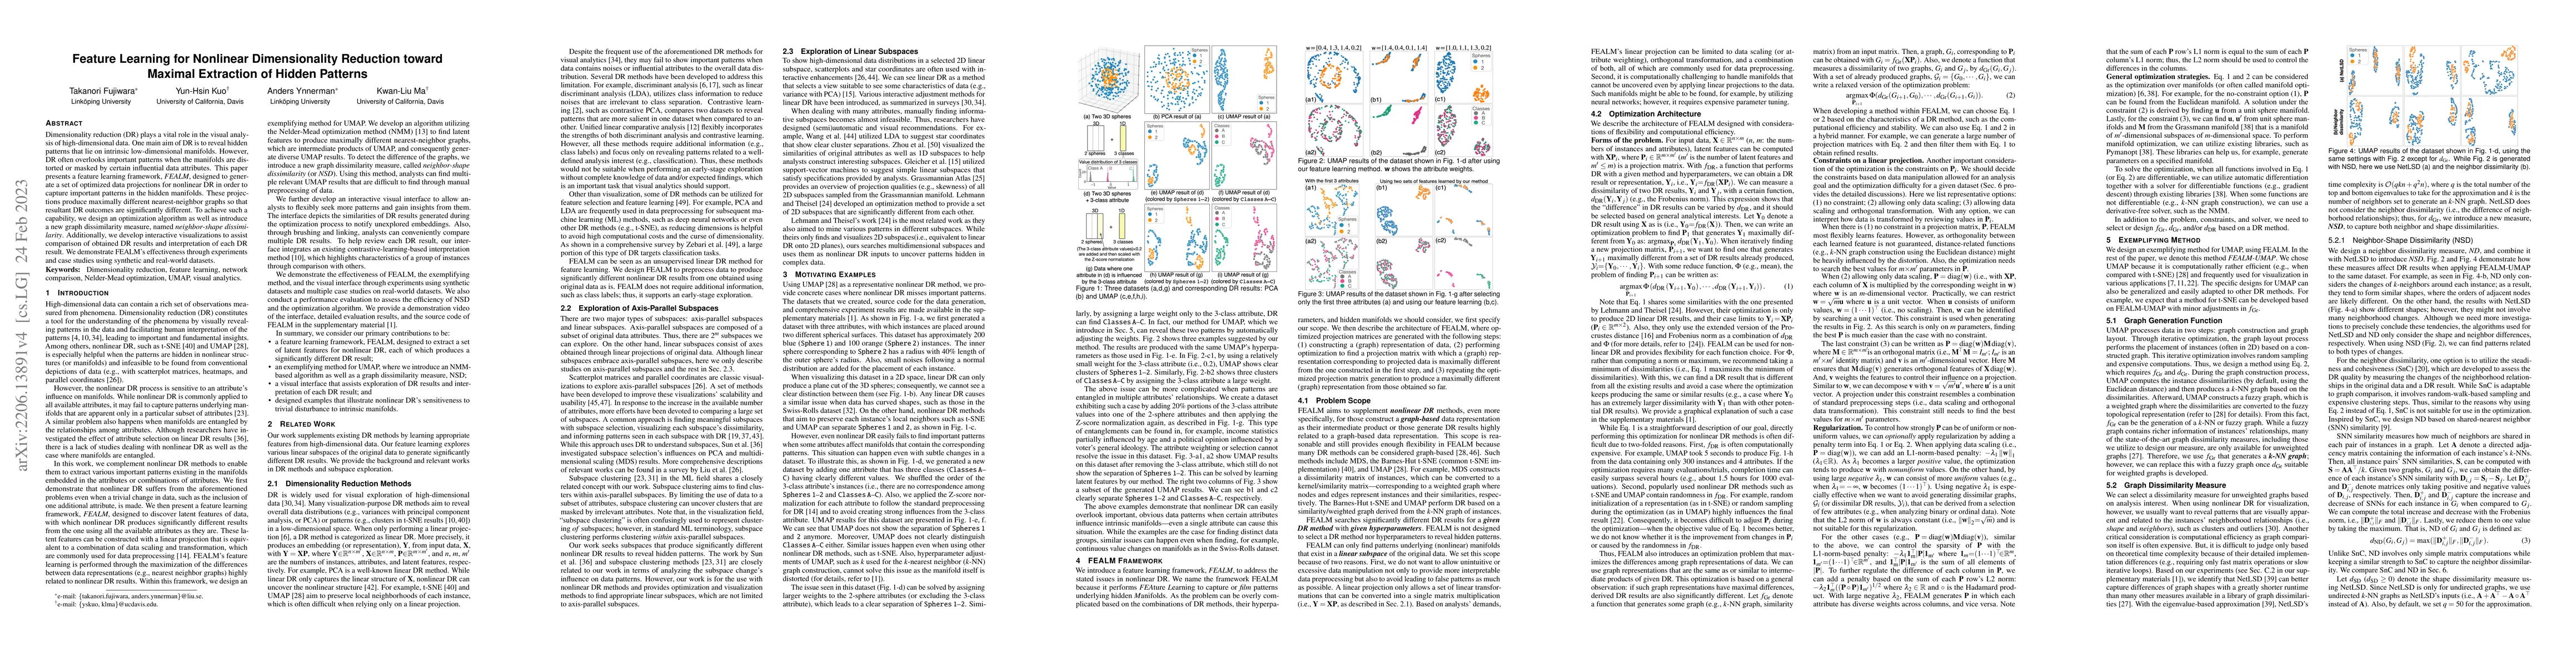
Dimensionality reduction (DR) plays a vital role in the visual analysis of high-dimensional data. One main aim of DR is to reveal hidden patterns that lie on intrinsic low-dimensional manifolds. How...
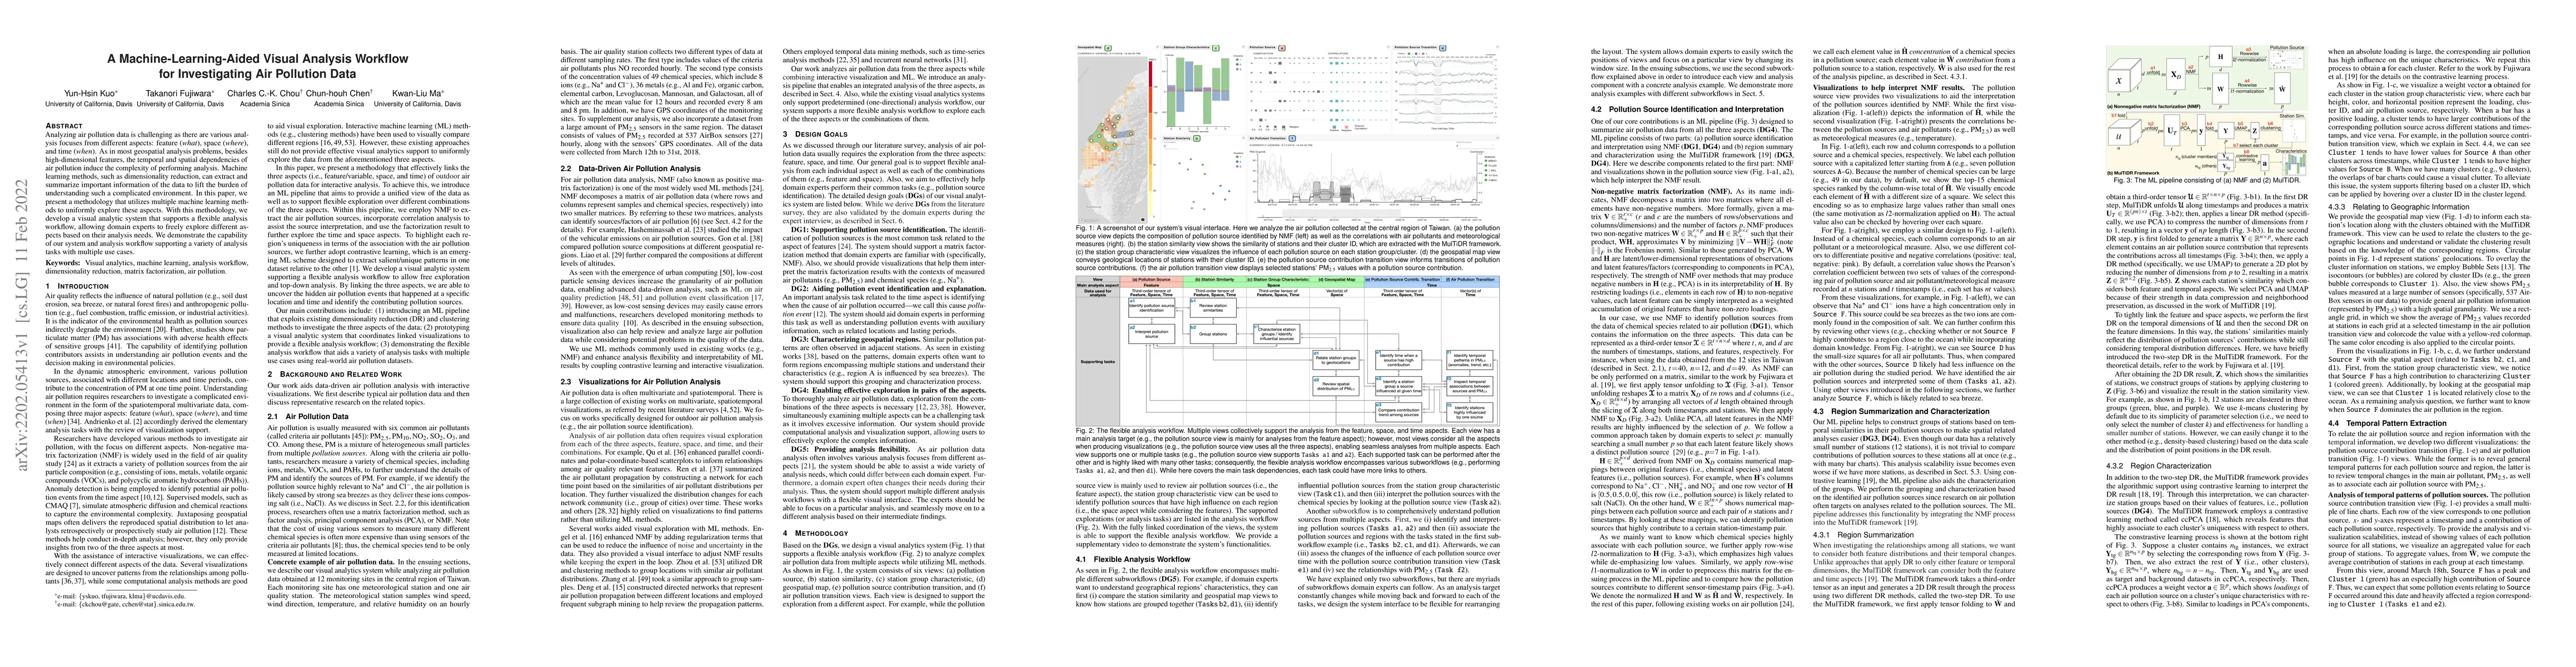
Analyzing air pollution data is challenging as there are various analysis focuses from different aspects: feature (what), space (where), and time (when). As in most geospatial analysis problems, bes...
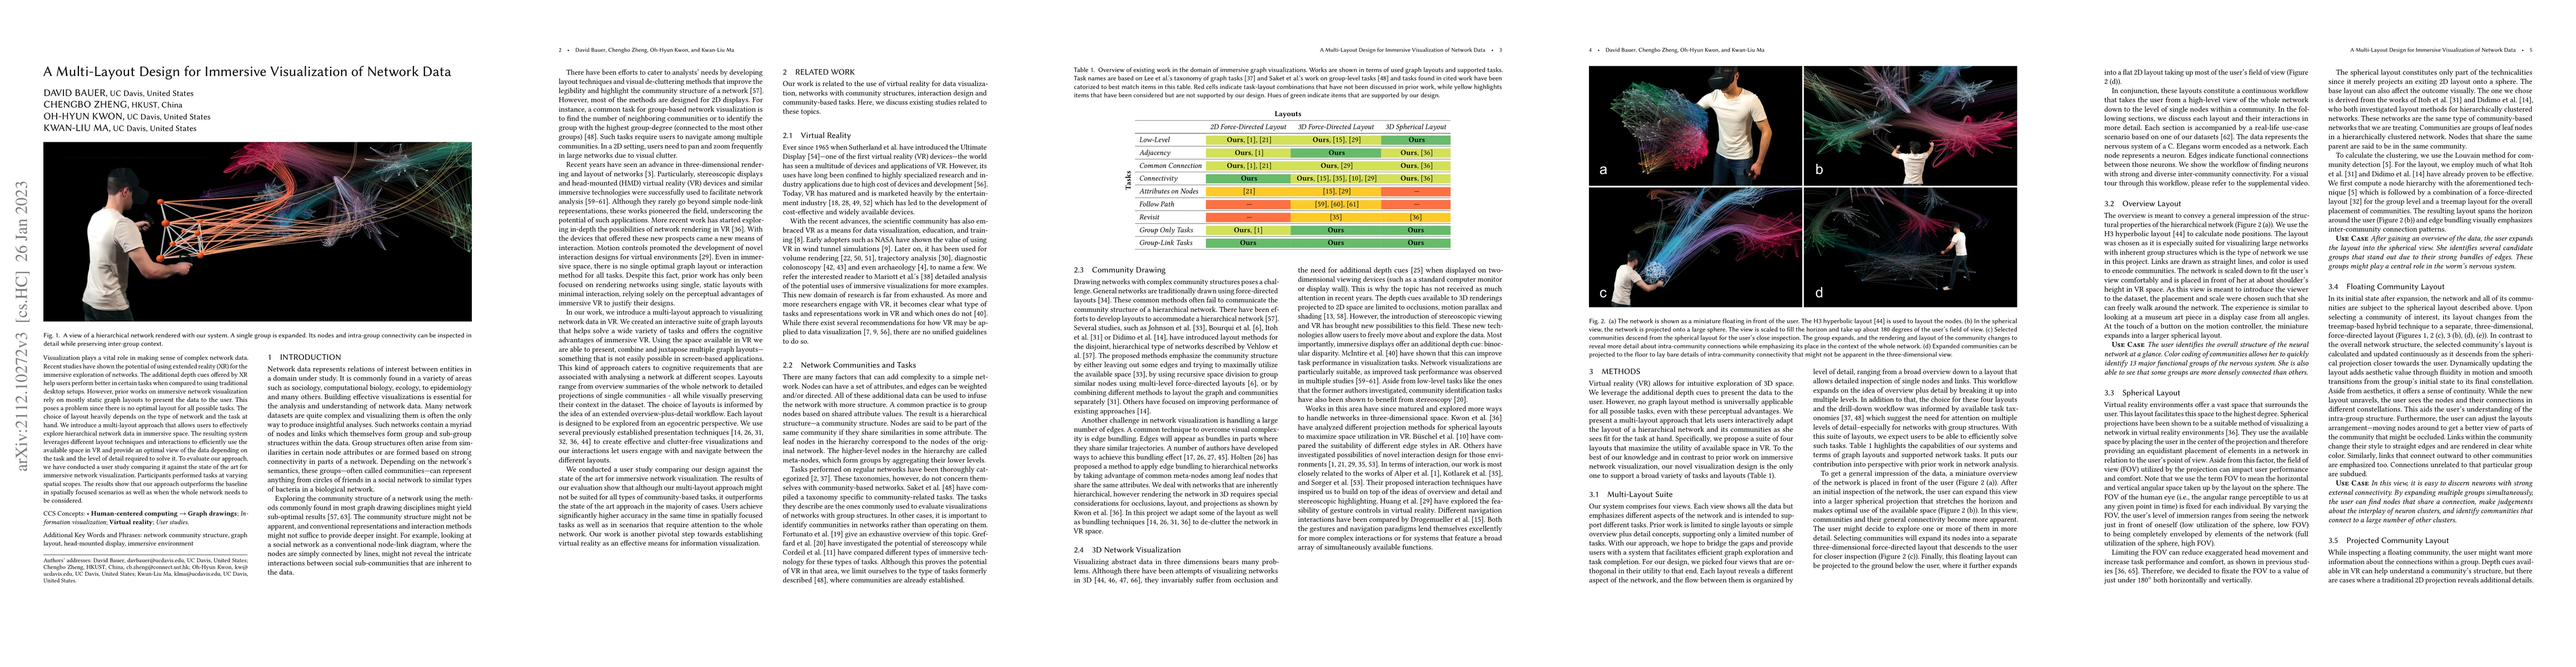
Visualization plays a vital role in making sense of complex network data. Recent studies have shown the potential of using extended reality (XR) for the immersive exploration of networks. The additi...
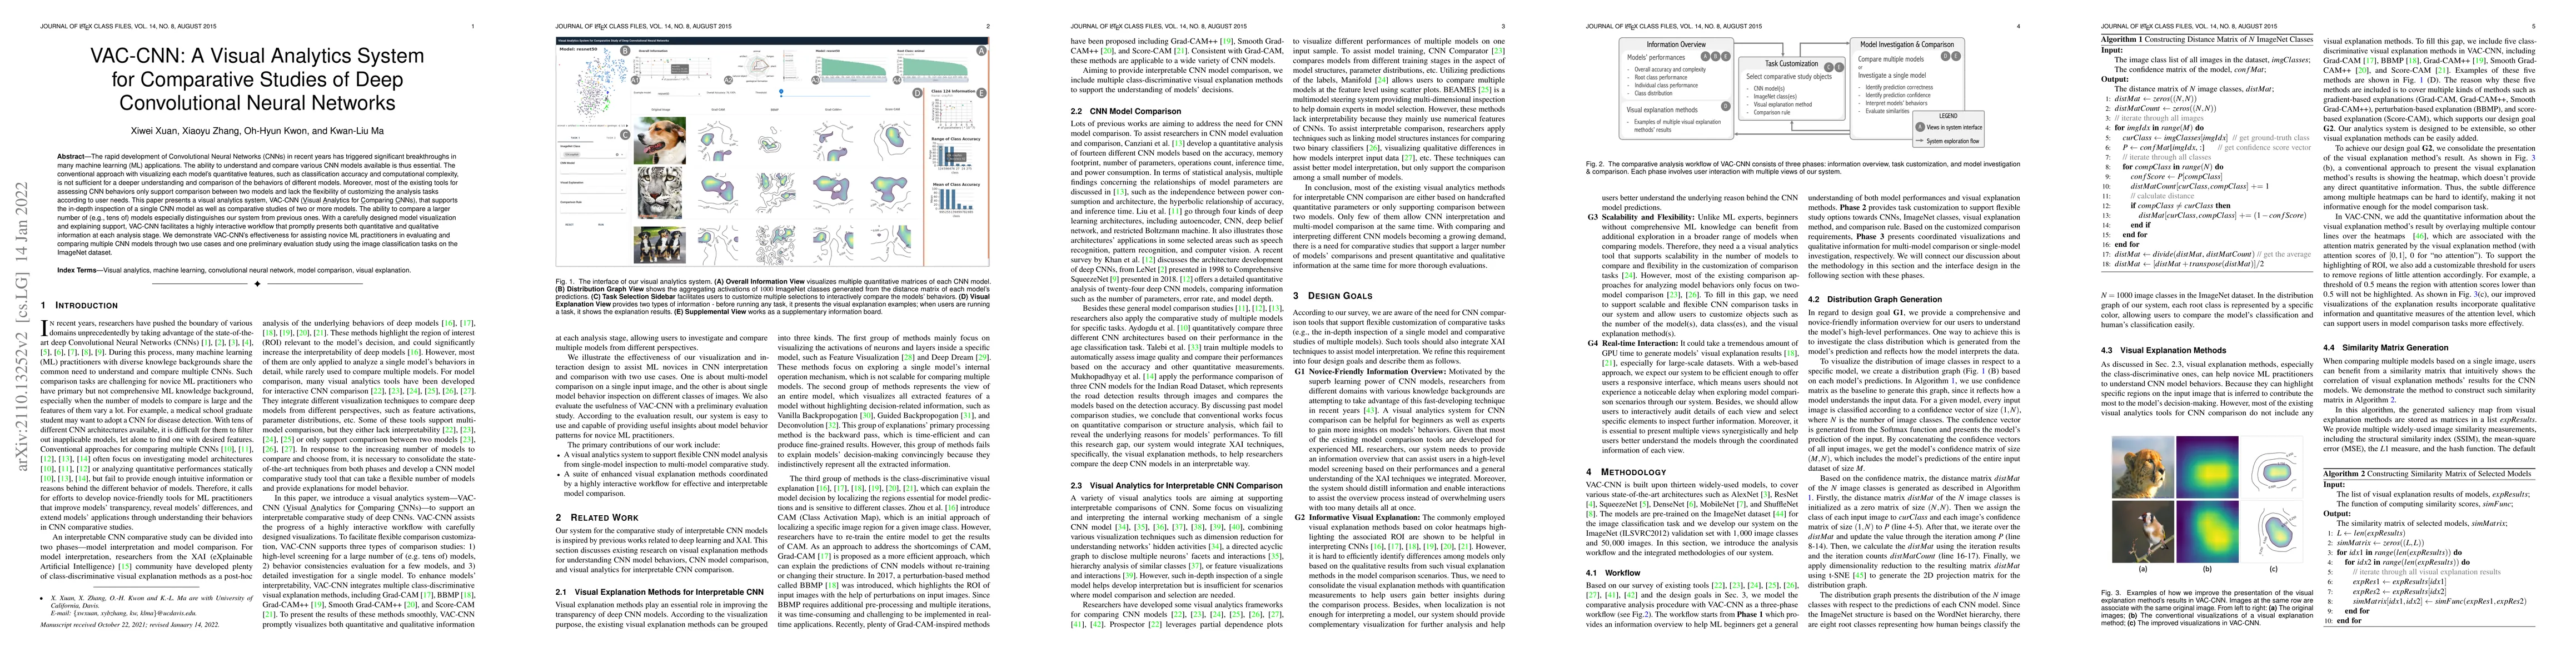
The rapid development of Convolutional Neural Networks (CNNs) in recent years has triggered significant breakthroughs in many machine learning (ML) applications. The ability to understand and compar...
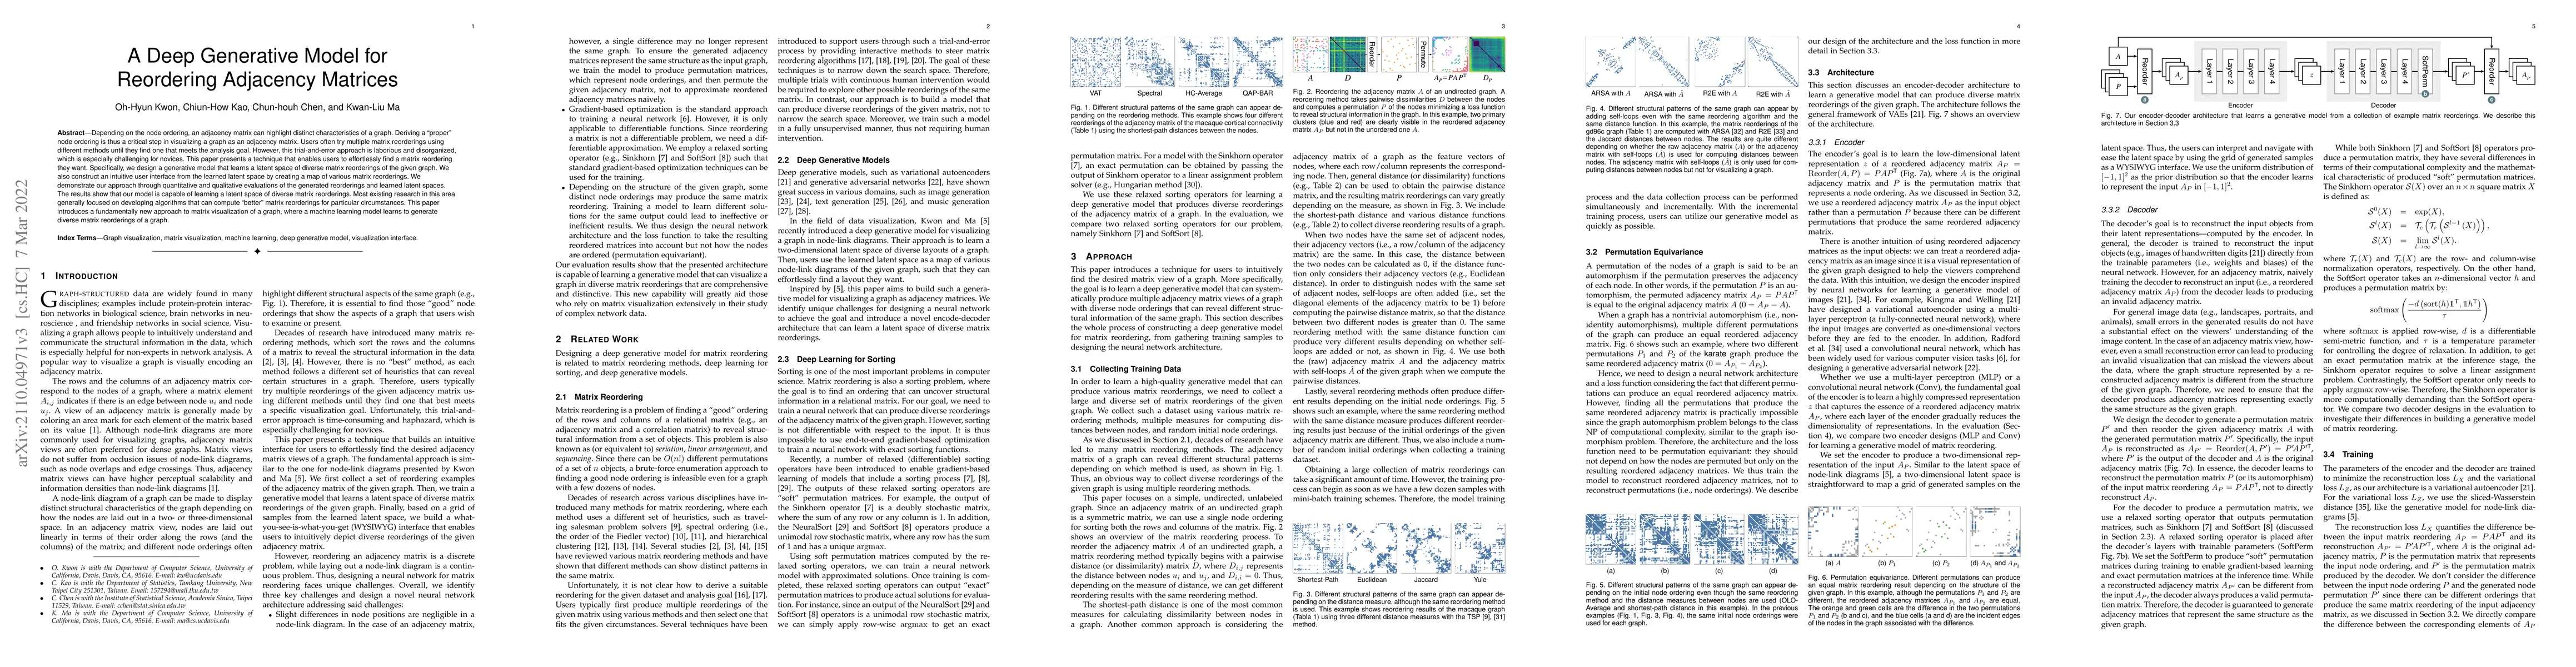
Depending on the node ordering, an adjacency matrix can highlight distinct characteristics of a graph. Deriving a "proper" node ordering is thus a critical step in visualizing a graph as an adjacenc...
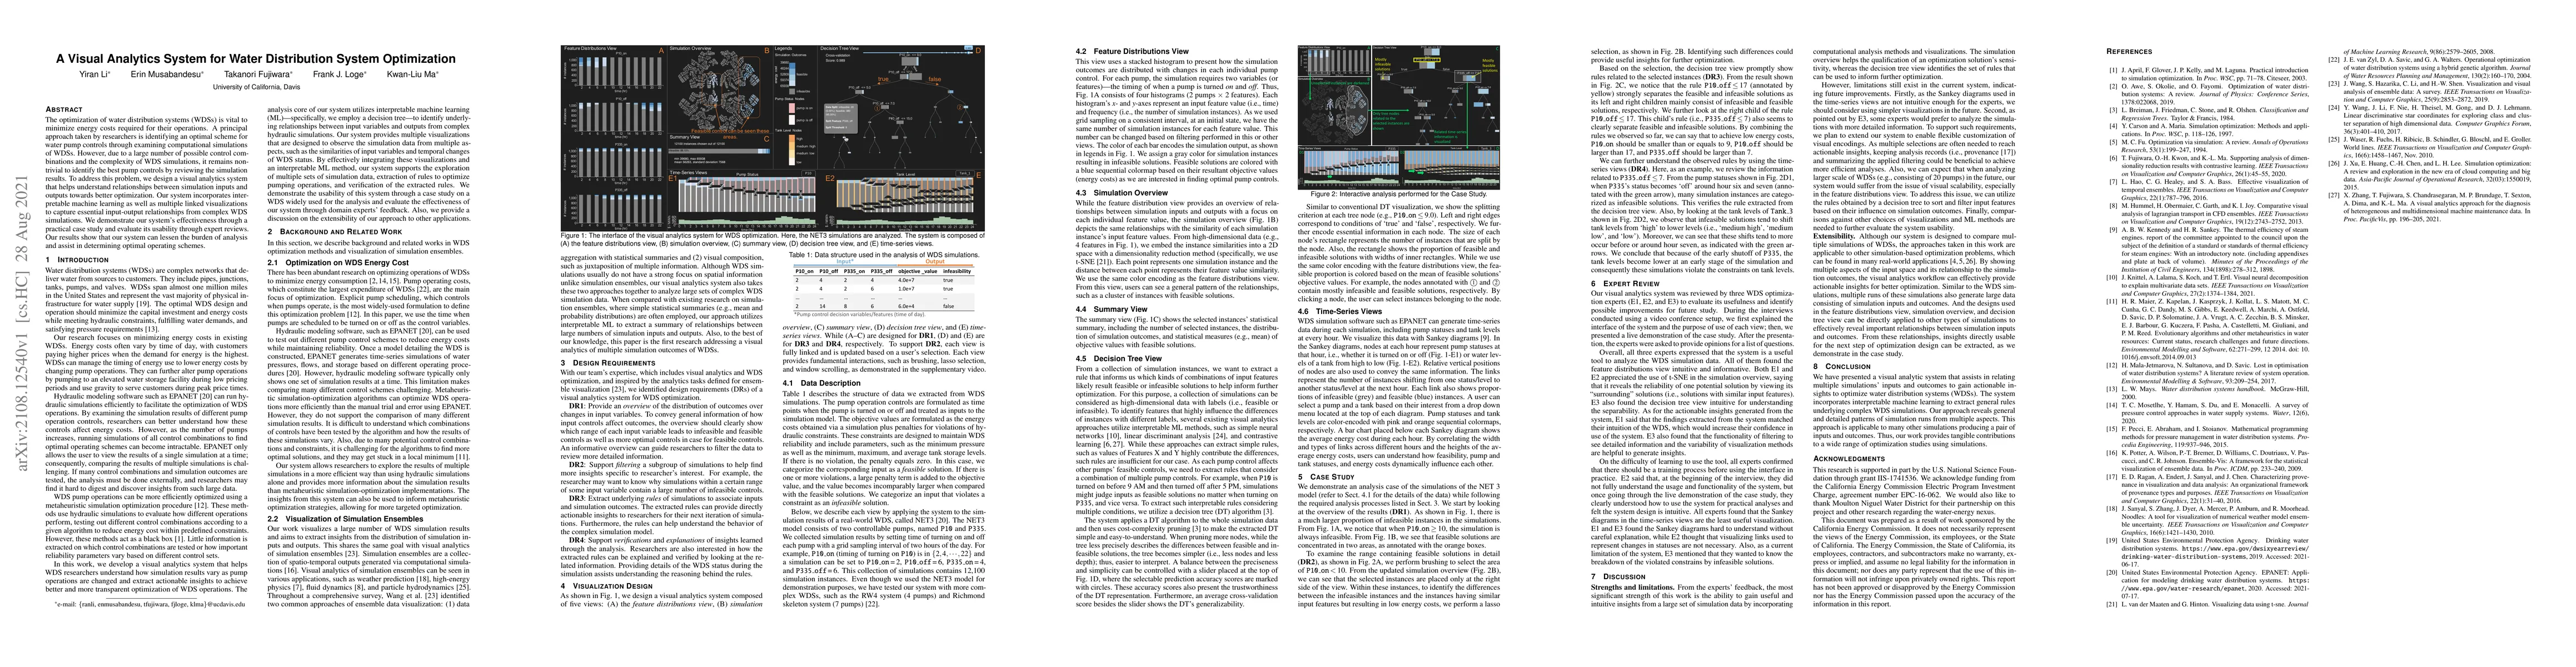
The optimization of water distribution systems (WDSs) is vital to minimize energy costs required for their operations. A principal approach taken by researchers is identifying an optimal scheme for ...
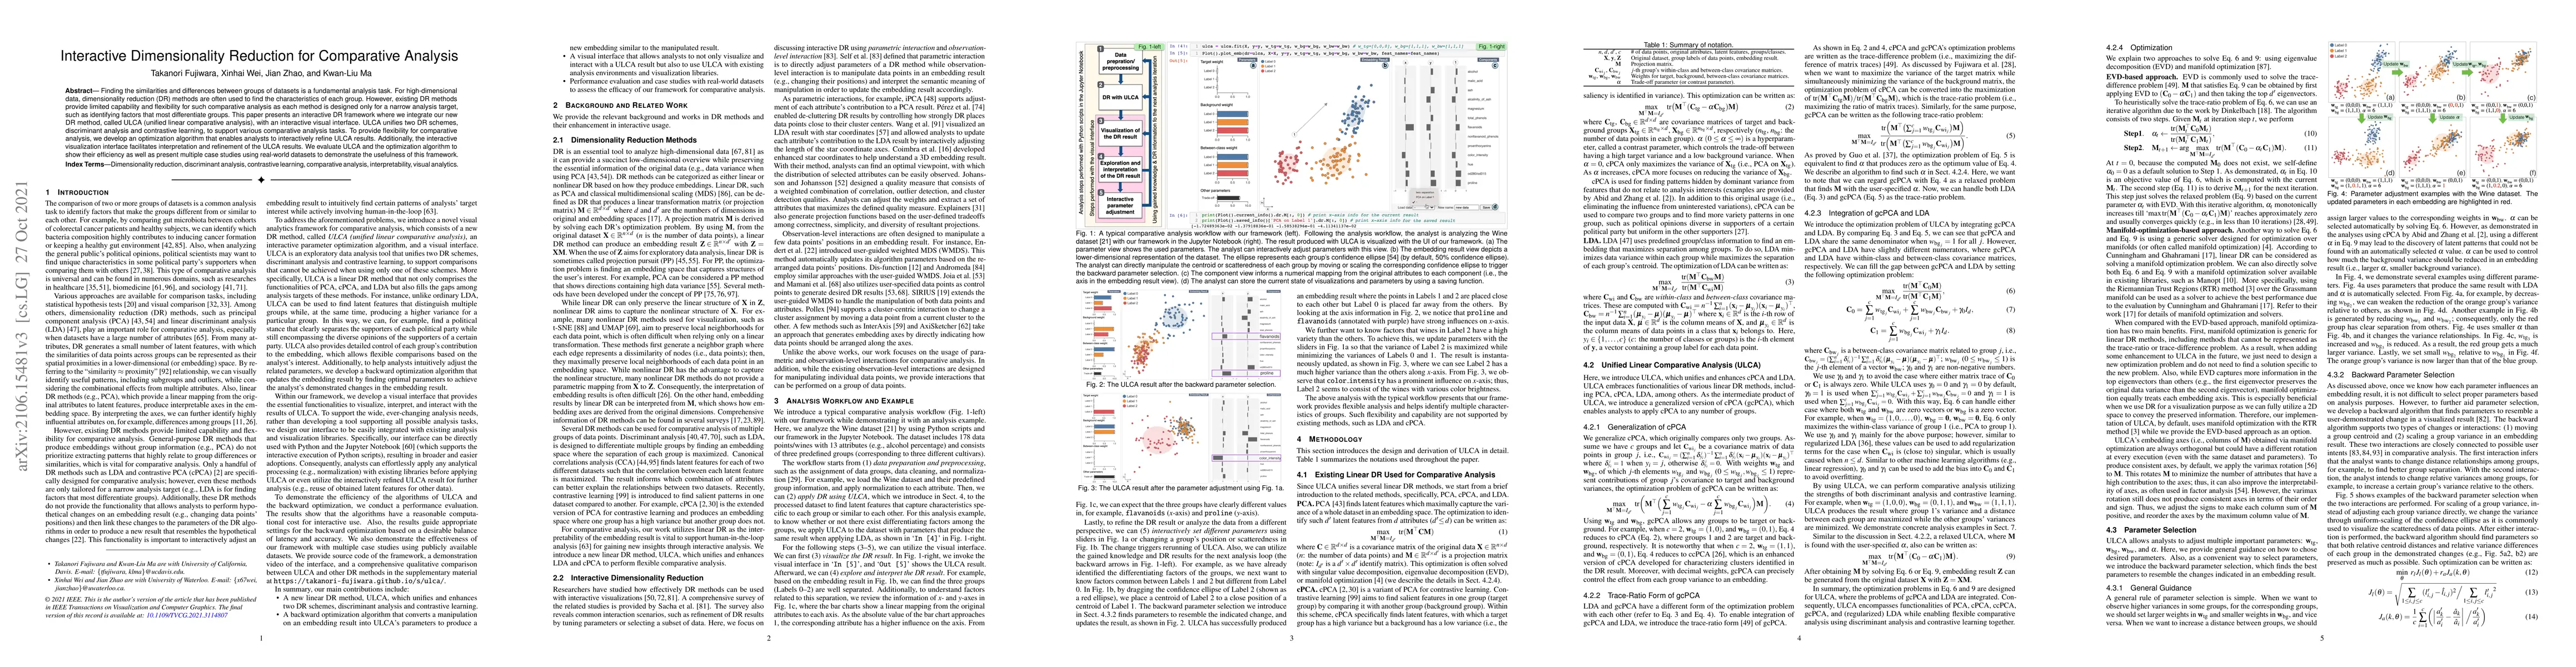
Finding the similarities and differences between groups of datasets is a fundamental analysis task. For high-dimensional data, dimensionality reduction (DR) methods are often used to find the charac...
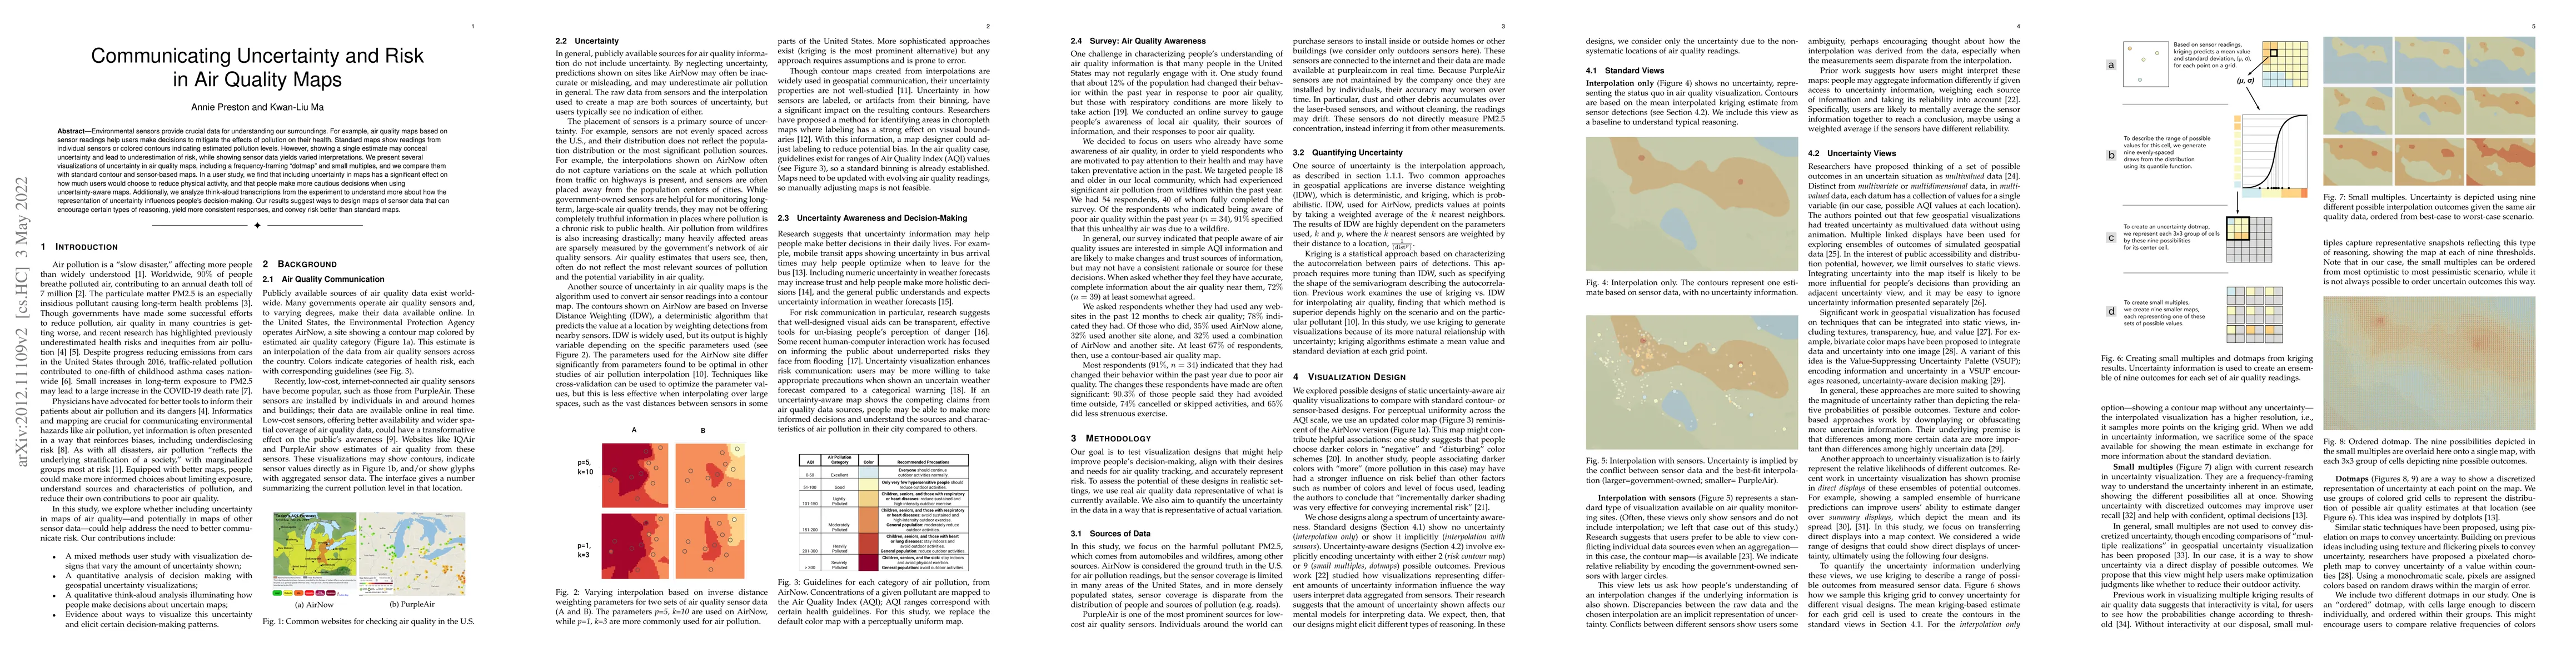
Environmental sensors provide crucial data for understanding our surroundings. For example, air quality maps based on sensor readings help users make decisions to mitigate the effects of pollution o...
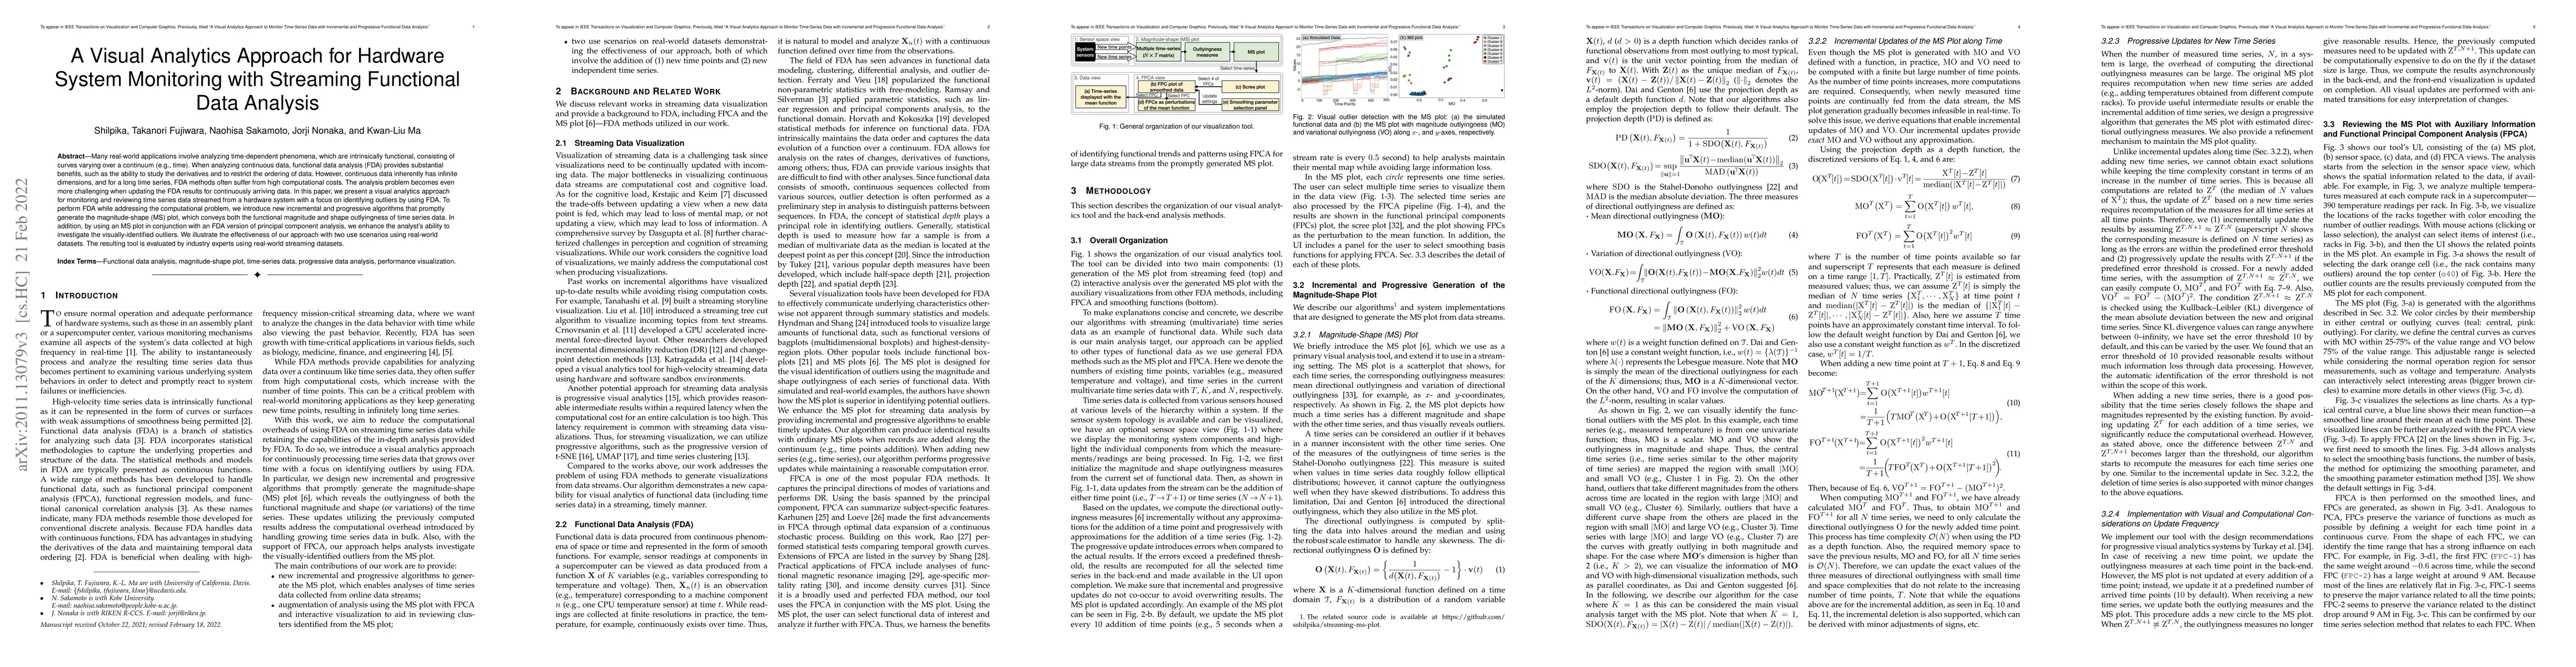
Many real-world applications involve analyzing time-dependent phenomena, which are intrinsically functional, consisting of curves varying over a continuum (e.g., time). When analyzing continuous dat...
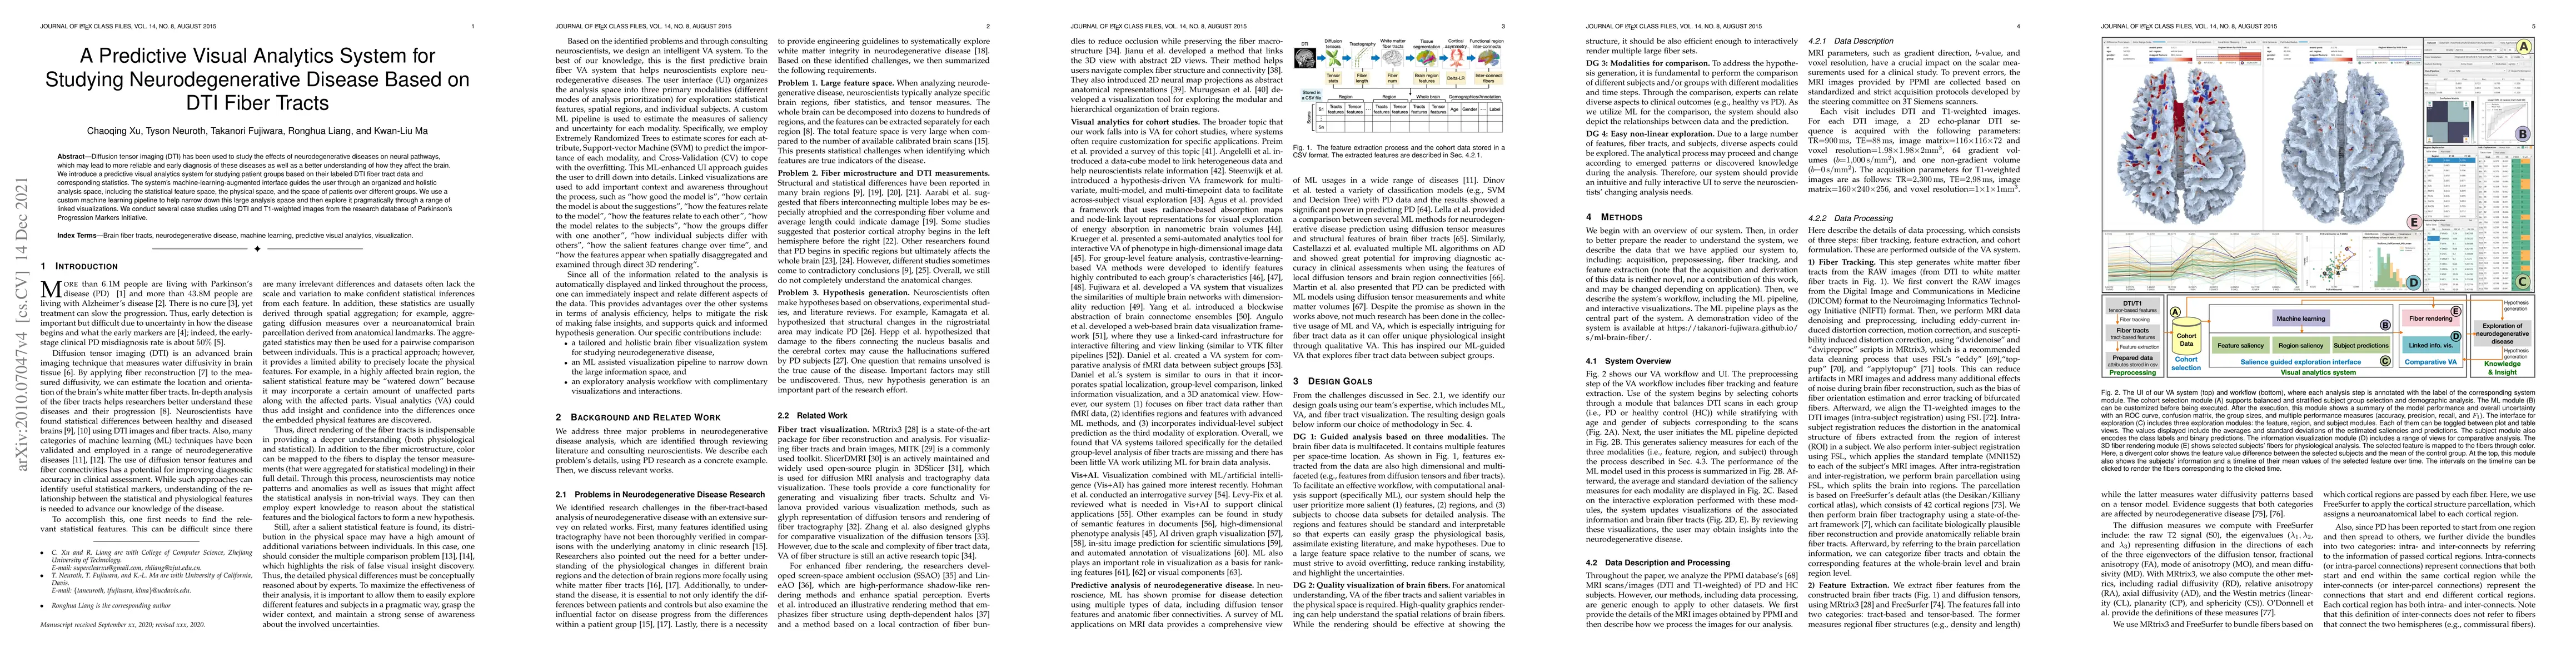
Diffusion tensor imaging (DTI) has been used to study the effects of neurodegenerative diseases on neural pathways, which may lead to more reliable and early diagnosis of these diseases as well as a...
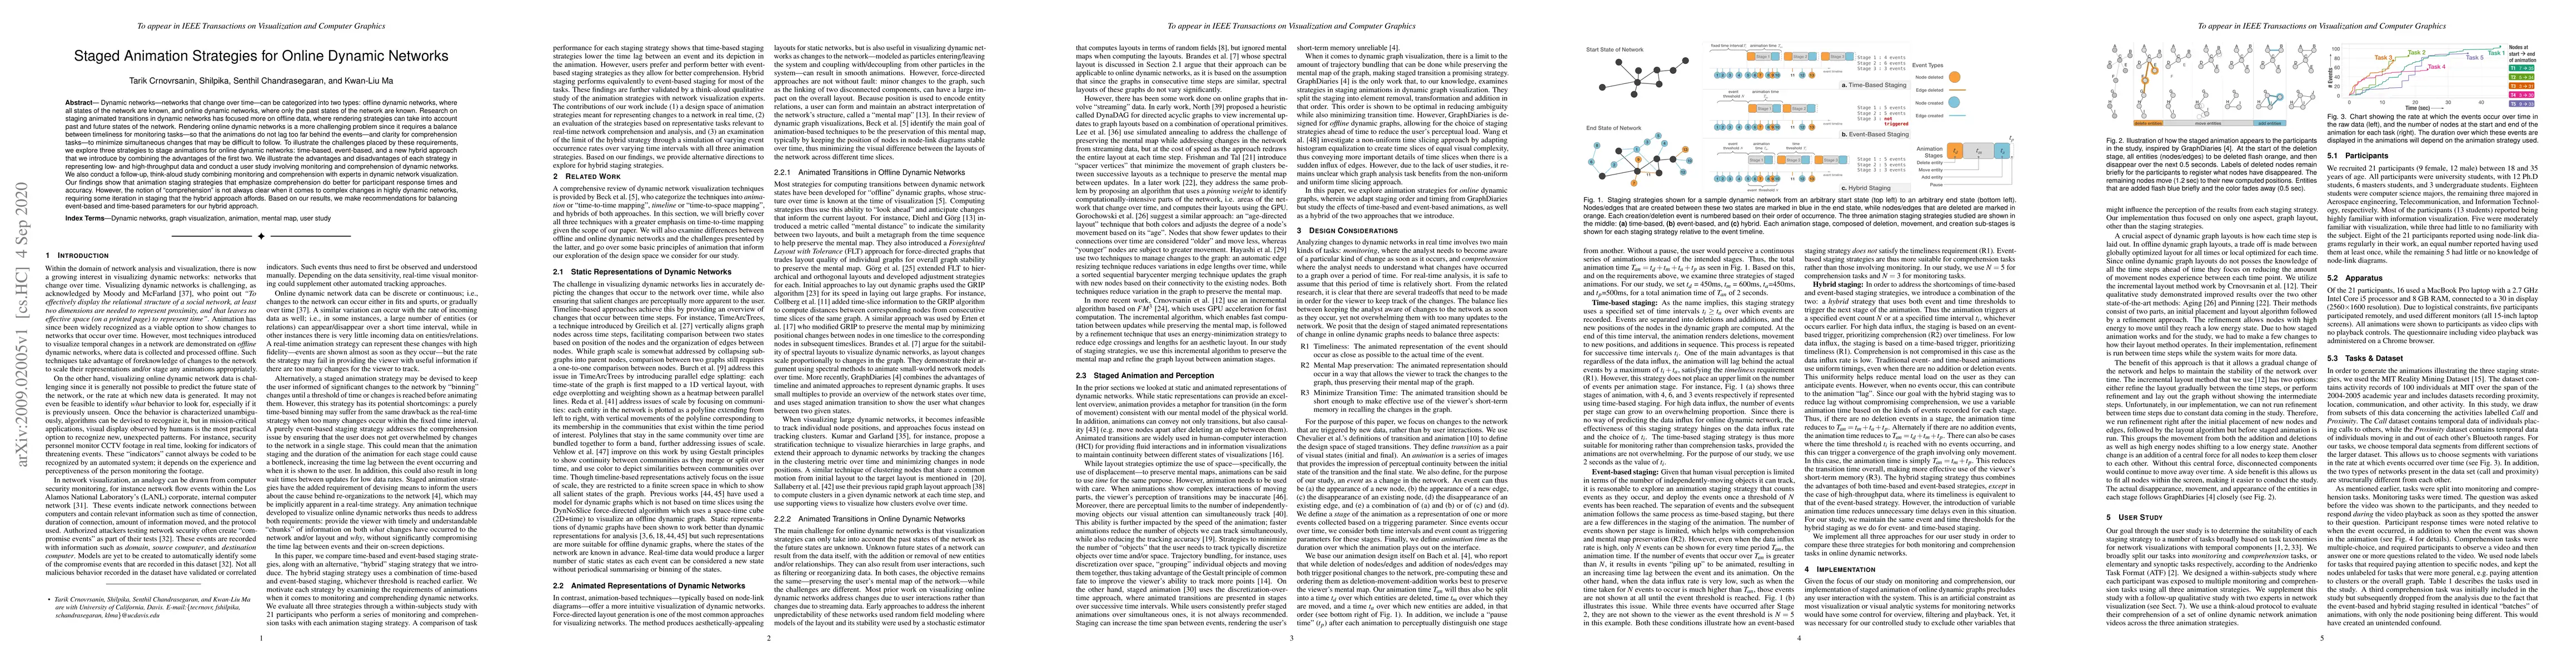
Dynamic networks -- networks that change over time -- can be categorized into two types: offline dynamic networks, where all states of the network are known, and online dynamic networks, where only ...
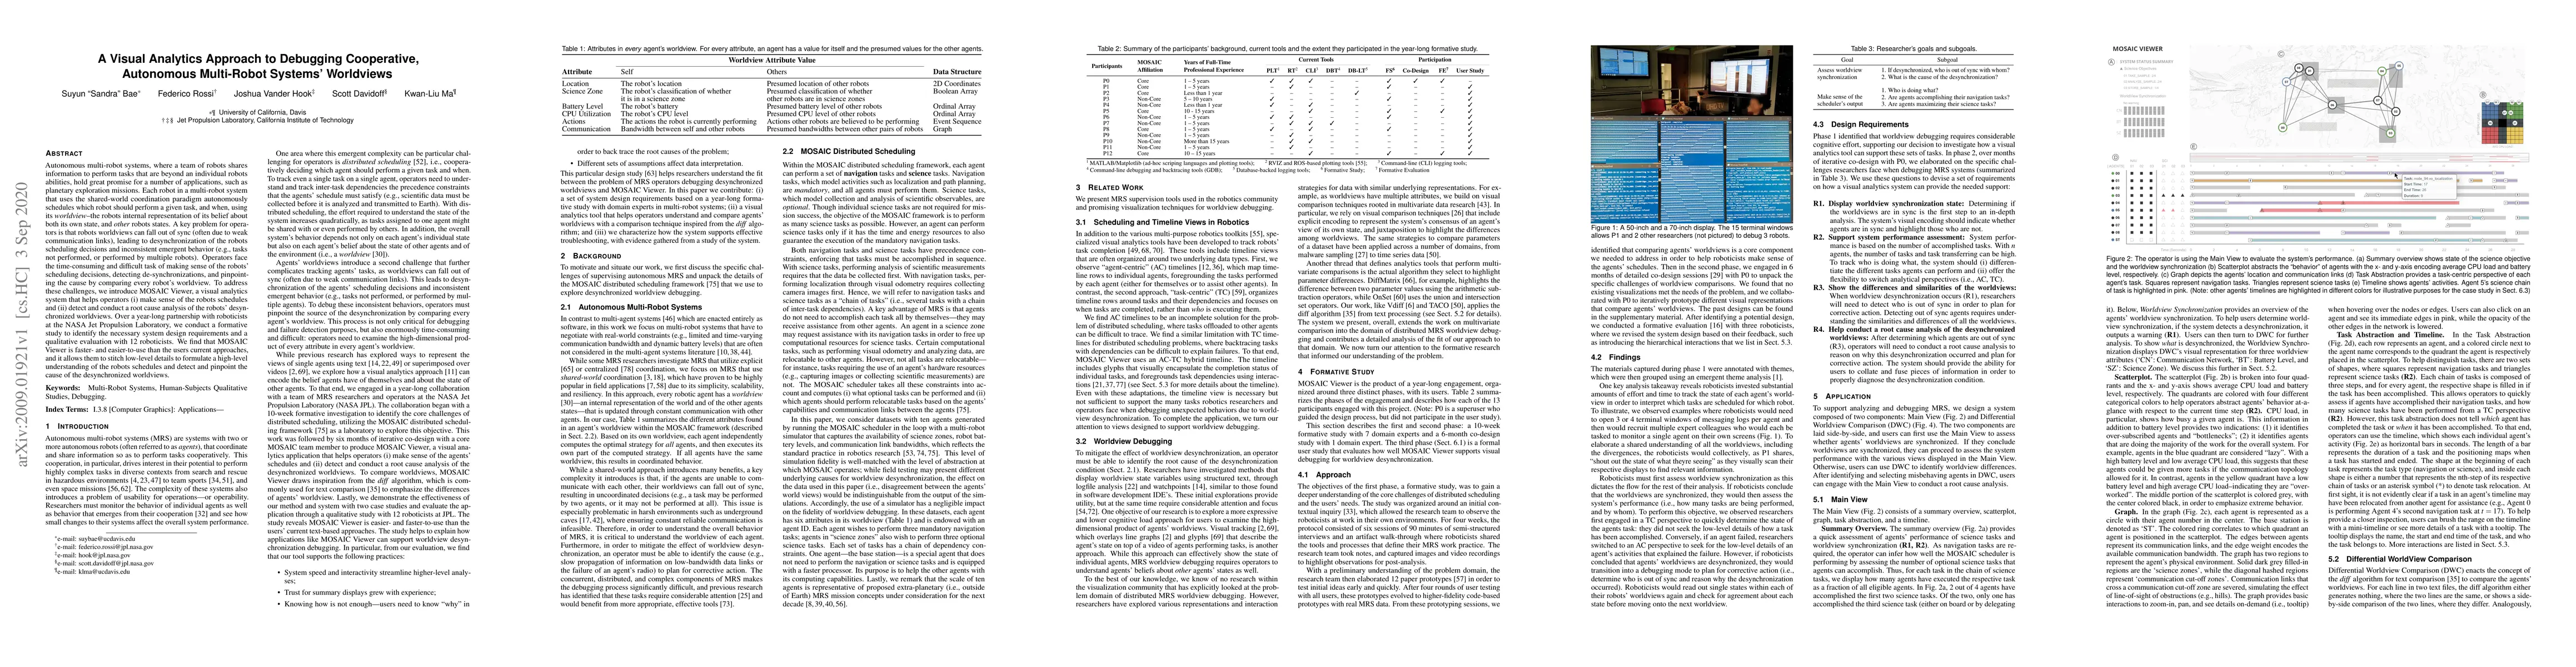
Autonomous multi-robot systems, where a team of robots shares information to perform tasks that are beyond an individual robot's abilities, hold great promise for a number of applications, such as p...

We present P6, a declarative language for building high performance visual analytics systems through its support for specifying and integrating machine learning and interactive visualization methods...
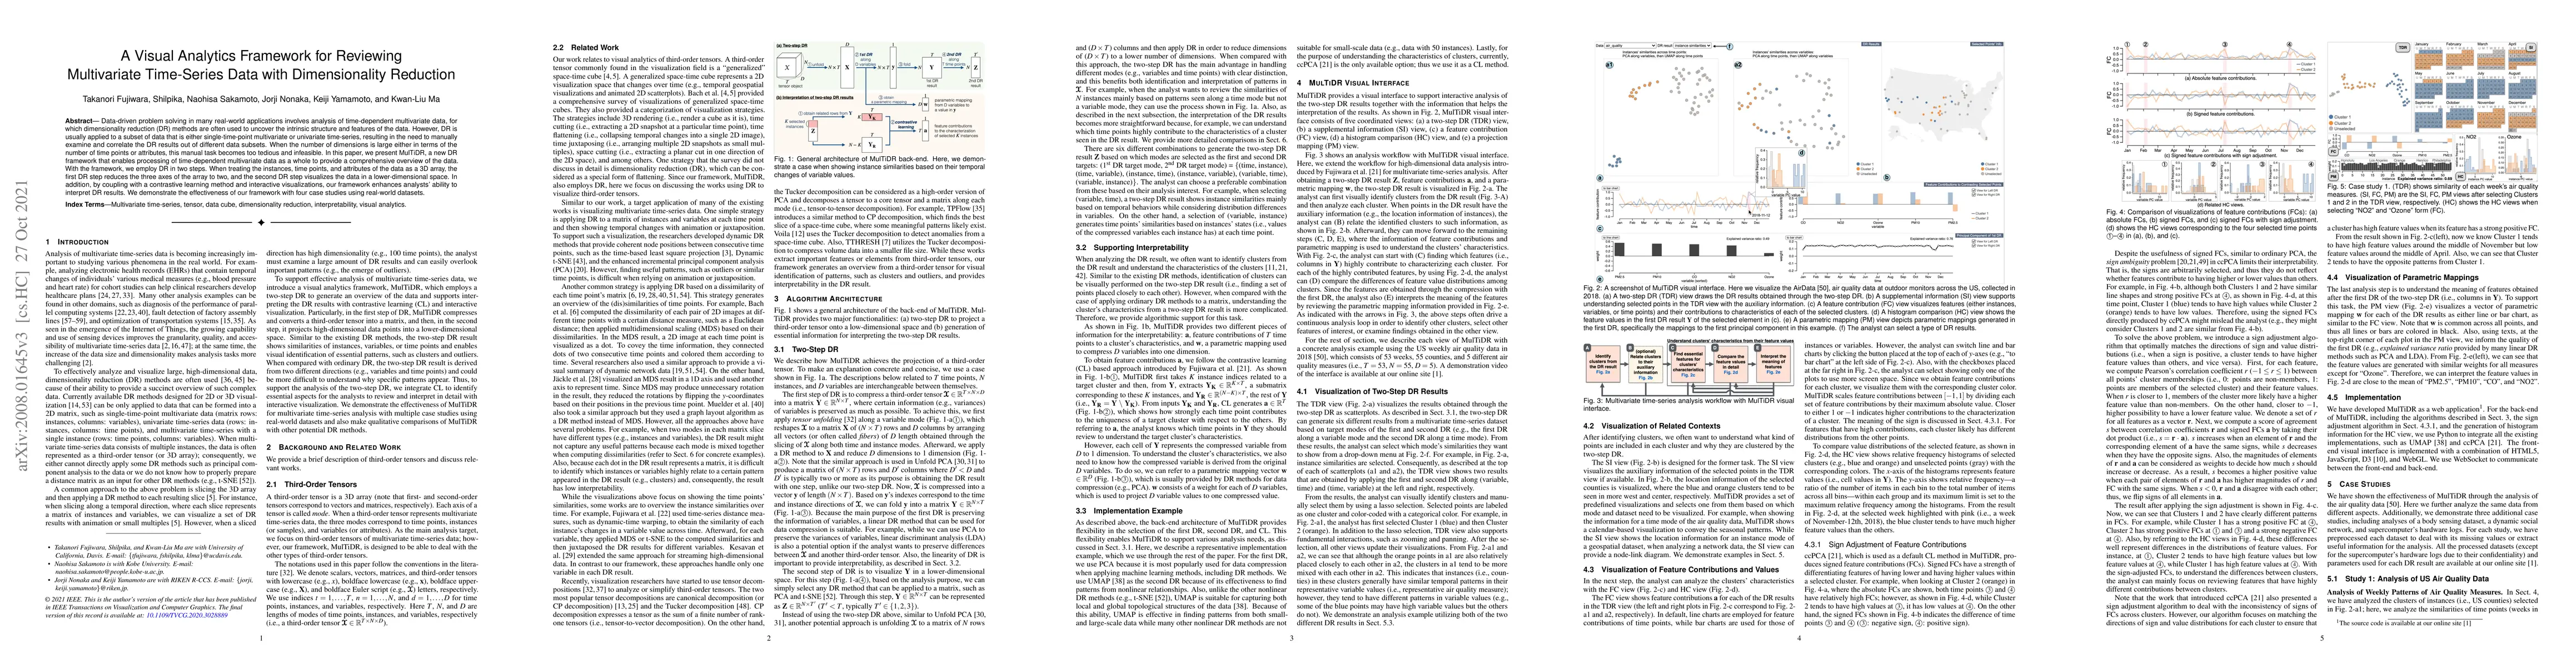
Data-driven problem solving in many real-world applications involves analysis of time-dependent multivariate data, for which dimensionality reduction (DR) methods are often used to uncover the intri...
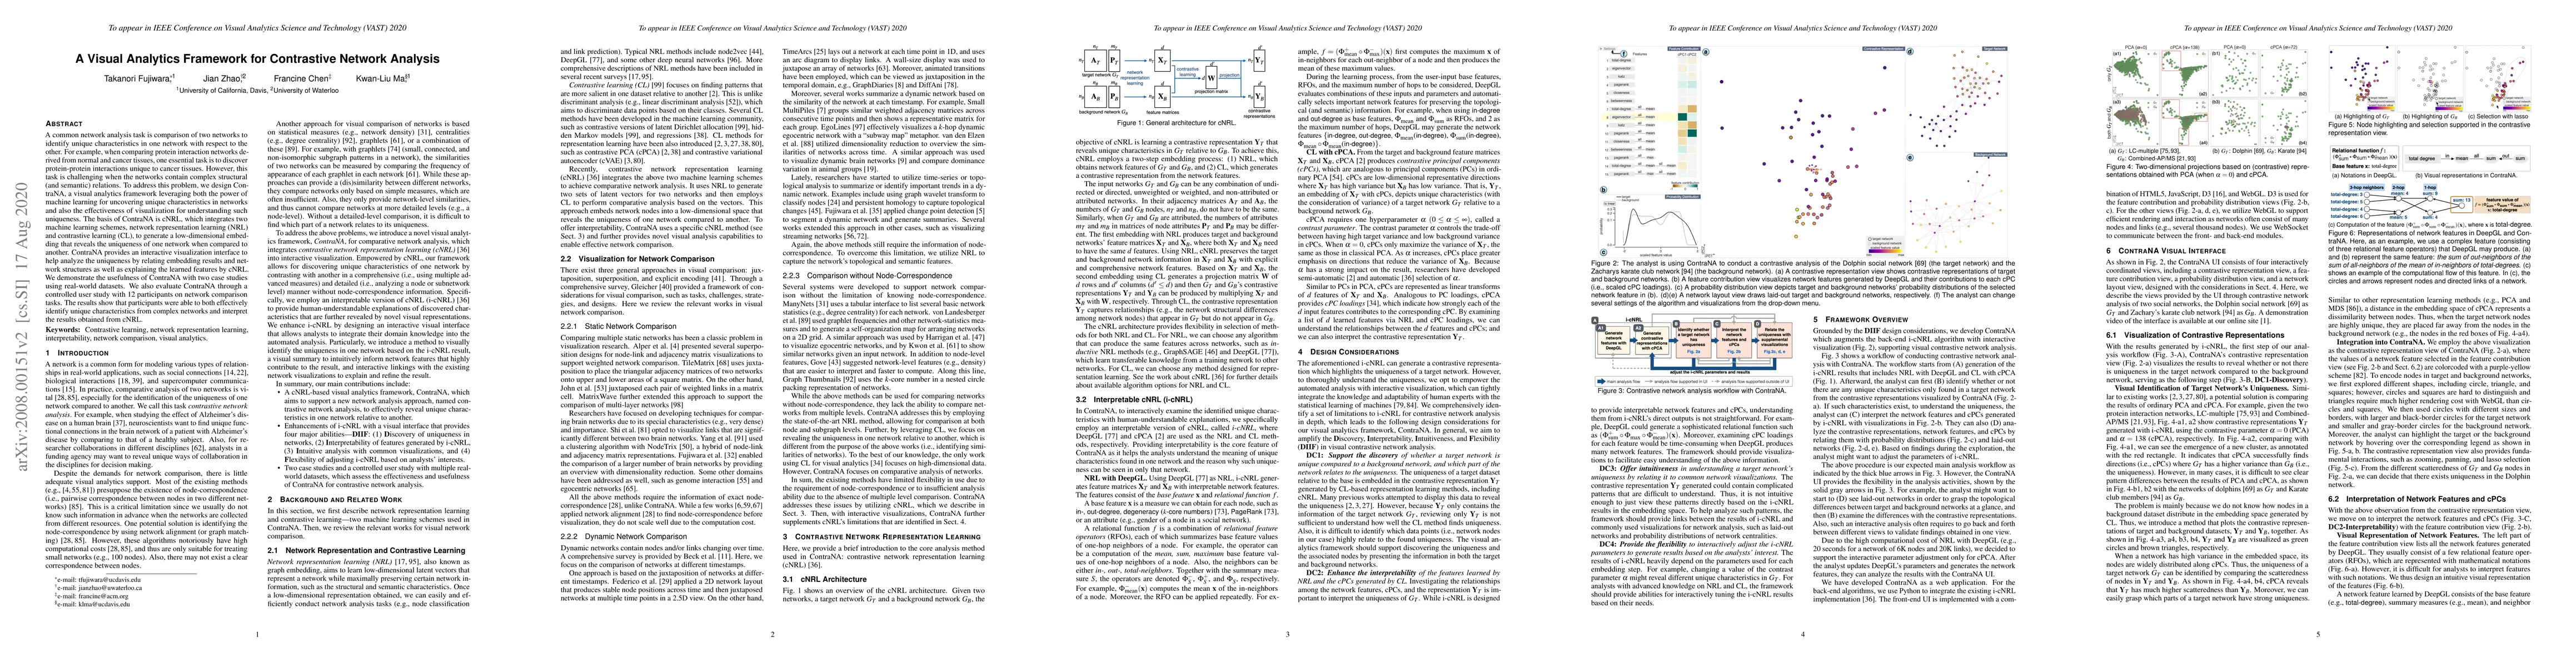
A common network analysis task is comparison of two networks to identify unique characteristics in one network with respect to the other. For example, when comparing protein interaction networks der...
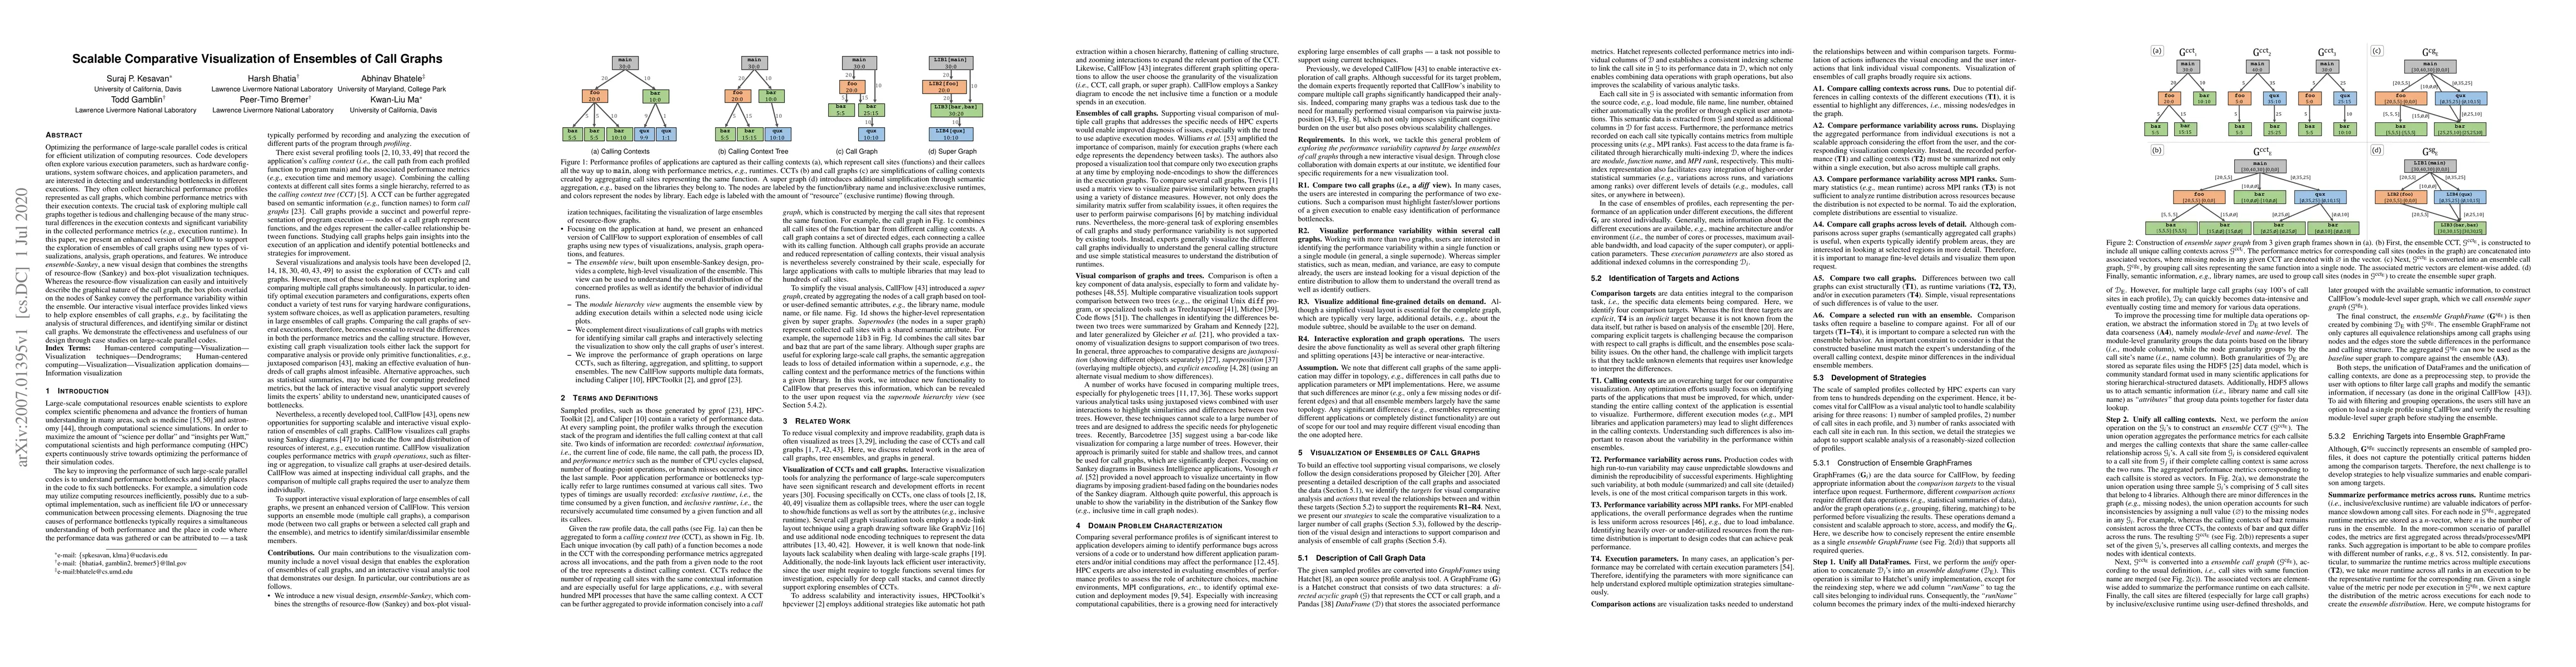
Optimizing the performance of large-scale parallel codes is critical for efficient utilization of computing resources. Code developers often explore various execution parameters, such as hardware co...
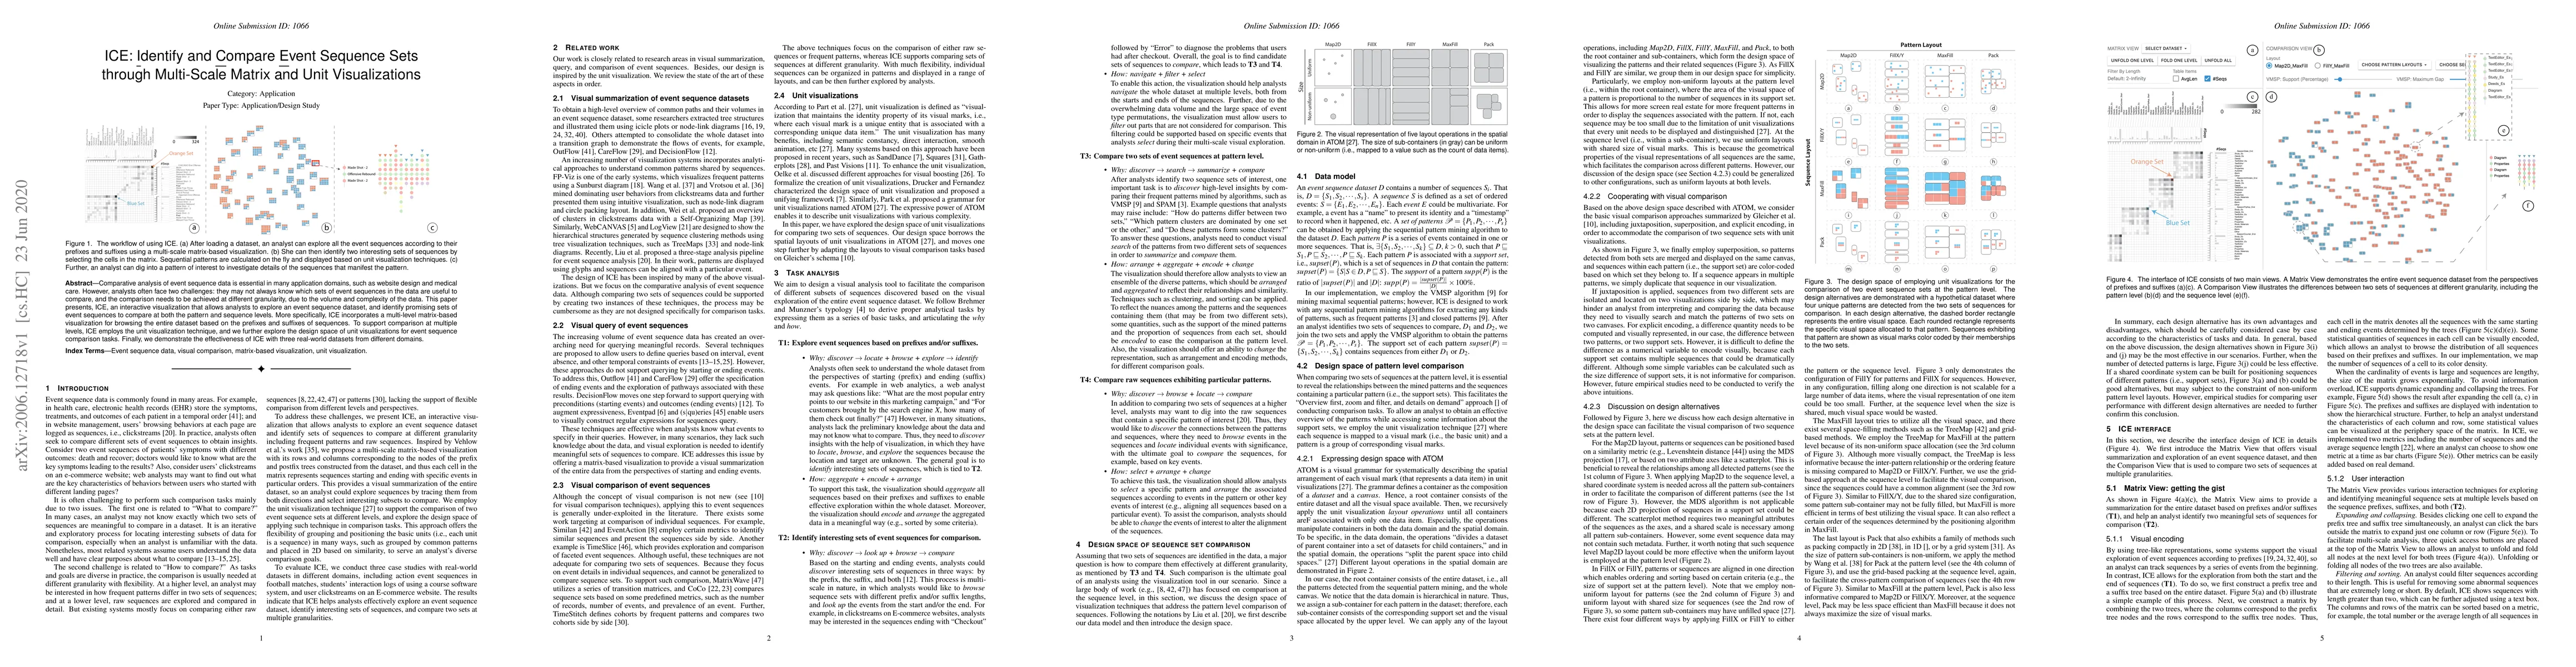
Comparative analysis of event sequence data is essential in many application domains, such as website design and medical care. However, analysts often face two challenges: they may not always know w...
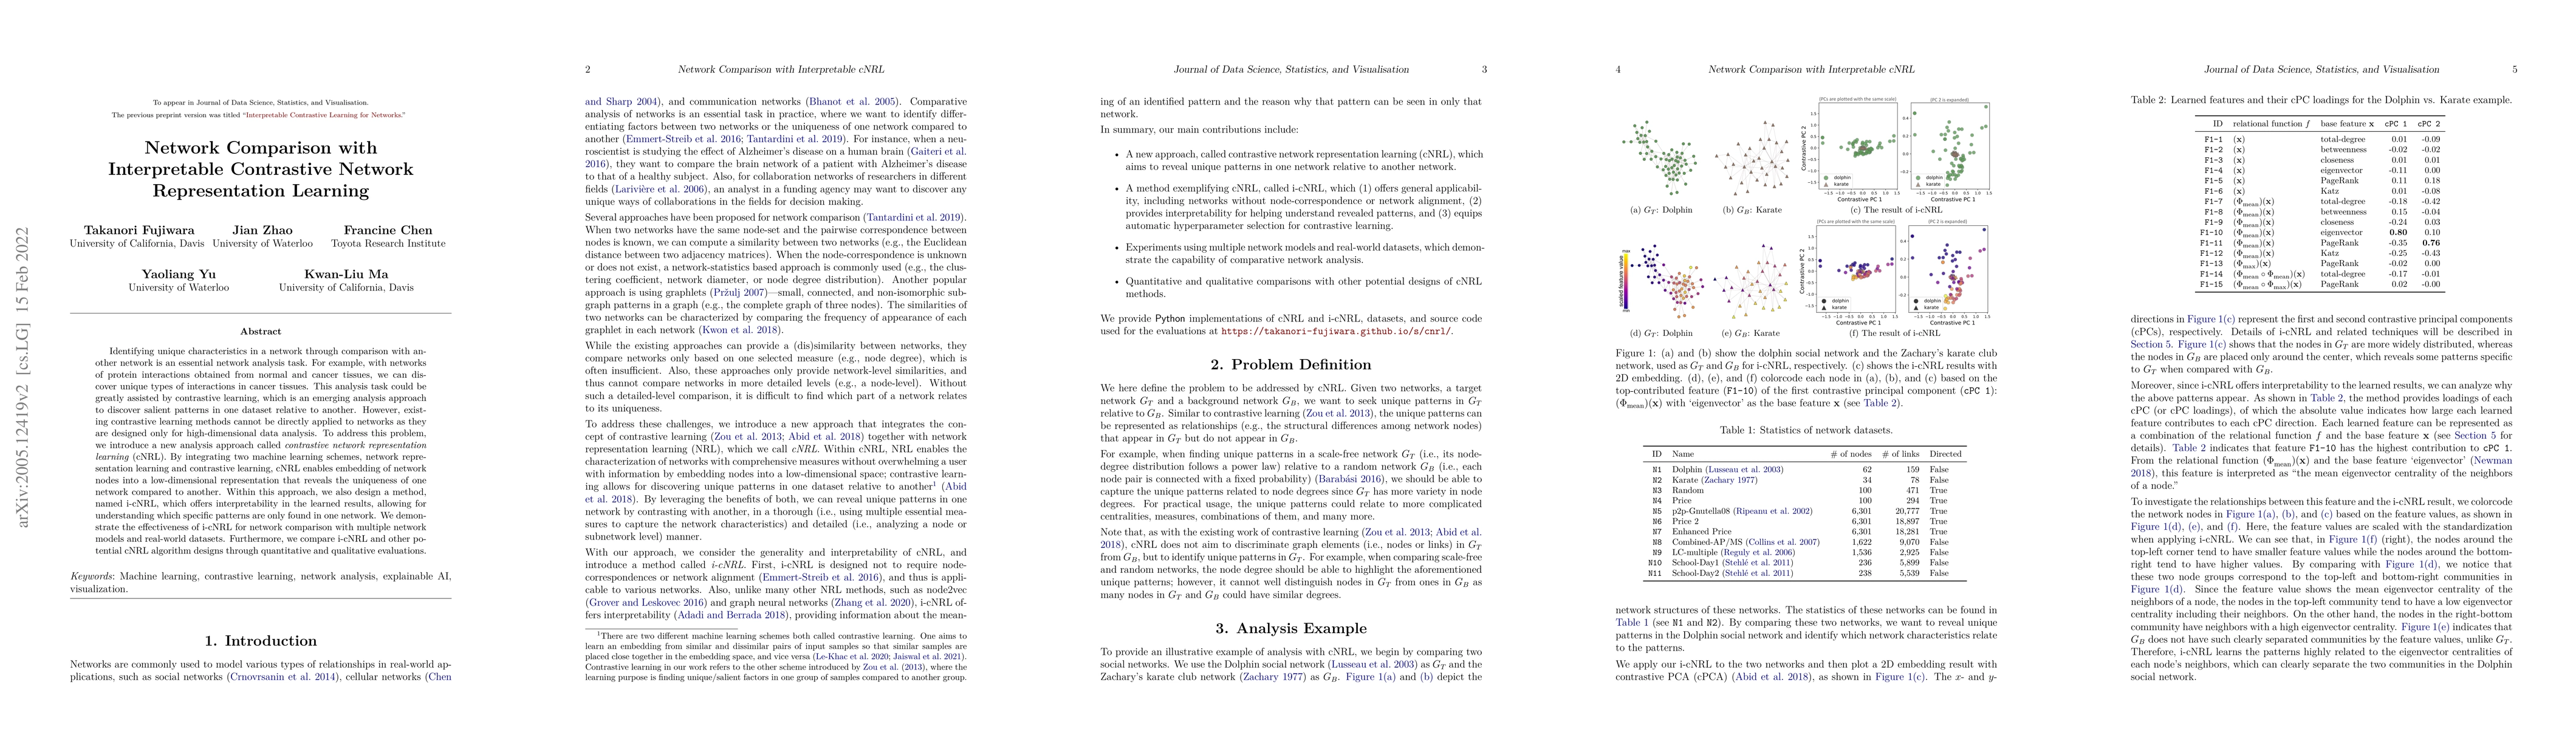
Identifying unique characteristics in a network through comparison with another network is an essential network analysis task. For example, with networks of protein interactions obtained from normal...
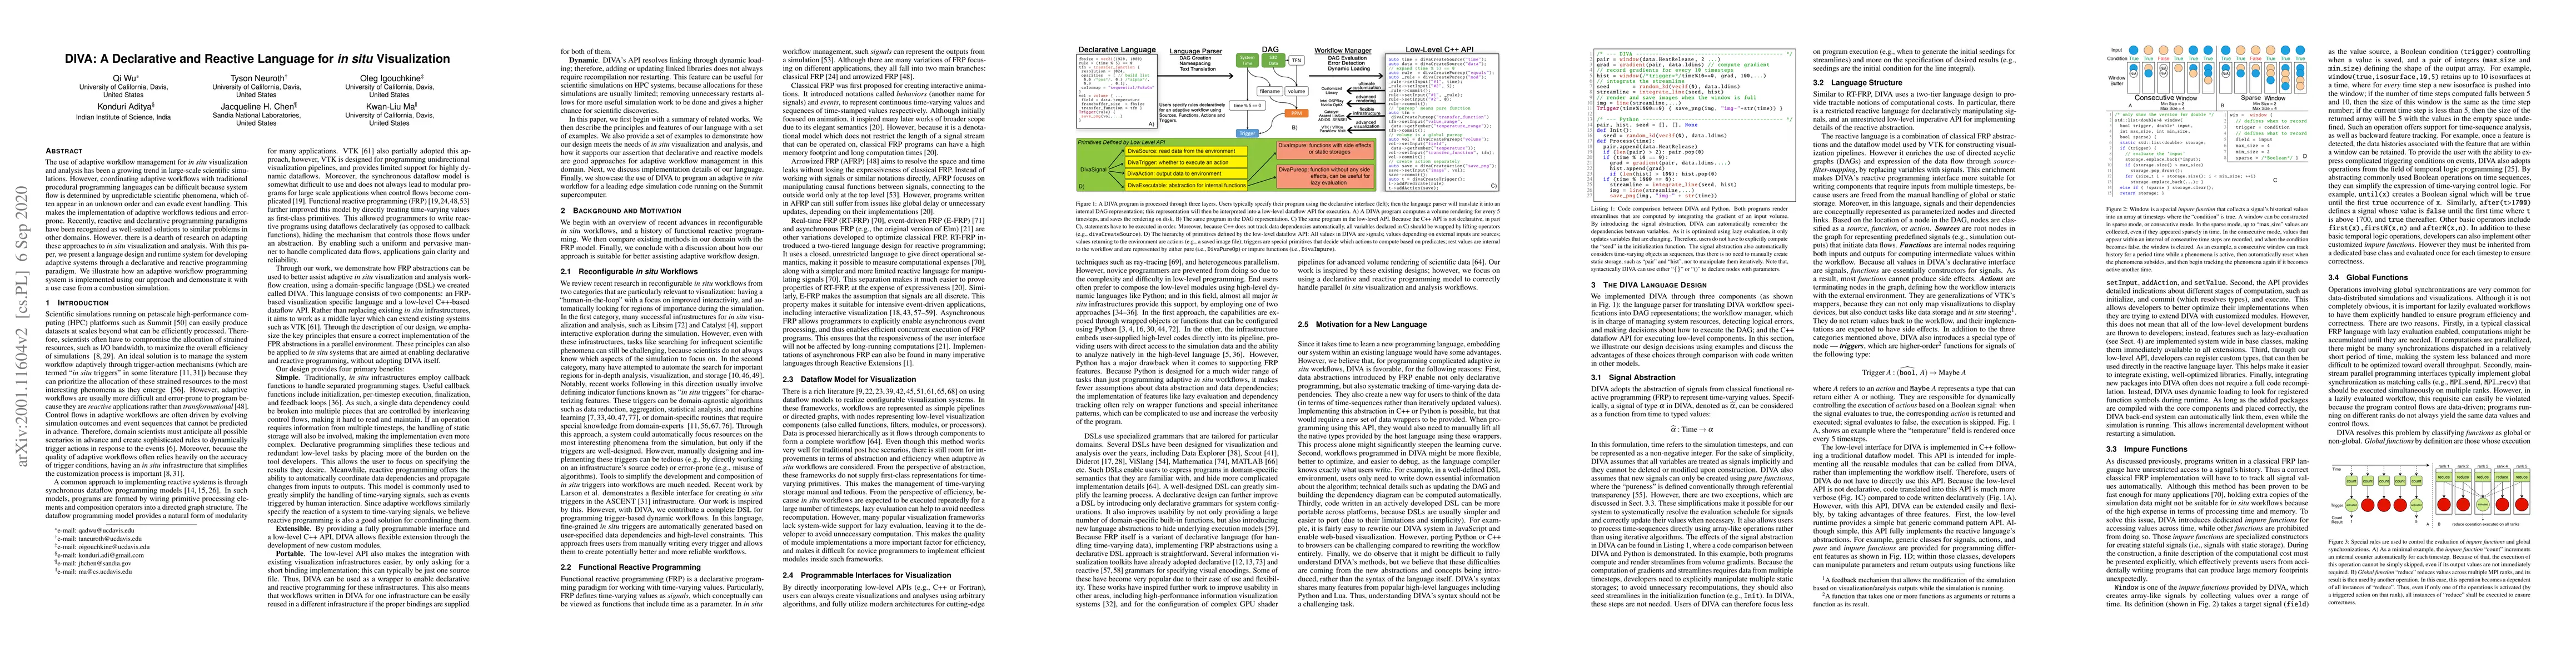
The use of adaptive workflow management for in situ visualization and analysis has been a growing trend in large-scale scientific simulations. However, coordinating adaptive workflows with tradition...
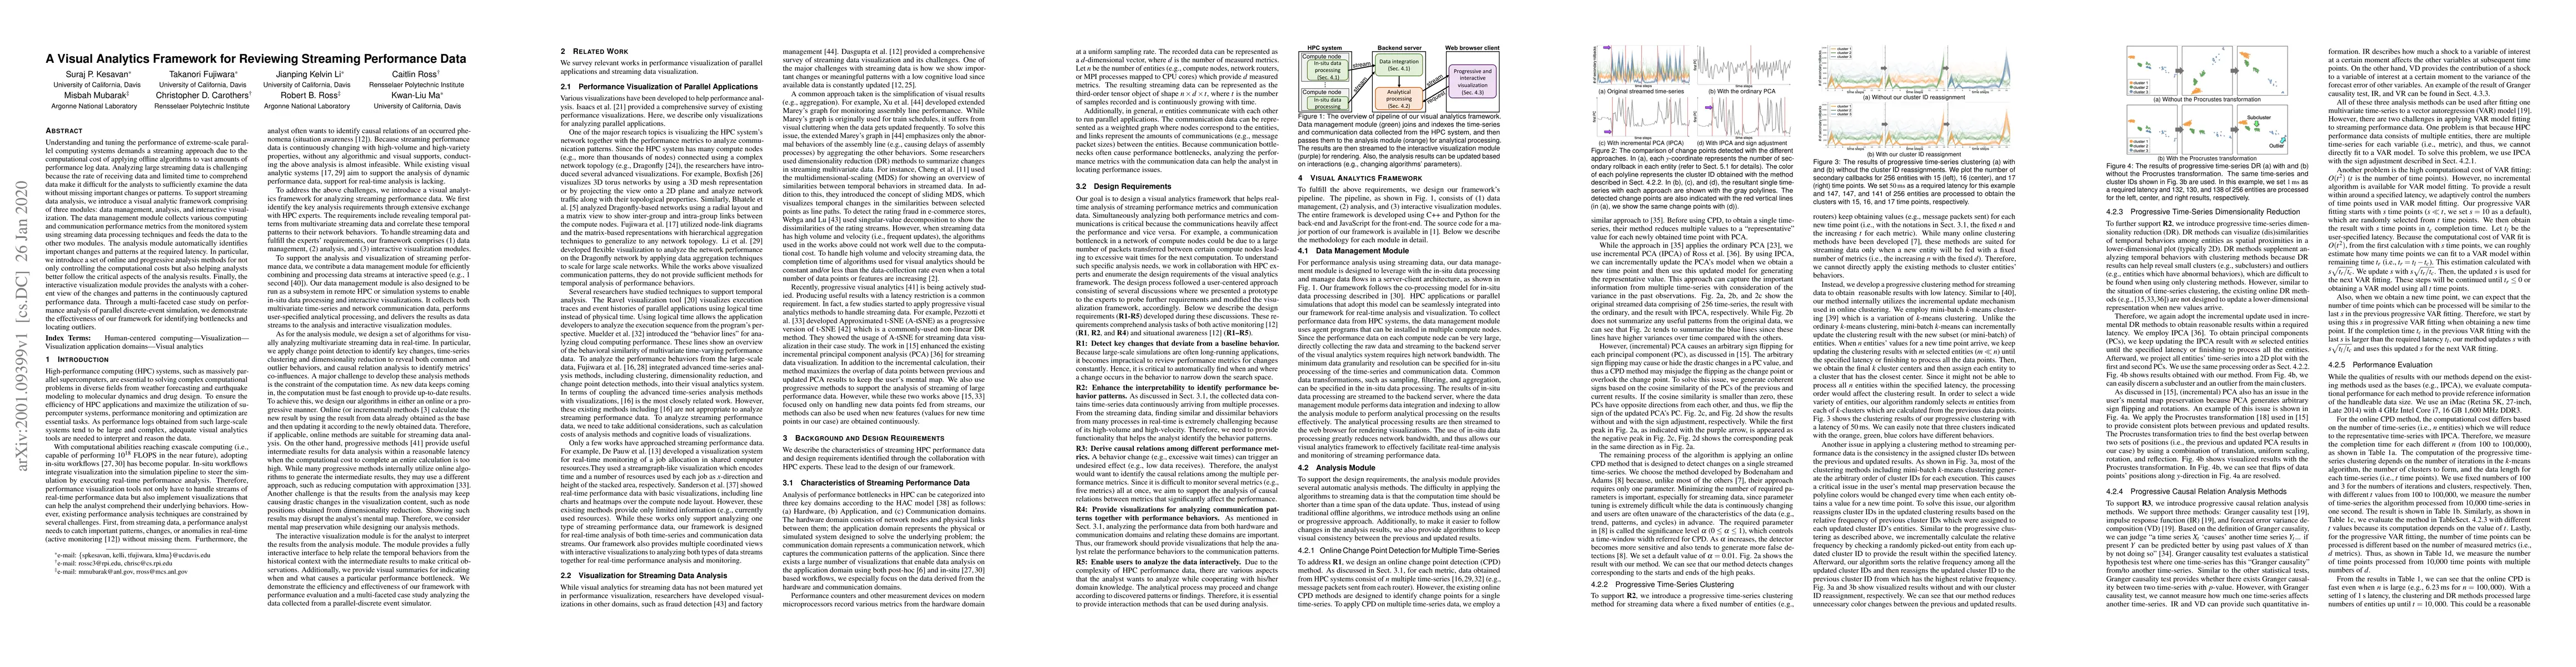
Understanding and tuning the performance of extreme-scale parallel computing systems demands a streaming approach due to the computational cost of applying offline algorithms to vast amounts of perf...
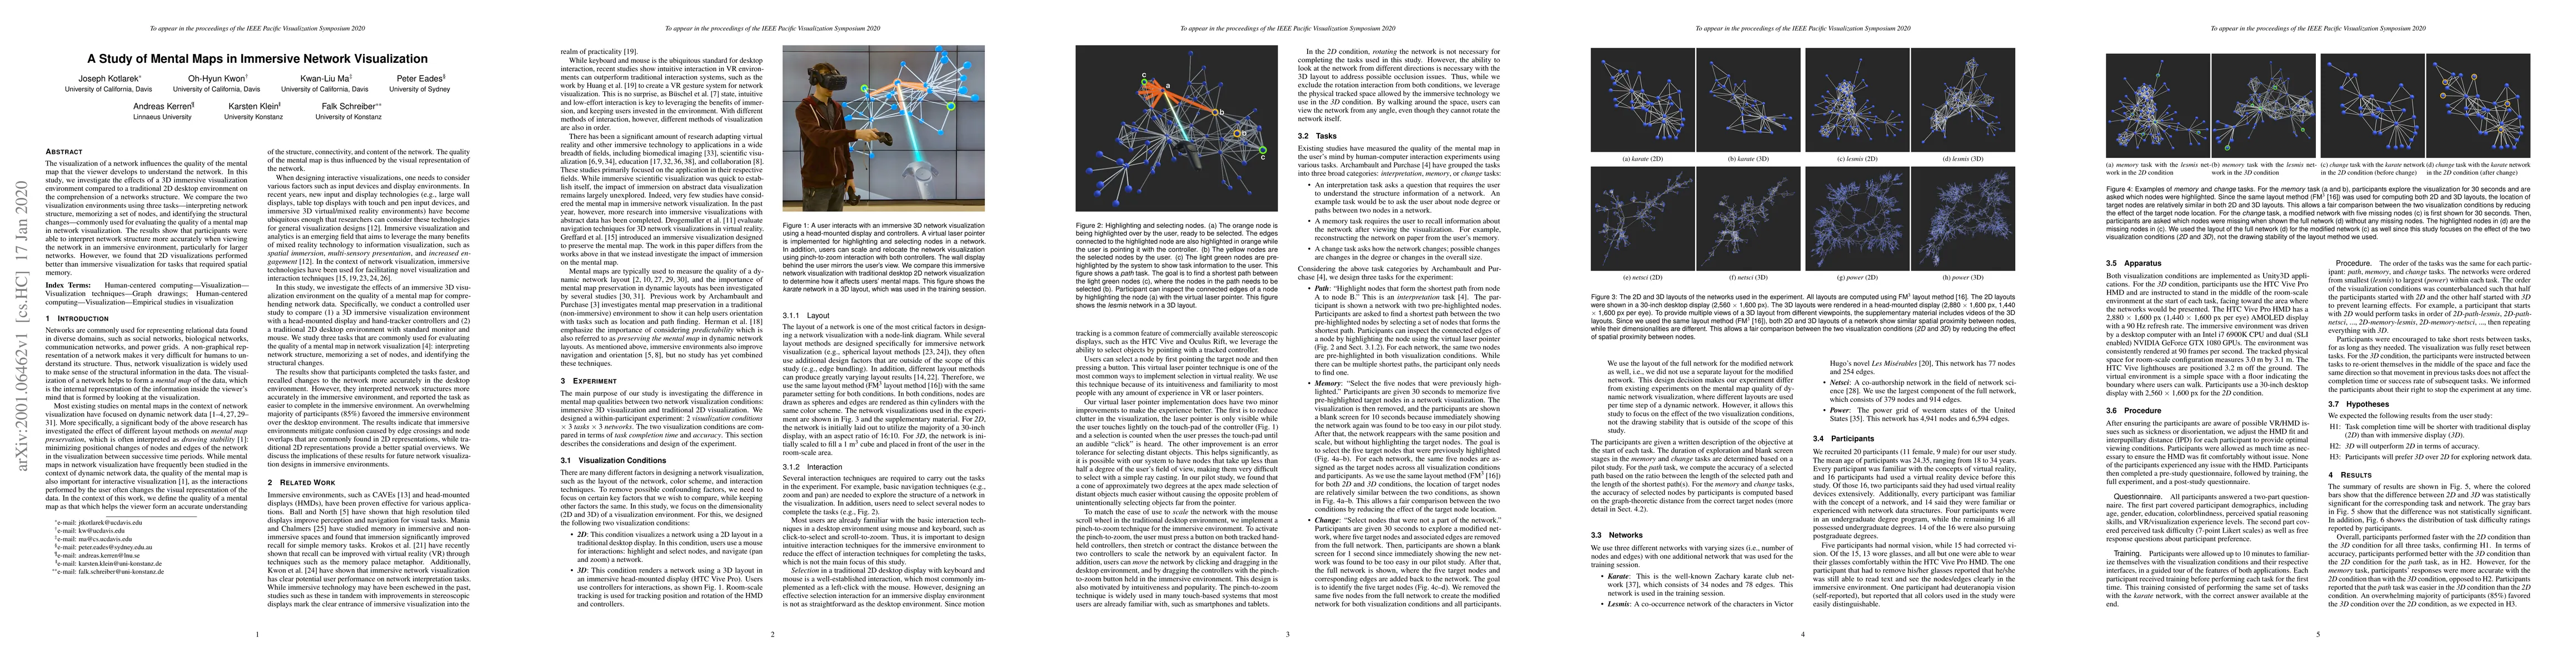
The visualization of a network influences the quality of the mental map that the viewer develops to understand the network. In this study, we investigate the effects of a 3D immersive visualization ...
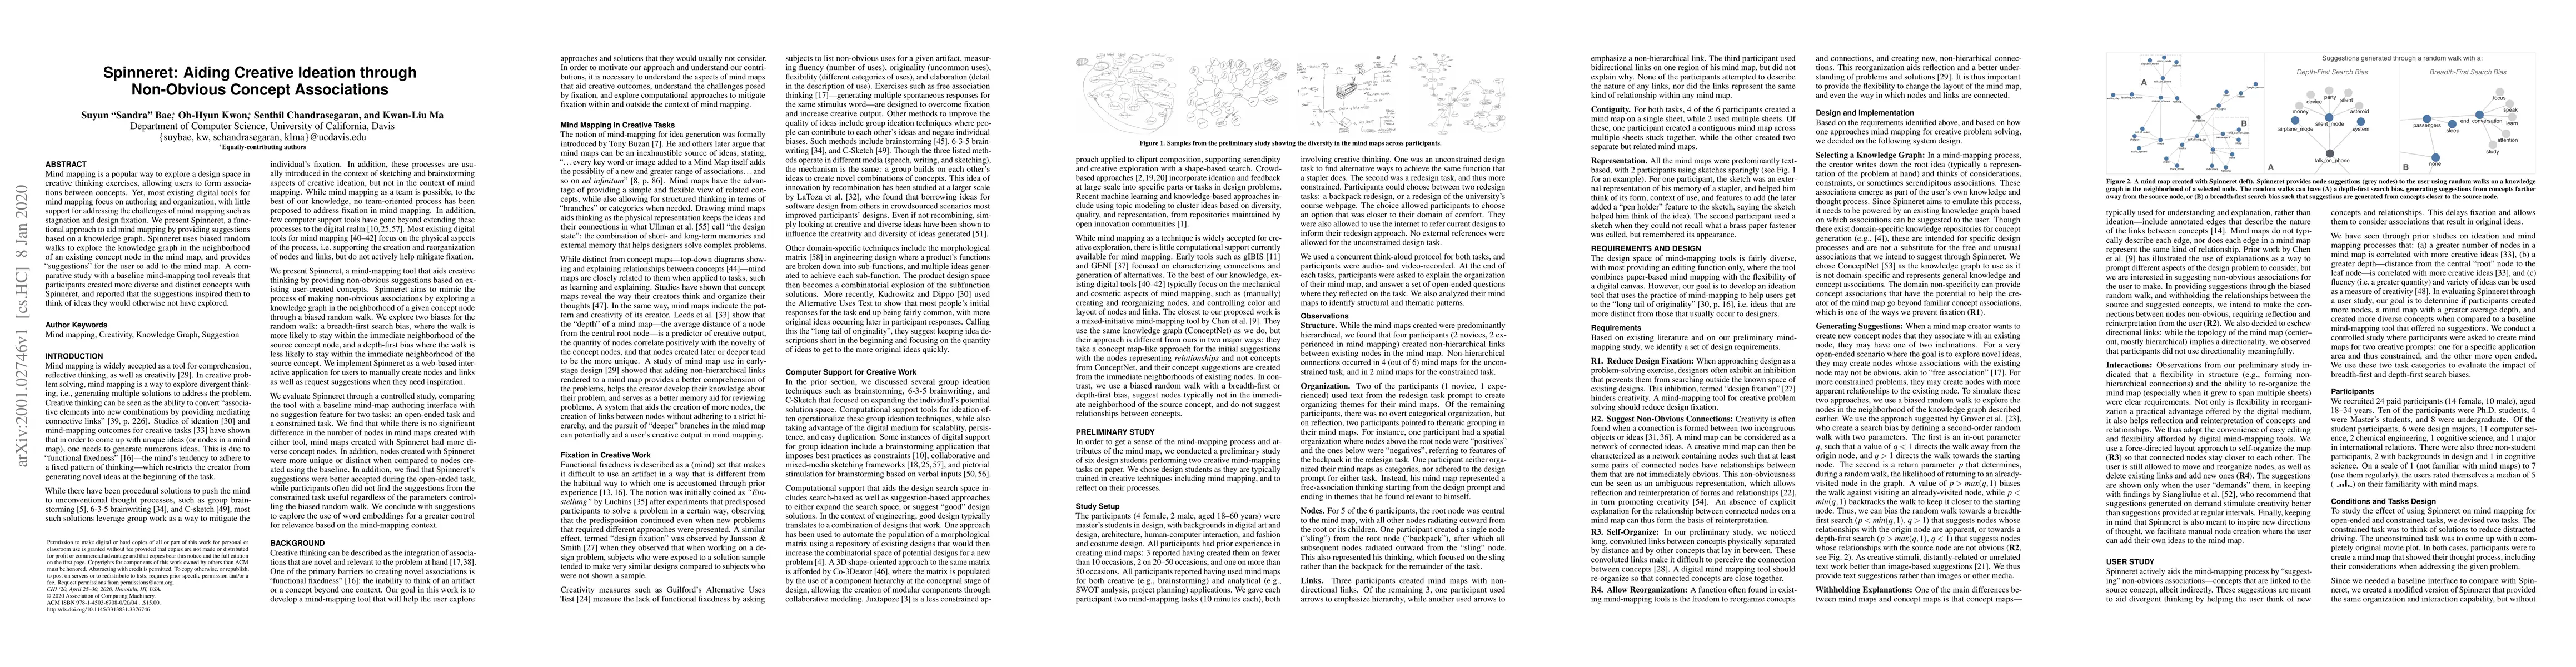
Mind mapping is a popular way to explore a design space in creative thinking exercises, allowing users to form associations between concepts. Yet, most existing digital tools for mind mapping focus ...
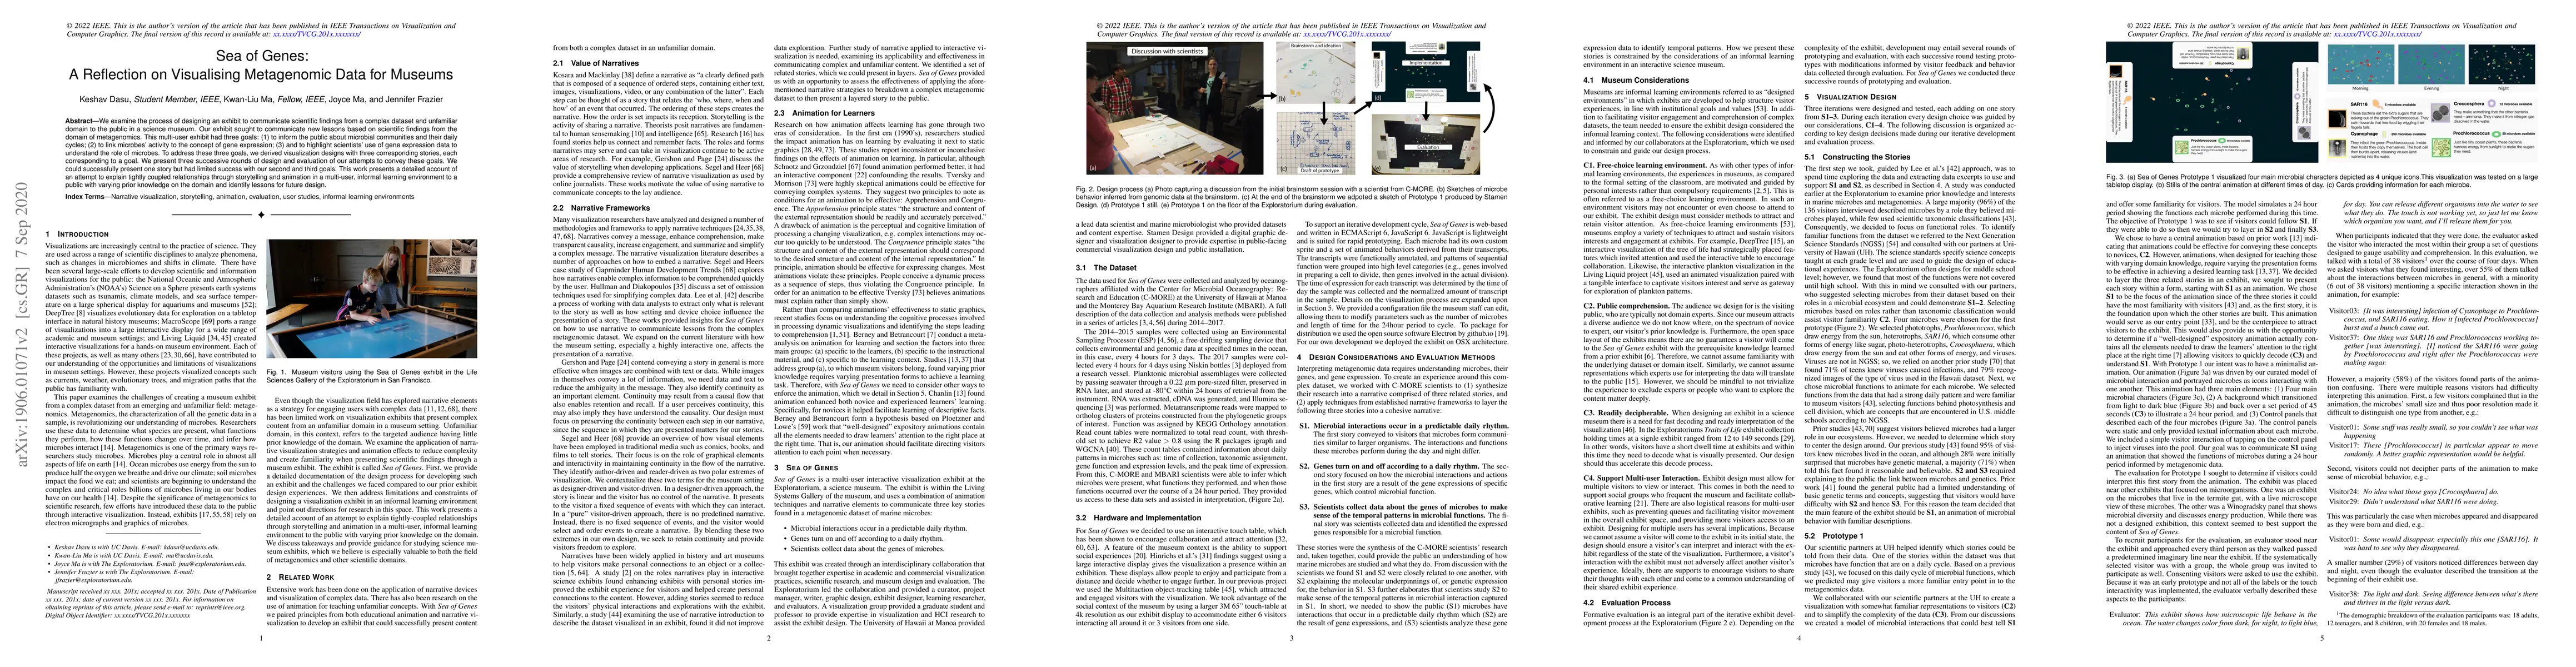
We examine the application of narrative strategies to present a complex and unfamiliar metagenomics dataset to the public in a science museum. Our dataset contains information about microbial gene e...
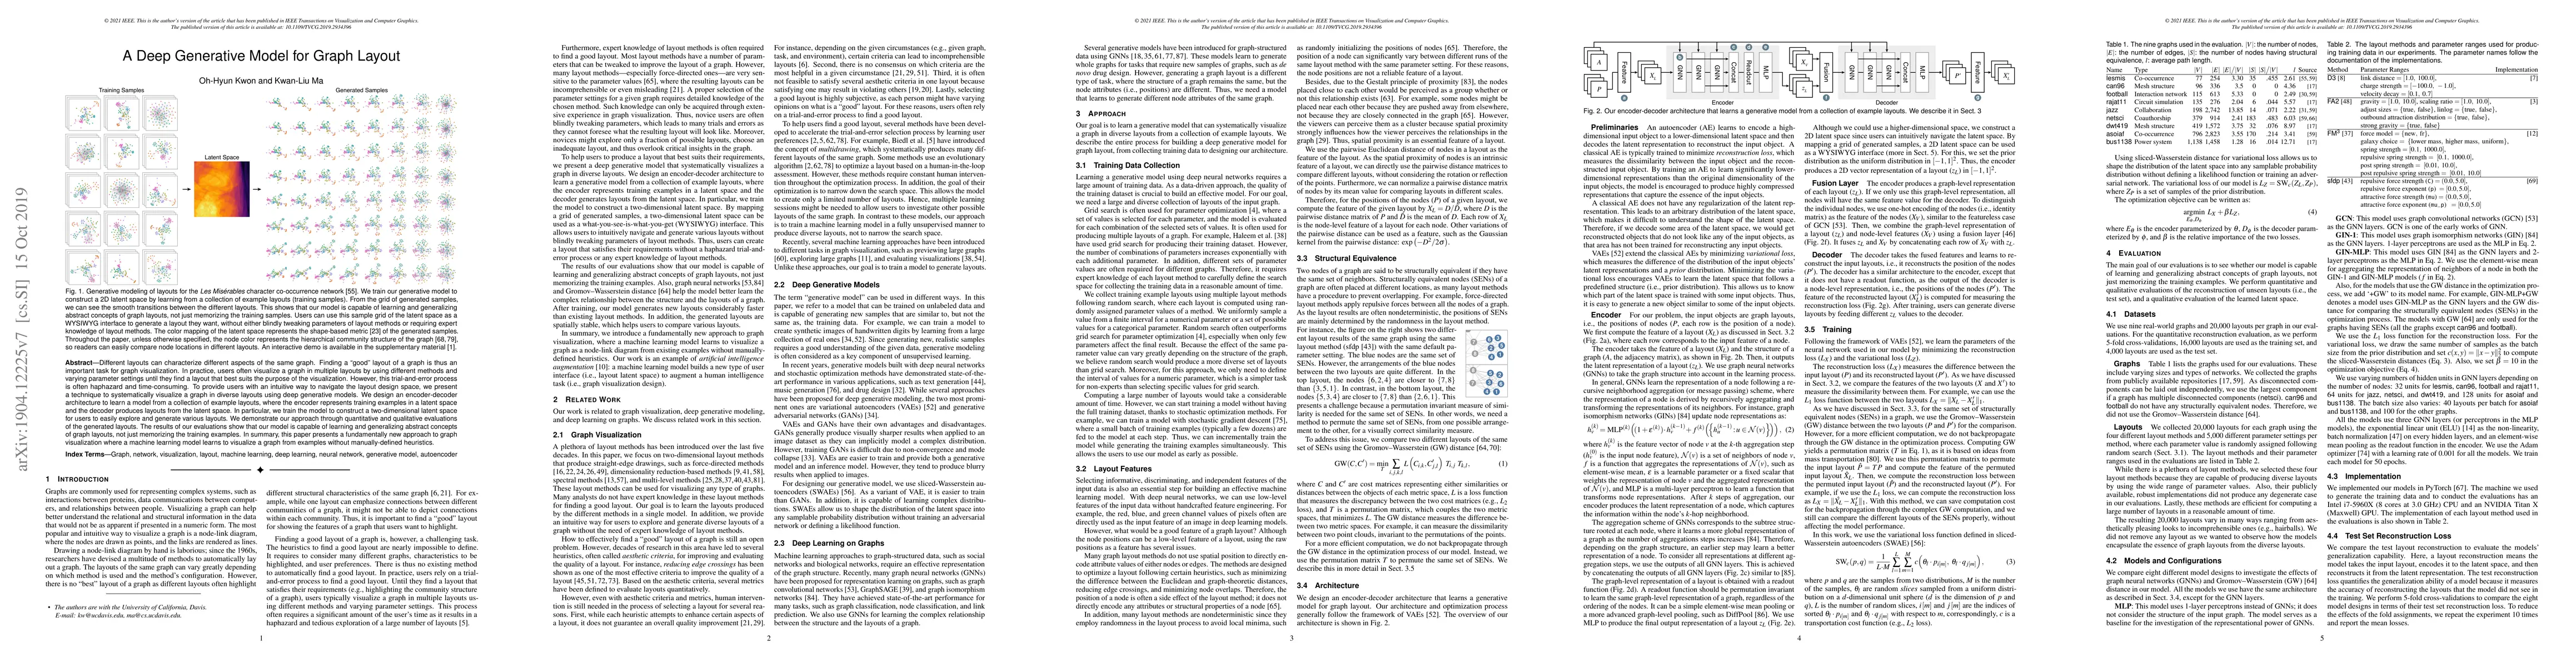
Different layouts can characterize different aspects of the same graph. Finding a "good" layout of a graph is thus an important task for graph visualization. In practice, users often visualize a gra...
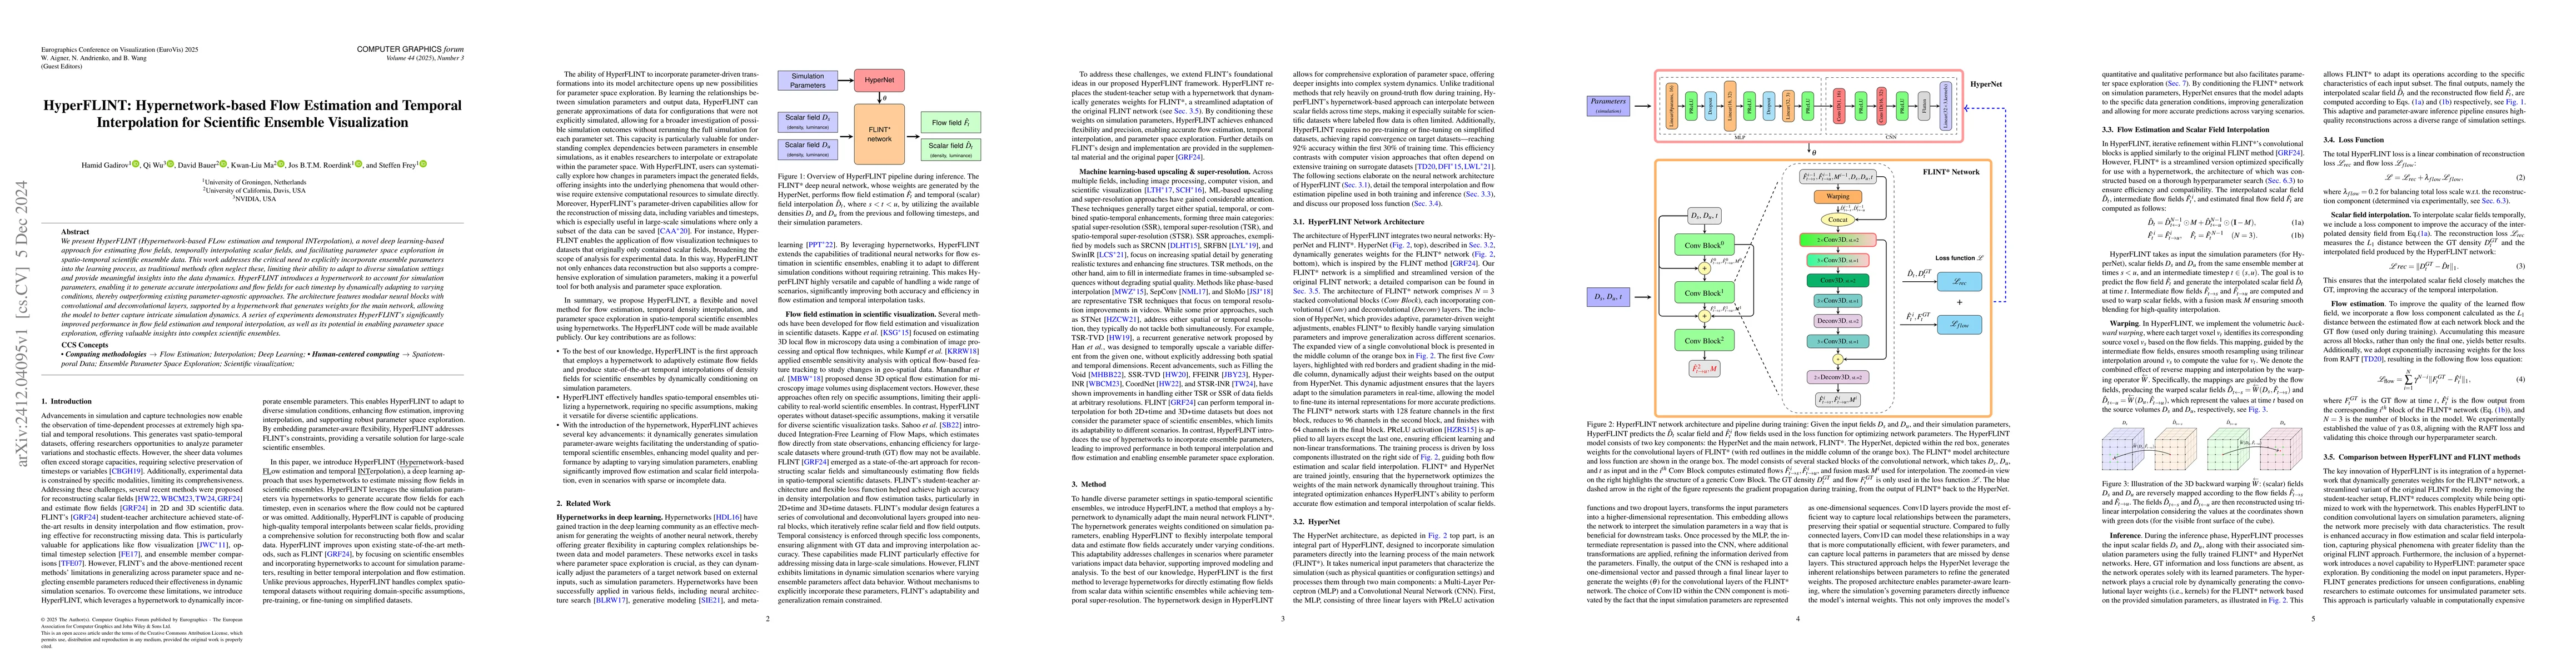
We present HyperFLINT (Hypernetwork-based FLow estimation and temporal INTerpolation), a novel deep learning-based approach for estimating flow fields, temporally interpolating scalar fields, and faci...
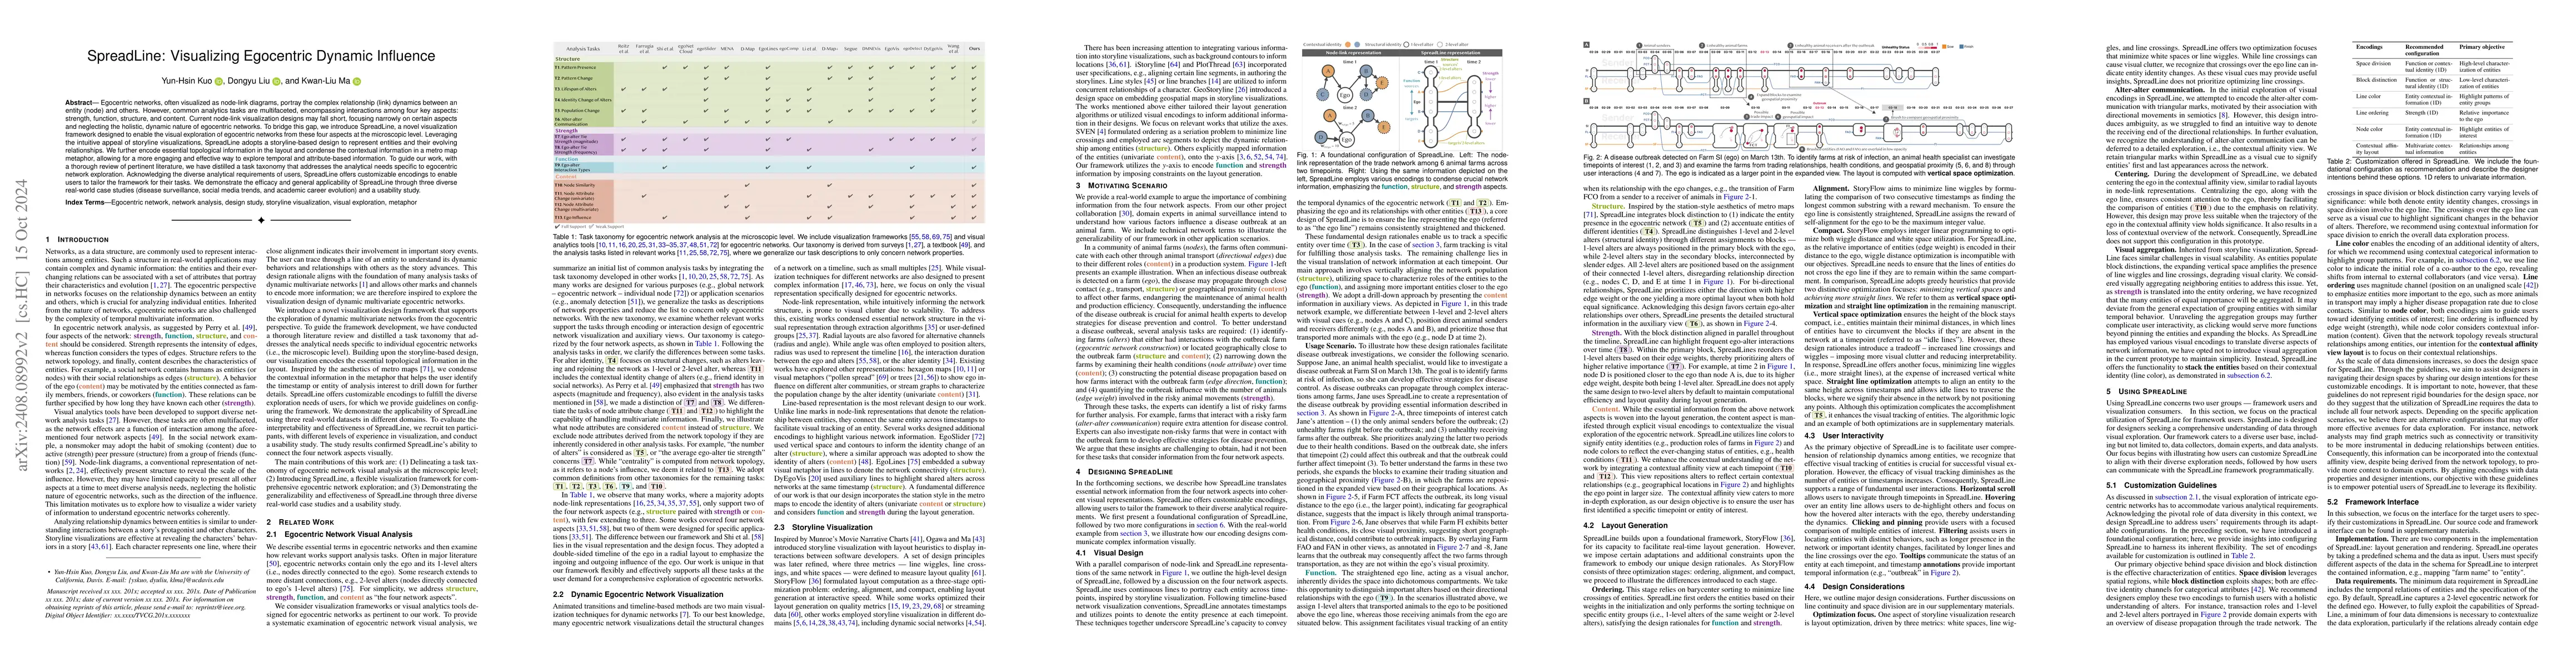
Egocentric networks, often visualized as node-link diagrams, portray the complex relationship (link) dynamics between an entity (node) and others. However, common analytics tasks are multifaceted, enc...
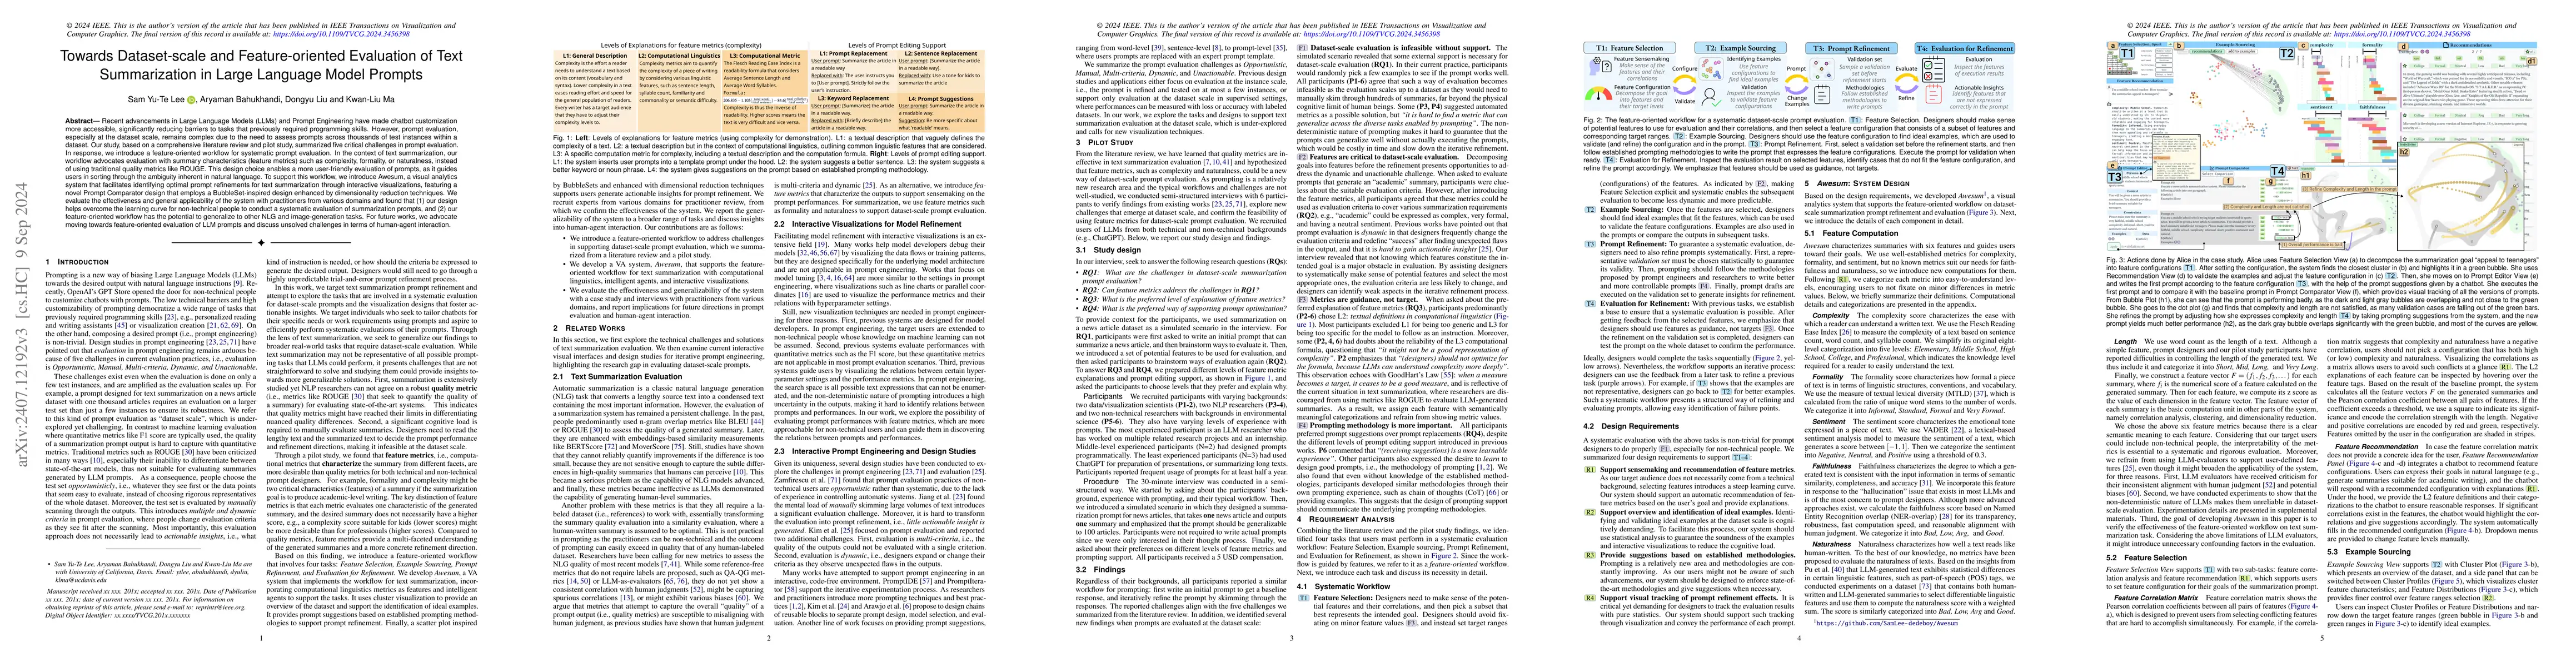
Recent advancements in Large Language Models (LLMs) and Prompt Engineering have made chatbot customization more accessible, significantly reducing barriers to tasks that previously required programmin...
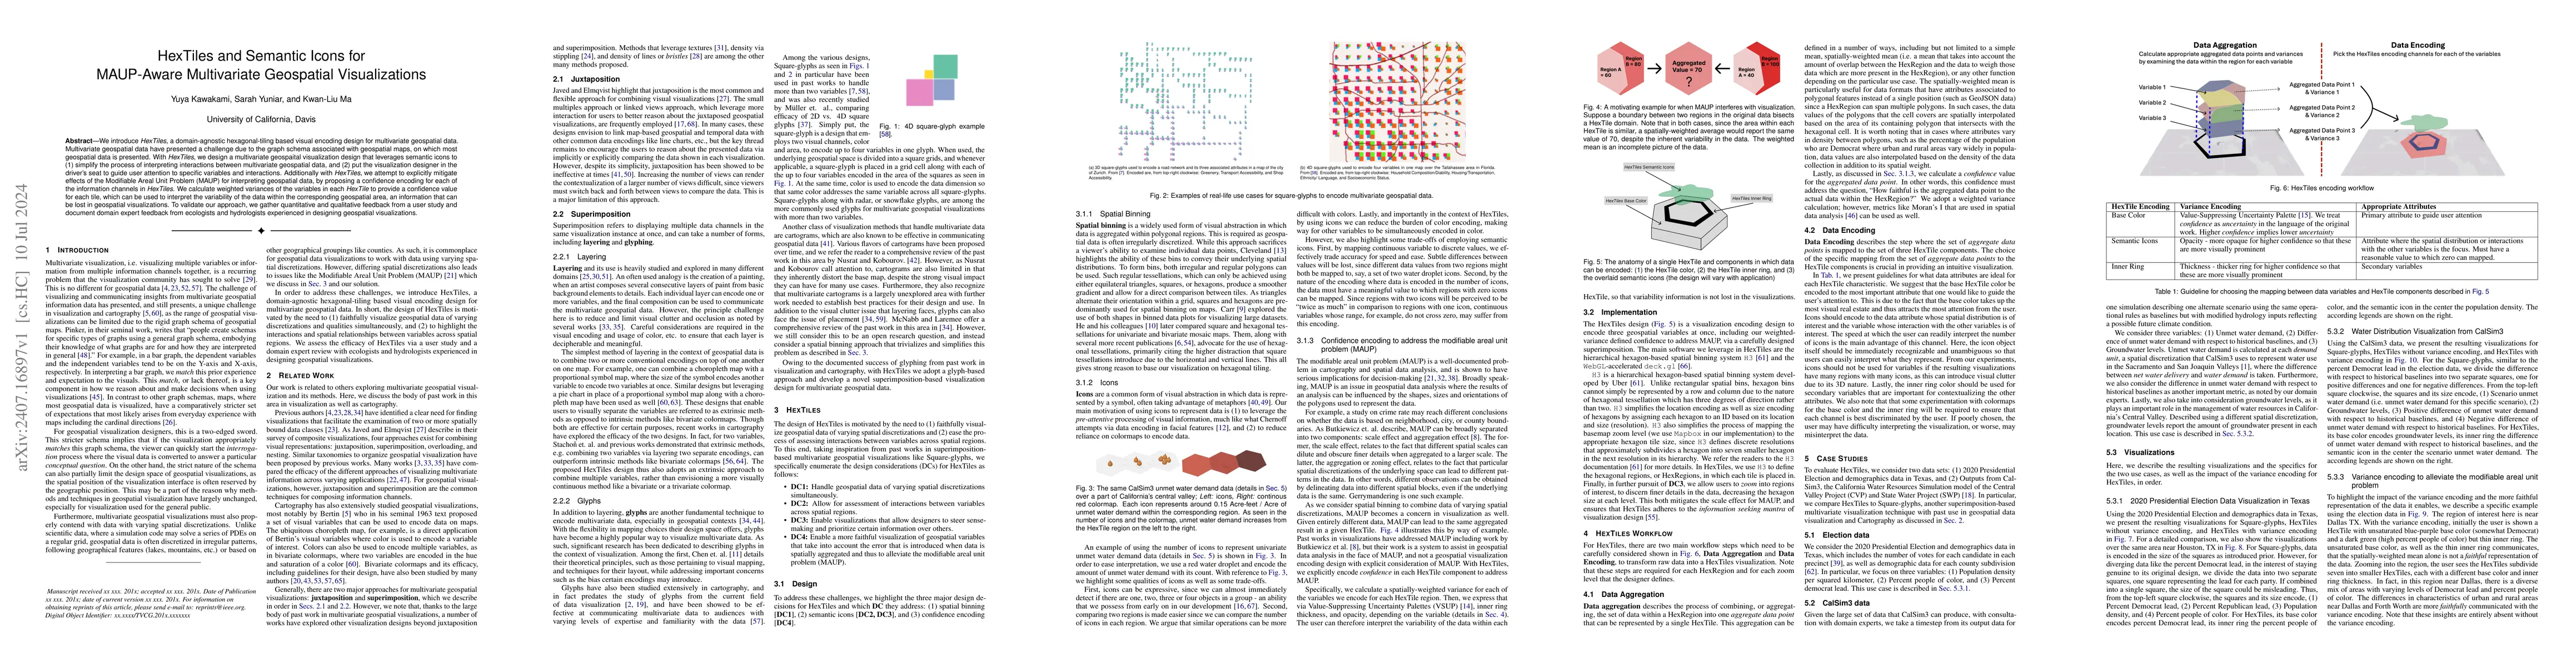
We introduce HexTiles, a domain-agnostic hexagonal-tiling based visual encoding design for multivariate geospatial data. Multivariate geospatial data have presented a challenge due to the graph schema...
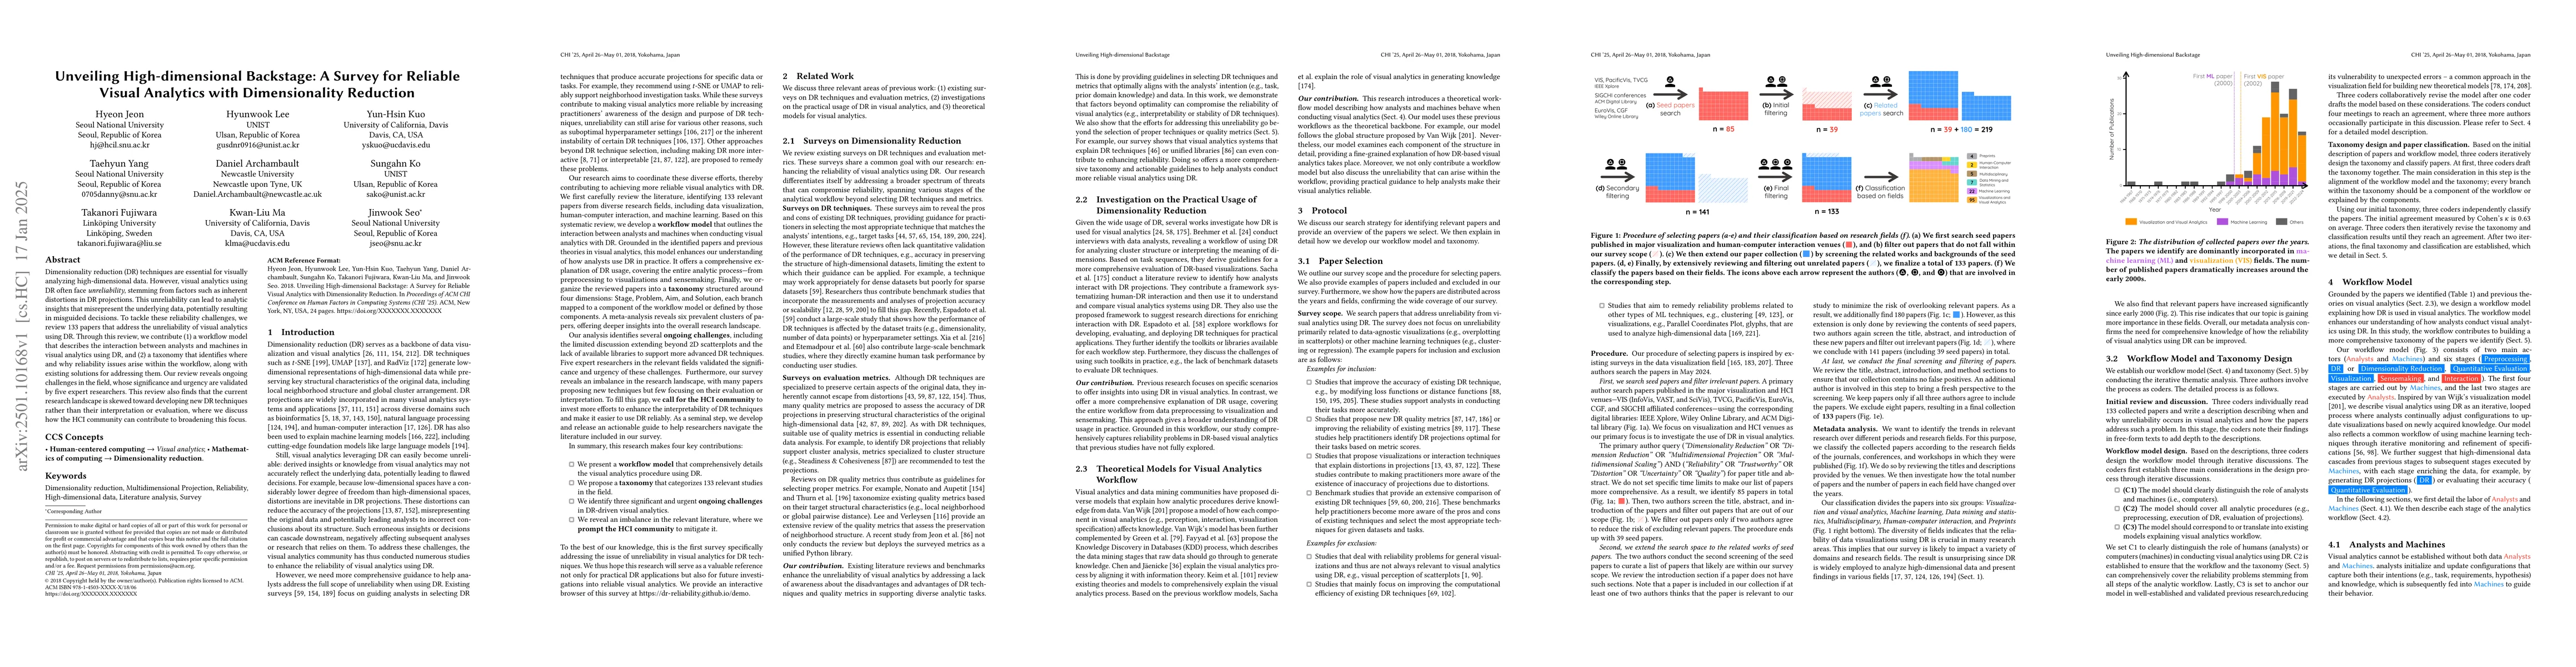
Dimensionality reduction (DR) techniques are essential for visually analyzing high-dimensional data. However, visual analytics using DR often face unreliability, stemming from factors such as inherent...
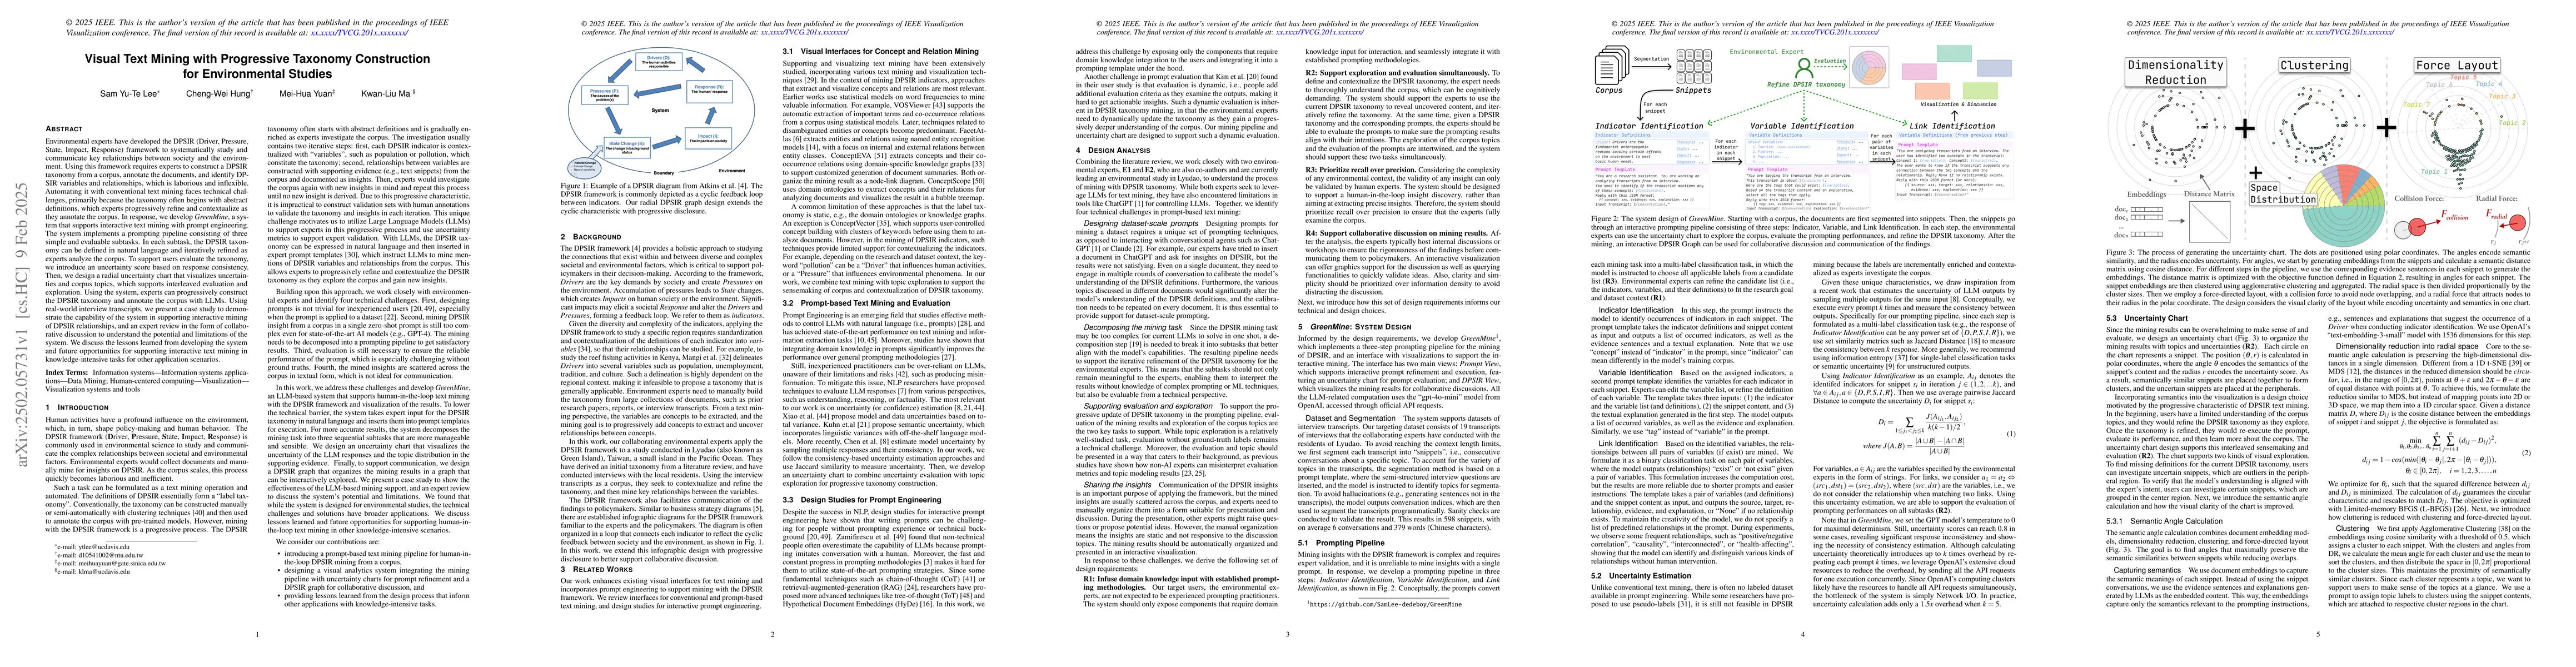
Environmental experts have developed the DPSIR (Driver, Pressure, State, Impact, Response) framework to systematically study and communicate key relationships between society and the environment. Usin...
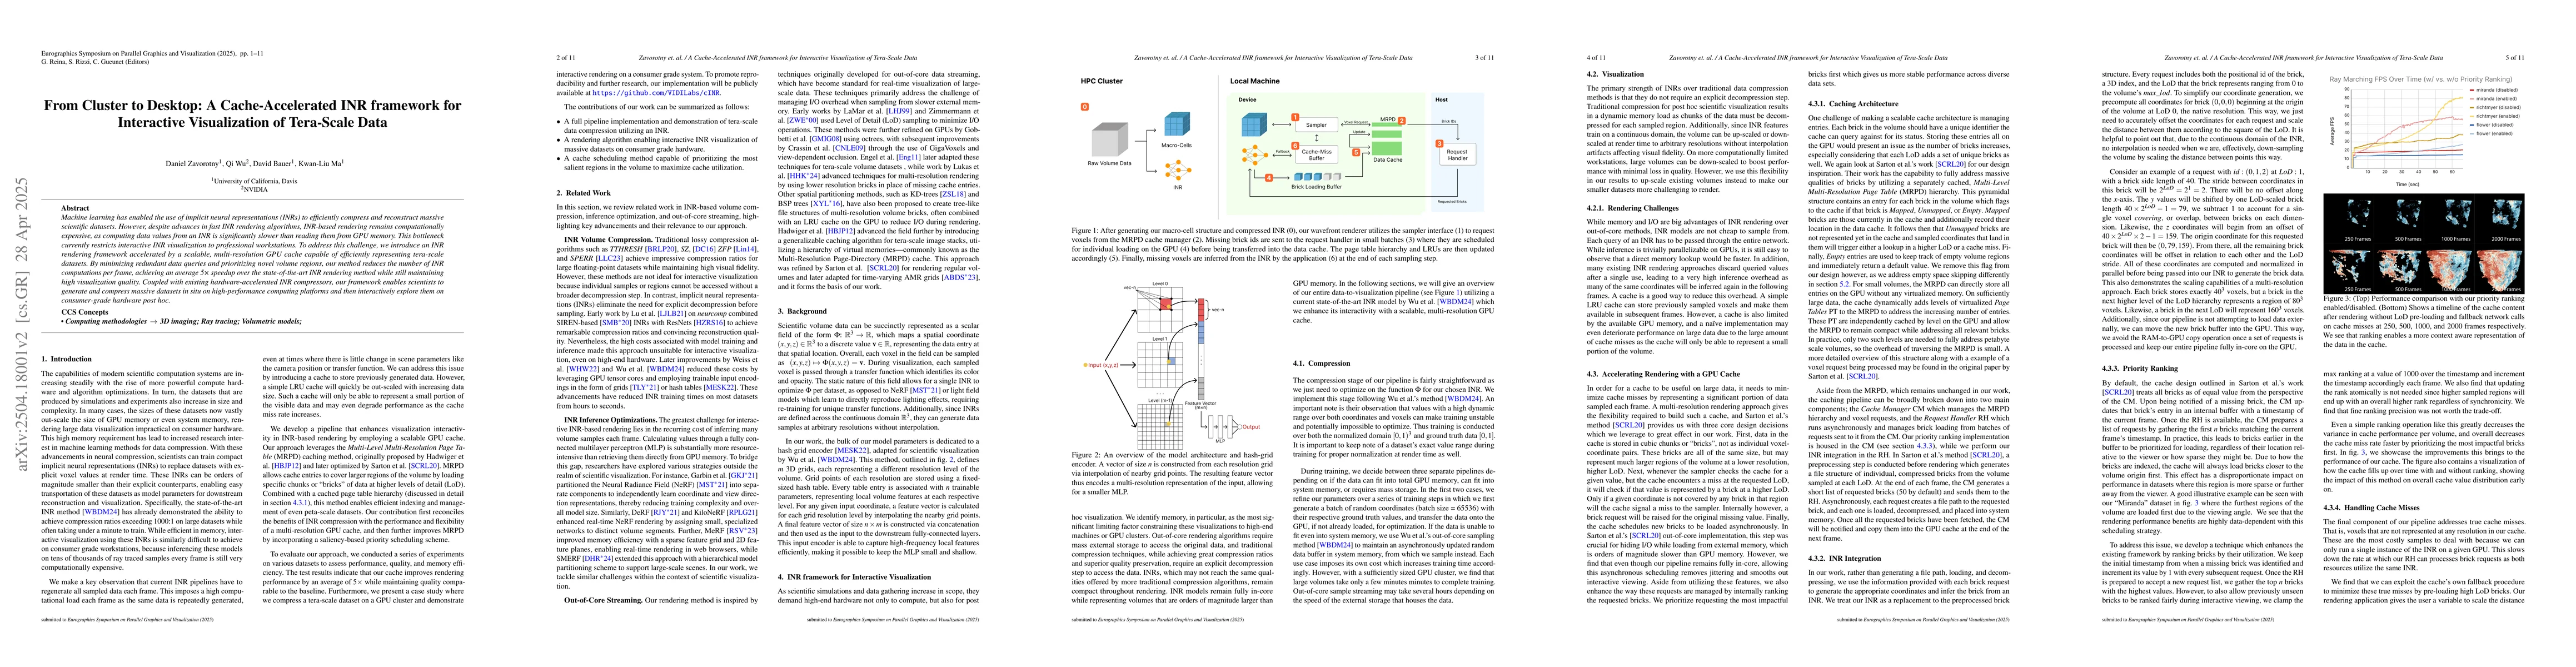
Machine learning has enabled the use of implicit neural representations (INRs) to efficiently compress and reconstruct massive scientific datasets. However, despite advances in fast INR rendering algo...
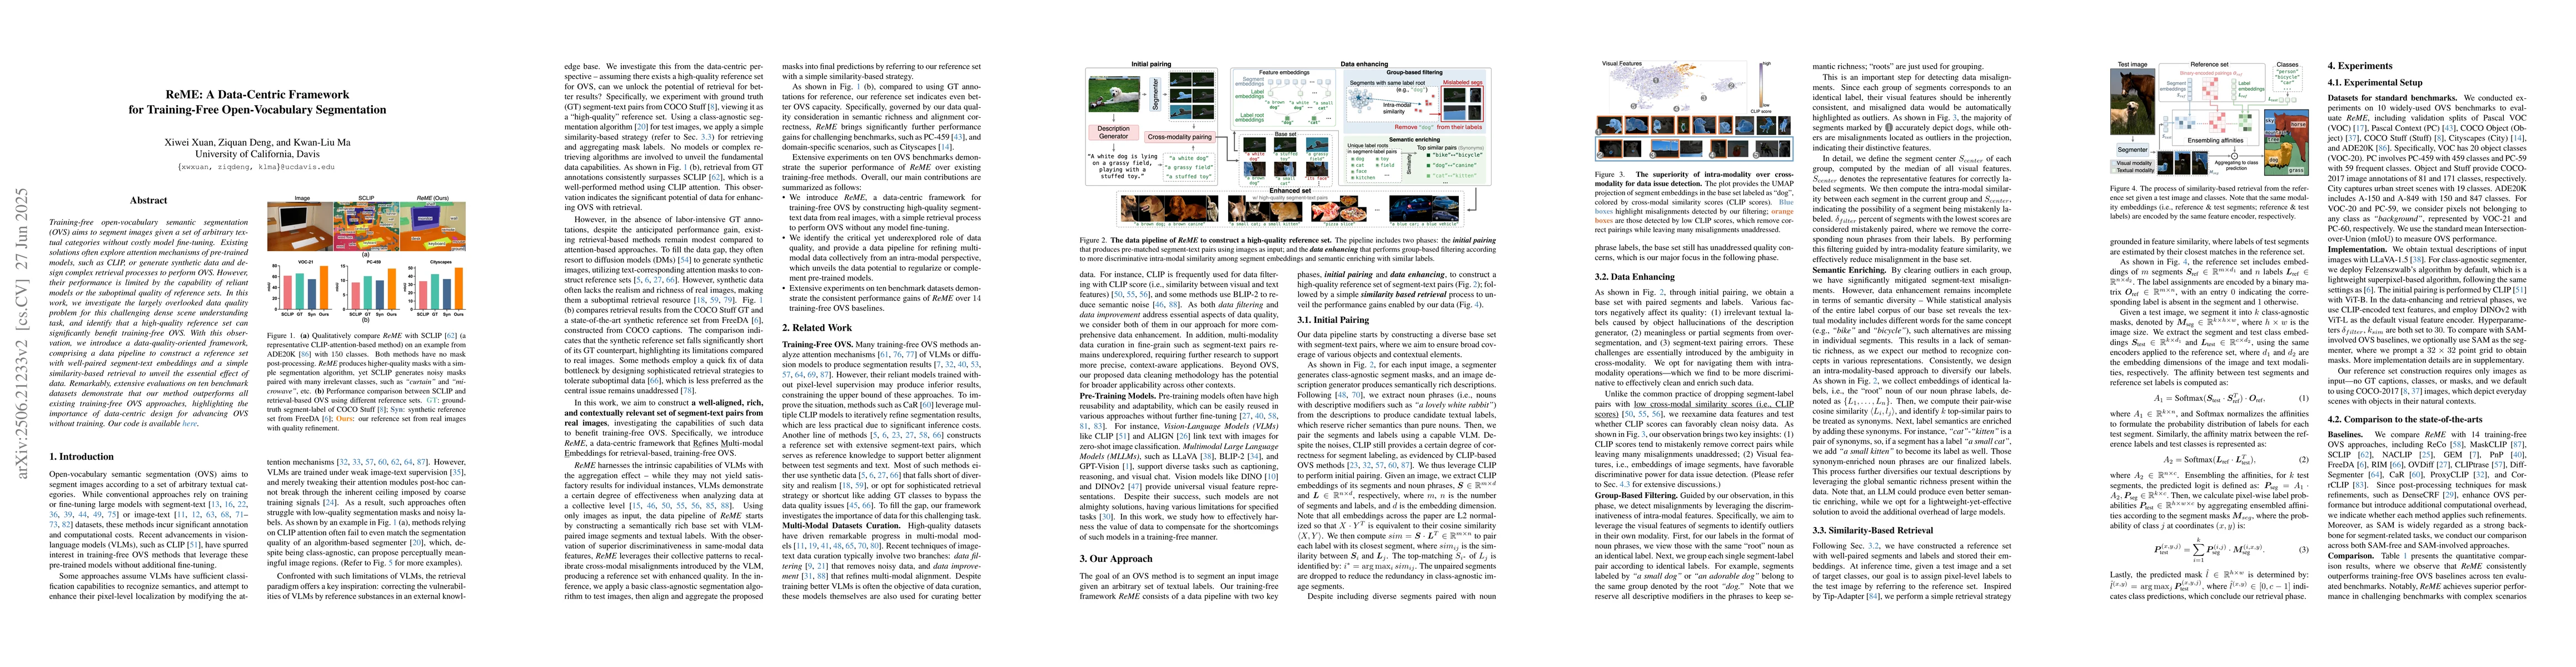
Training-free open-vocabulary semantic segmentation (OVS) aims to segment images given a set of arbitrary textual categories without costly model fine-tuning. Existing solutions often explore attentio...
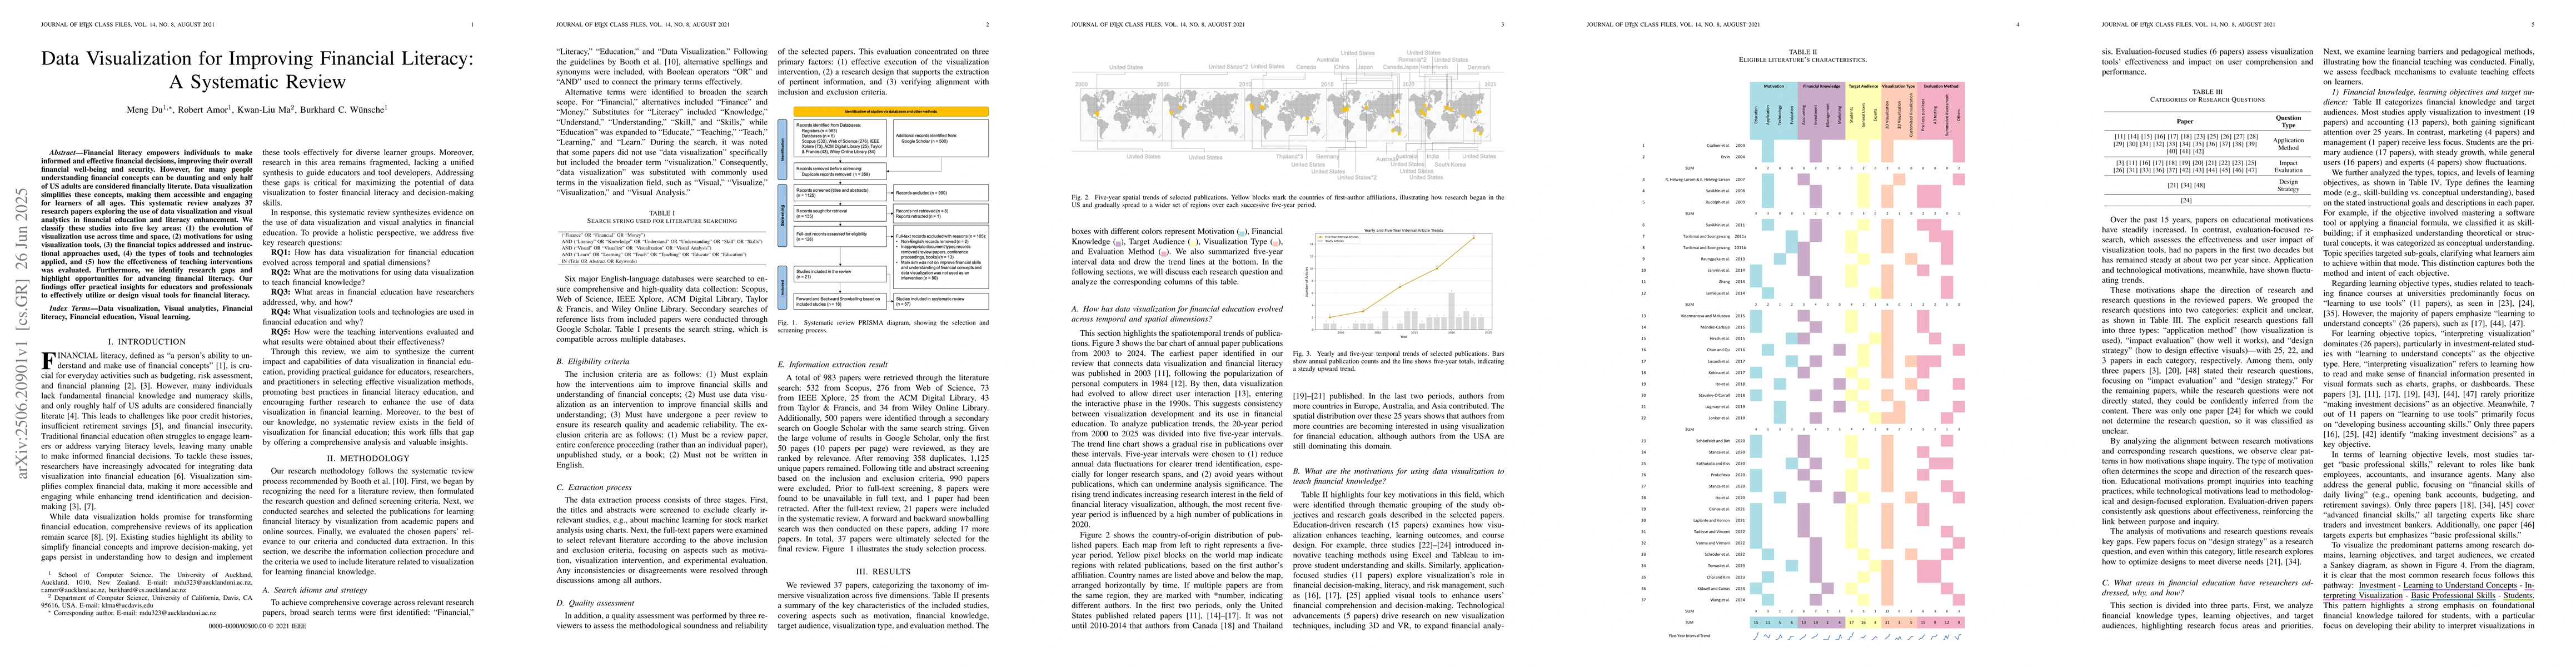
Financial literacy empowers individuals to make informed and effective financial decisions, improving their overall financial well-being and security. However, for many people understanding financial ...
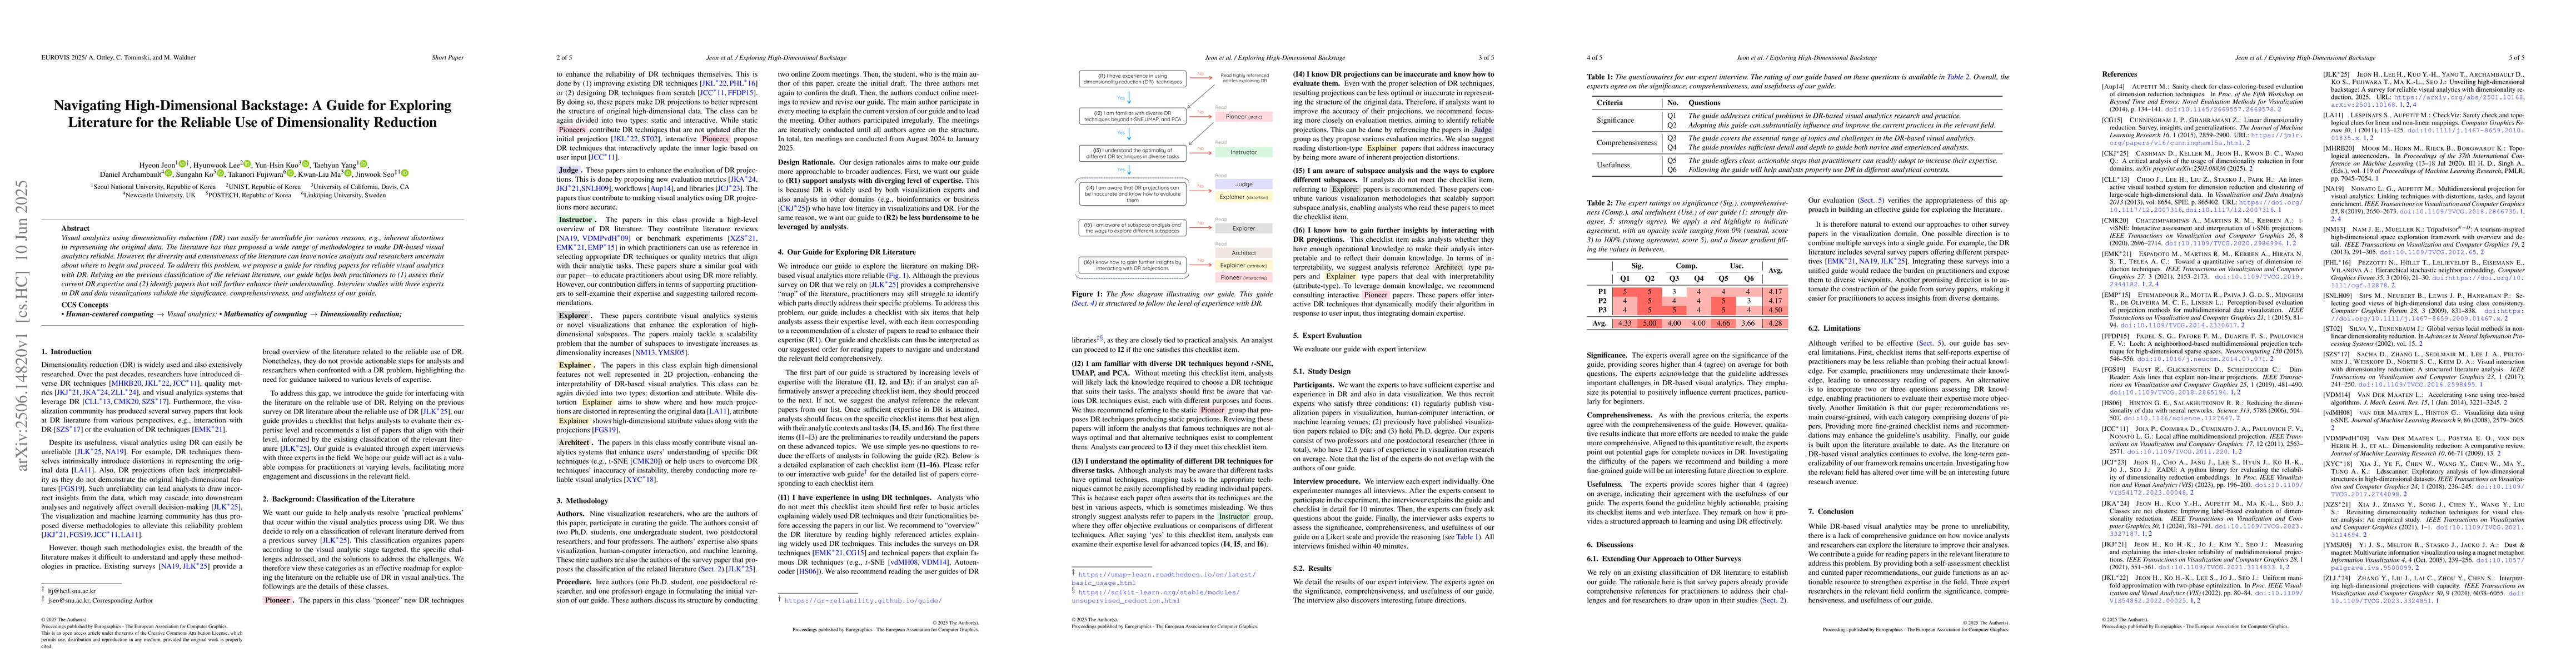
Visual analytics using dimensionality reduction (DR) can easily be unreliable for various reasons, e.g., inherent distortions in representing the original data. The literature has thus proposed a wide...
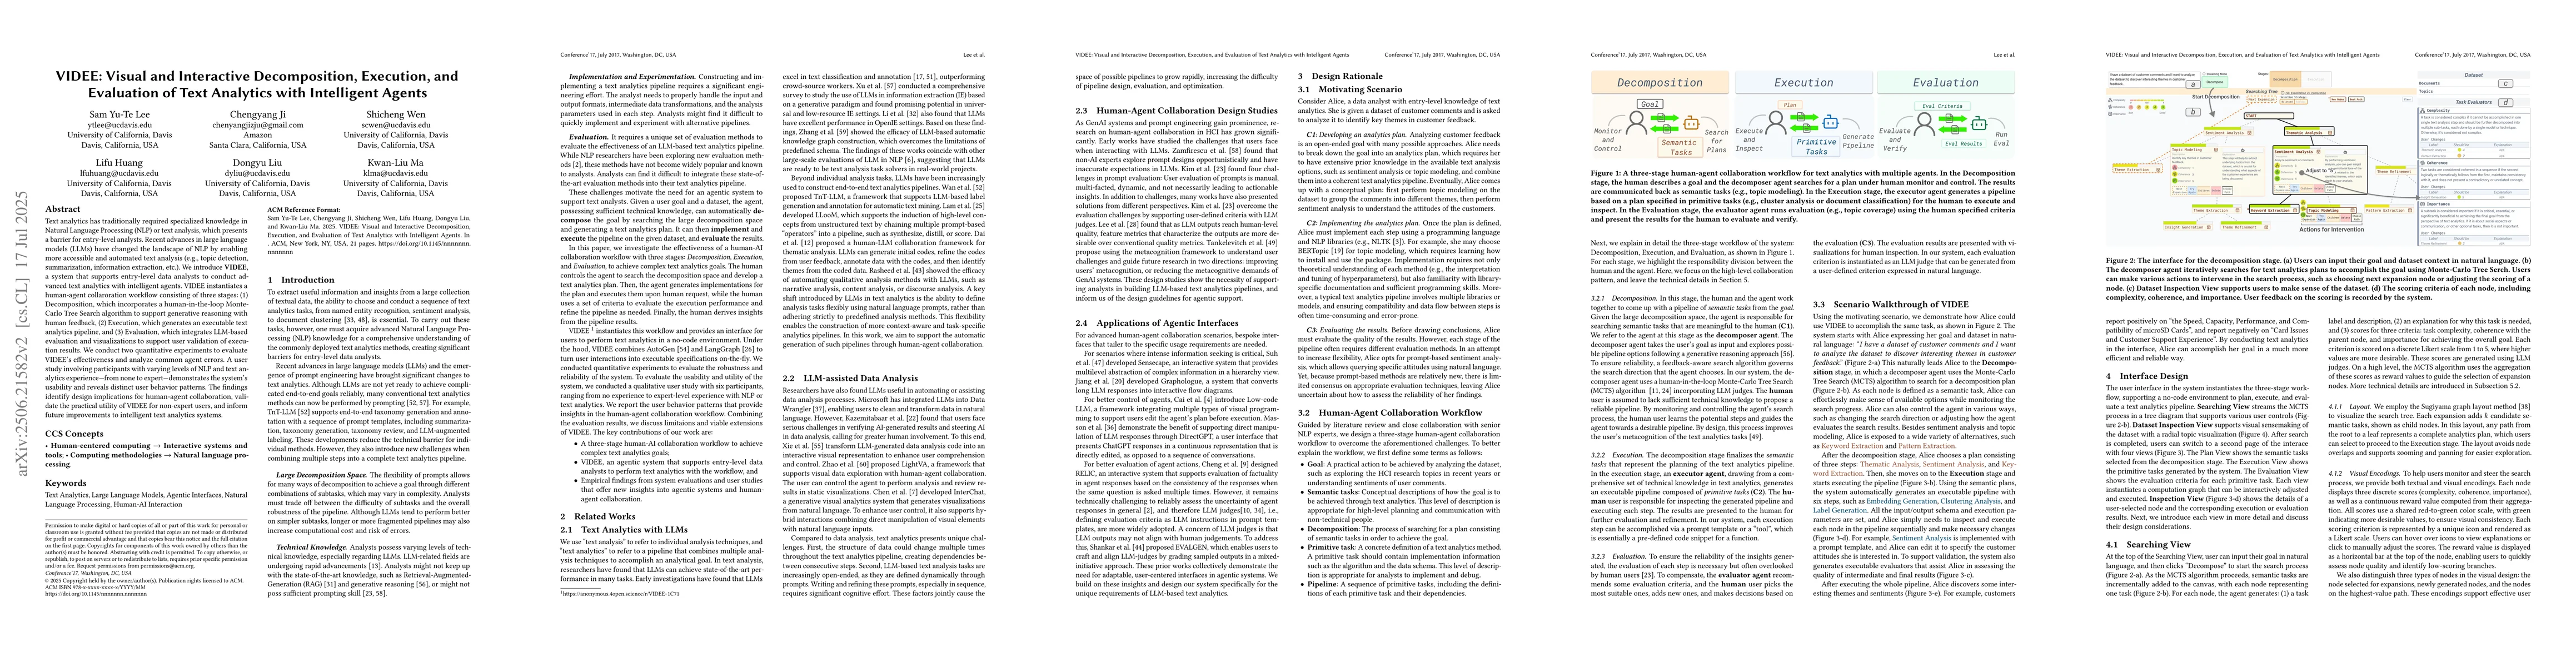
Text analytics has traditionally required specialized knowledge in Natural Language Processing (NLP) or text analysis, which presents a barrier for entry-level analysts. Recent advances in large langu...
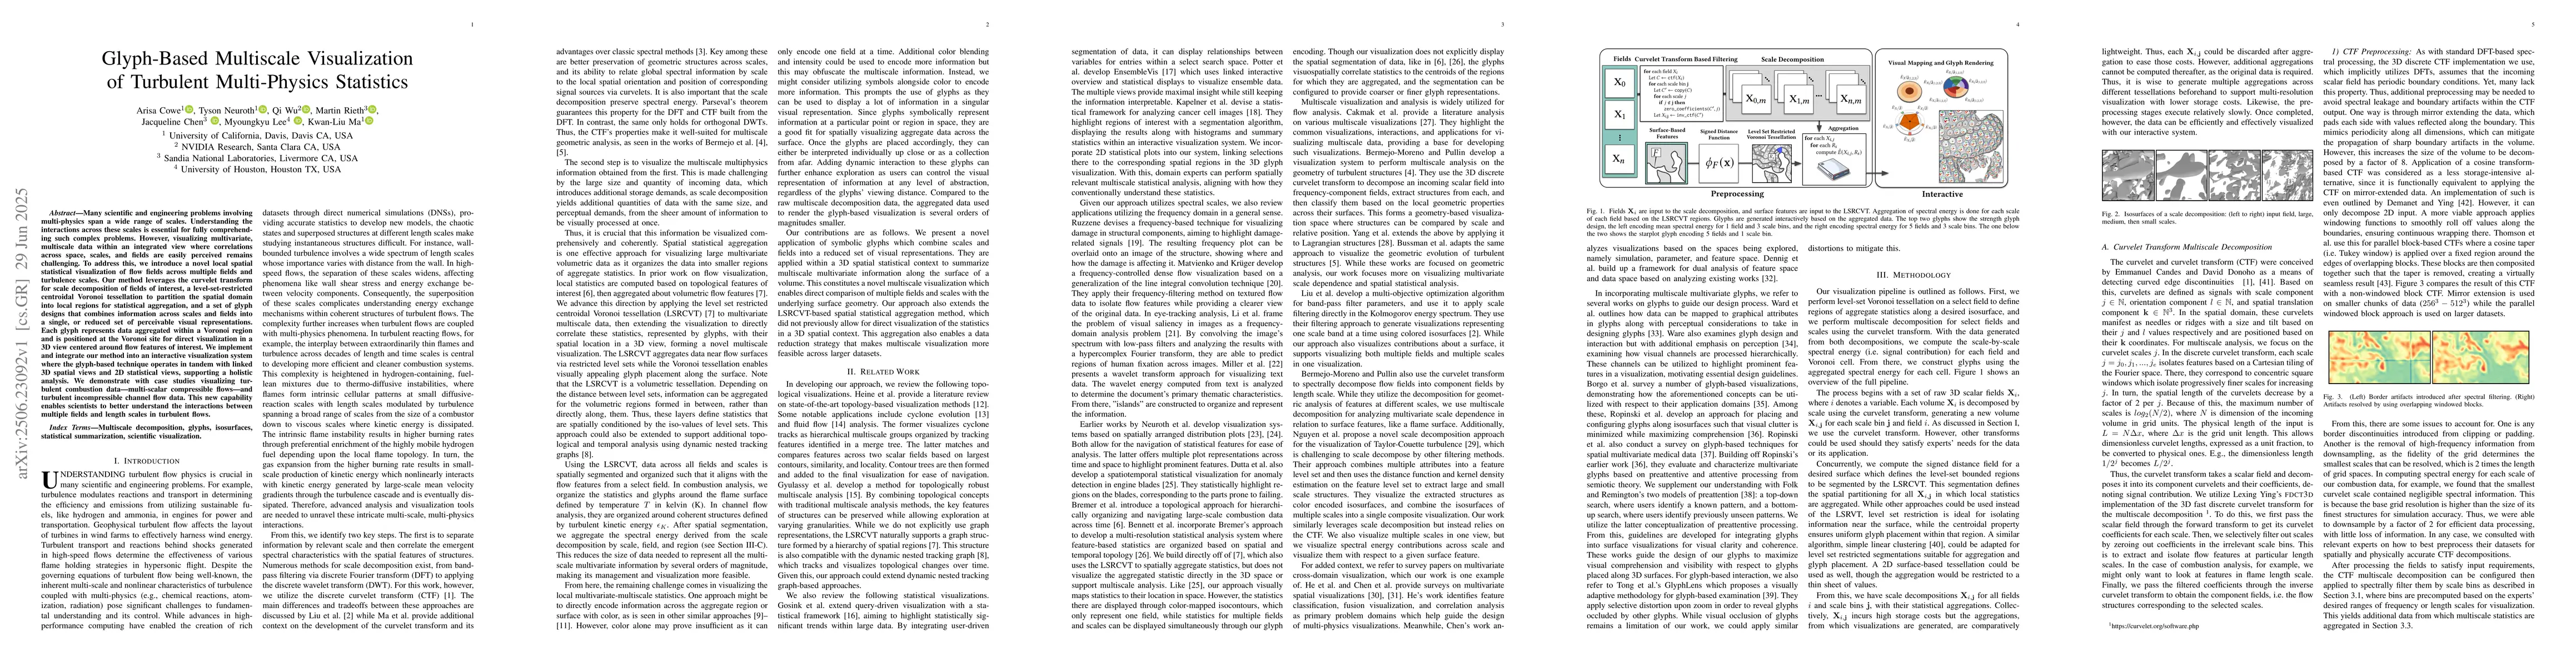
Many scientific and engineering problems involving multi-physics span a wide range of scales. Understanding the interactions across these scales is essential for fully comprehending such complex probl...
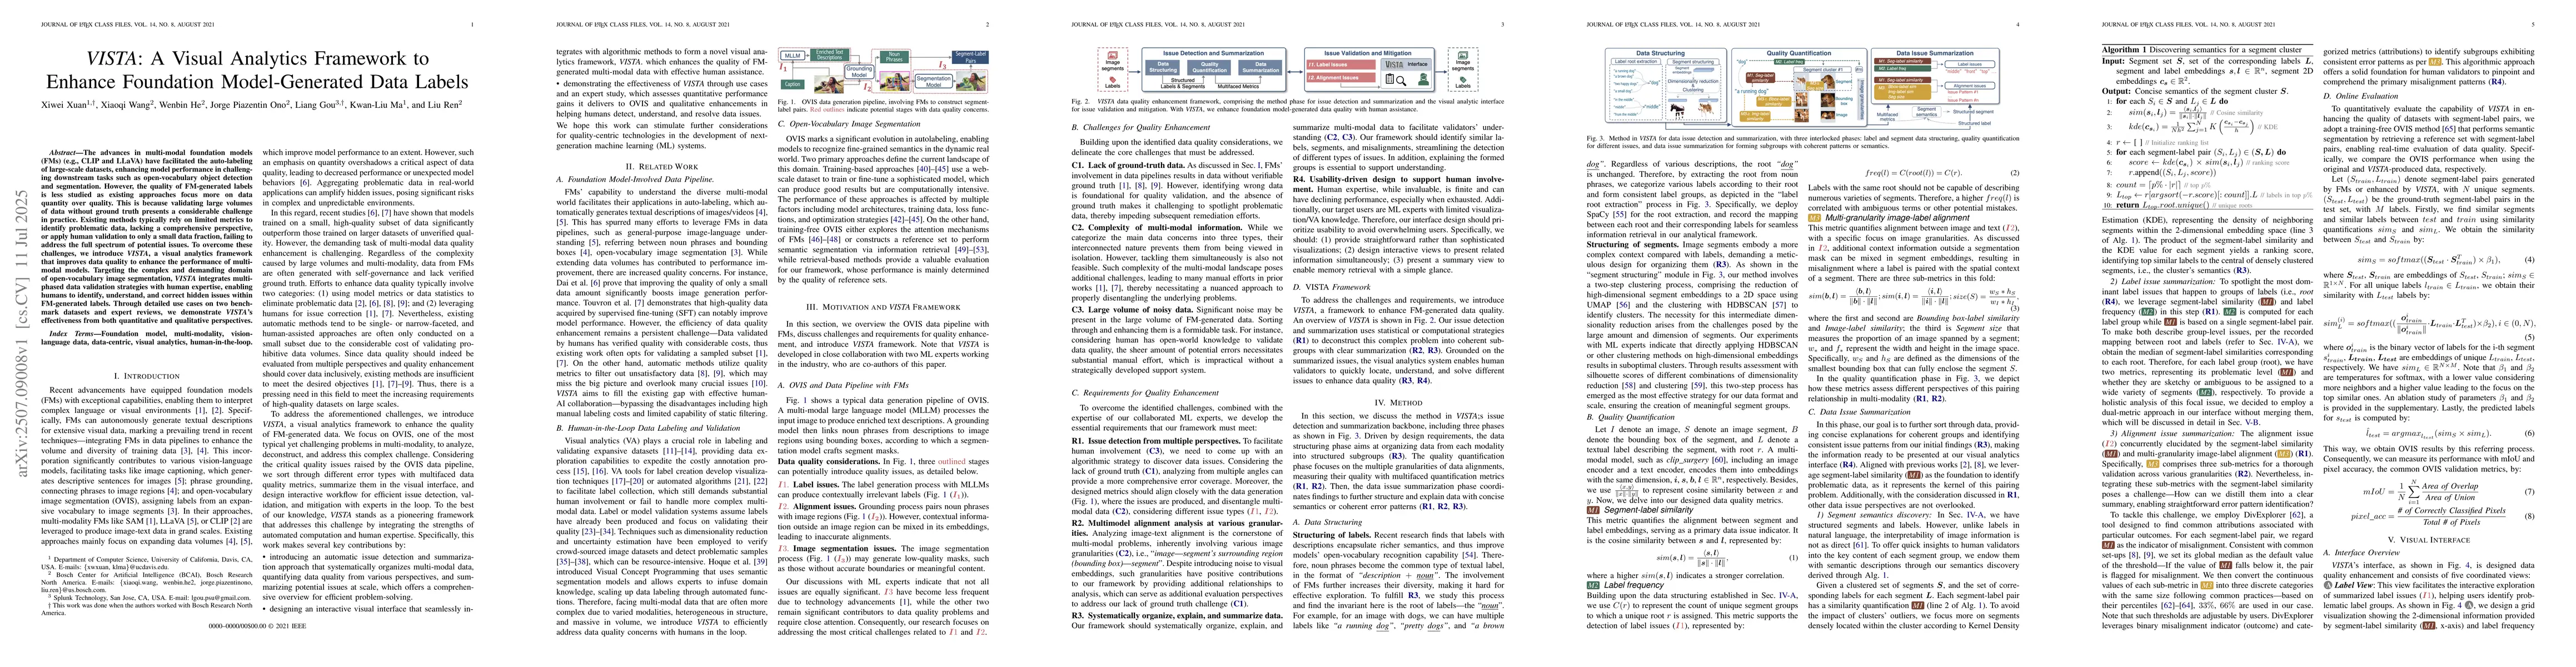
The advances in multi-modal foundation models (FMs) (e.g., CLIP and LLaVA) have facilitated the auto-labeling of large-scale datasets, enhancing model performance in challenging downstream tasks such ...
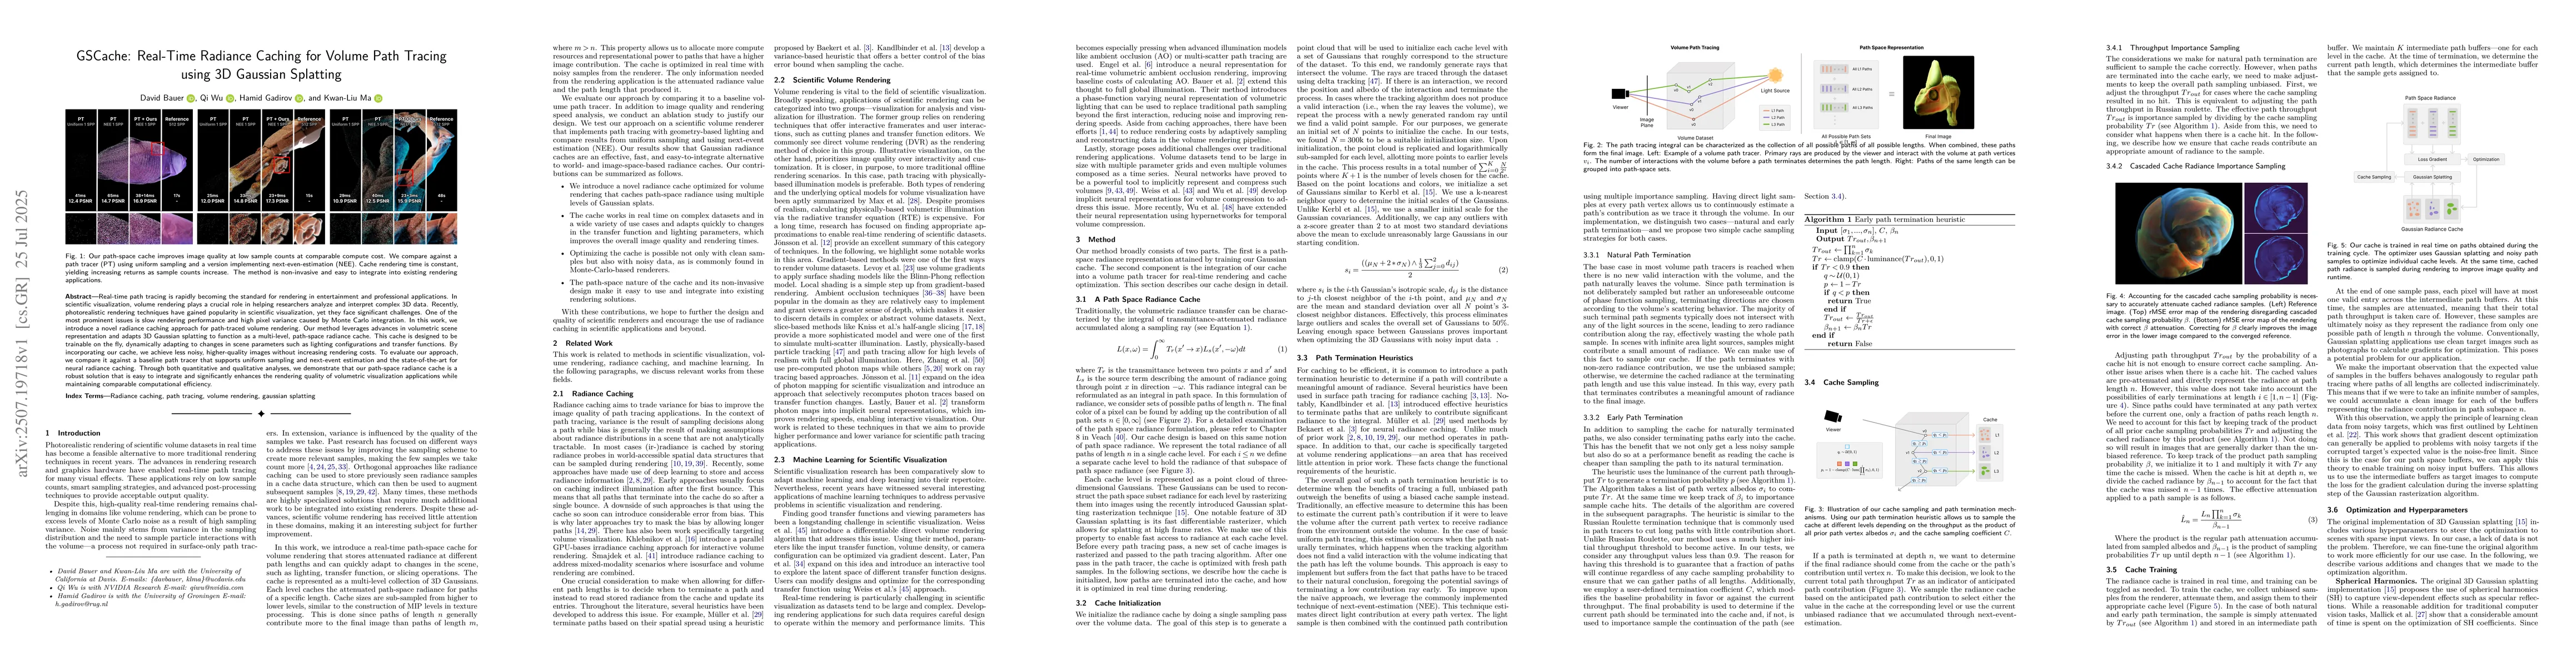
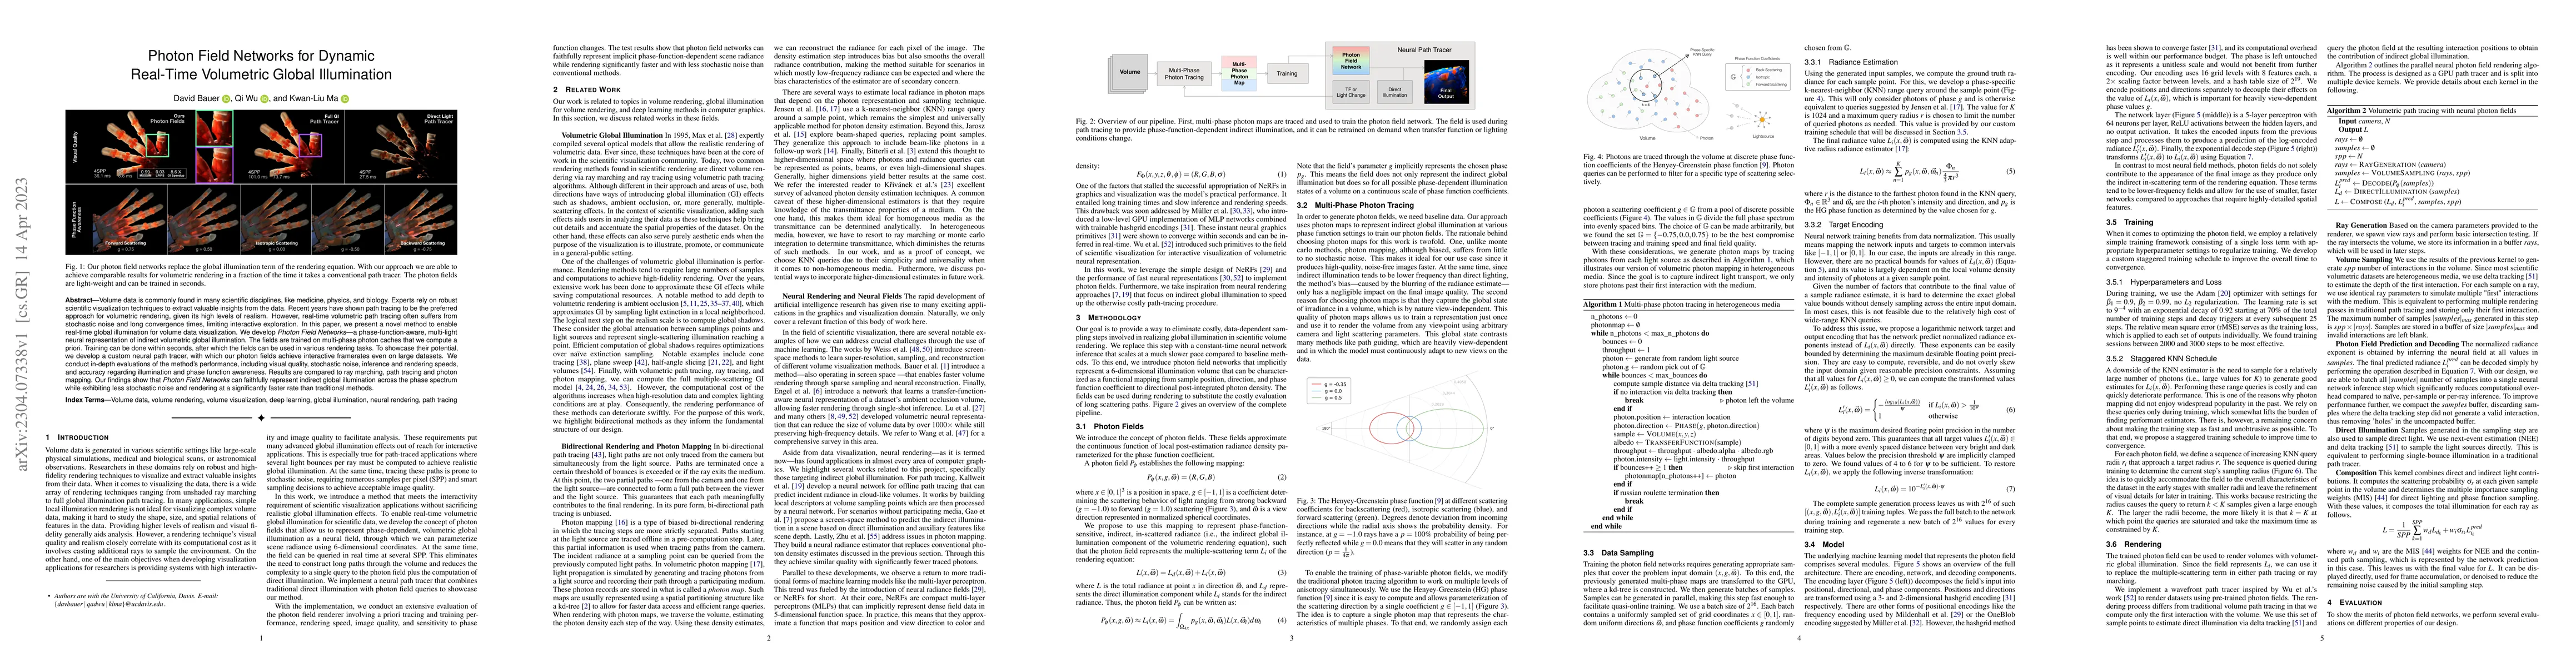
Real-time path tracing is rapidly becoming the standard for rendering in entertainment and professional applications. In scientific visualization, volume rendering plays a crucial role in helping rese...
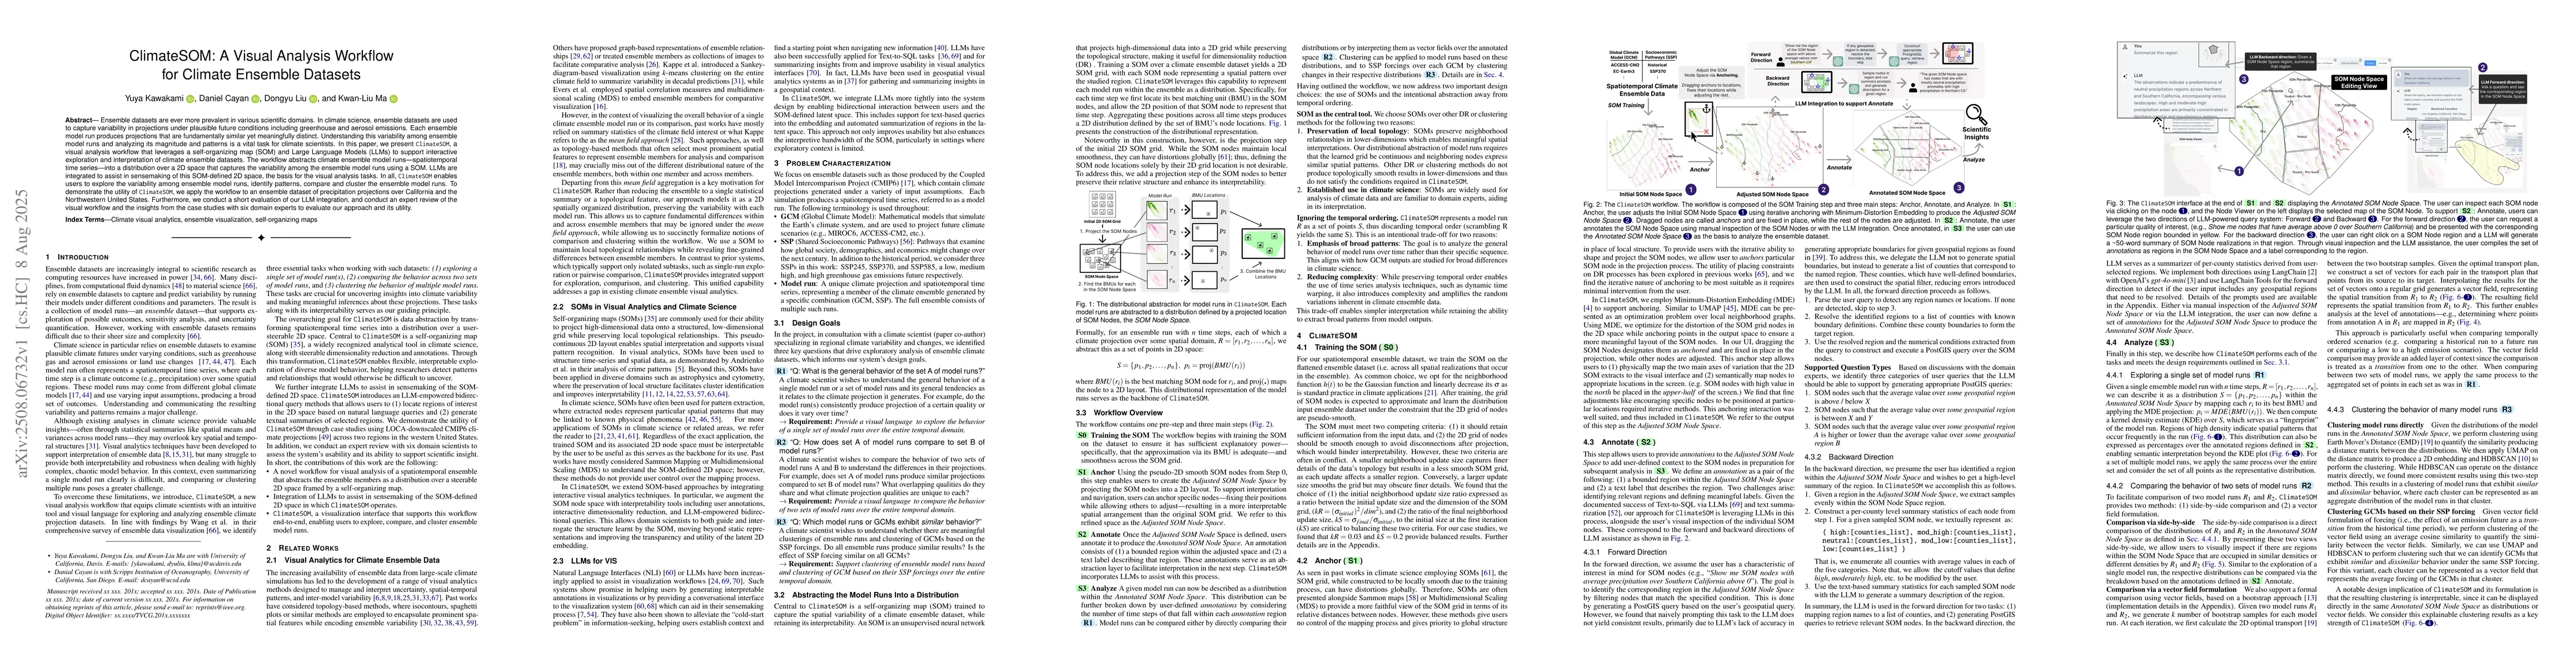
Ensemble datasets are ever more prevalent in various scientific domains. In climate science, ensemble datasets are used to capture variability in projections under plausible future conditions includin...
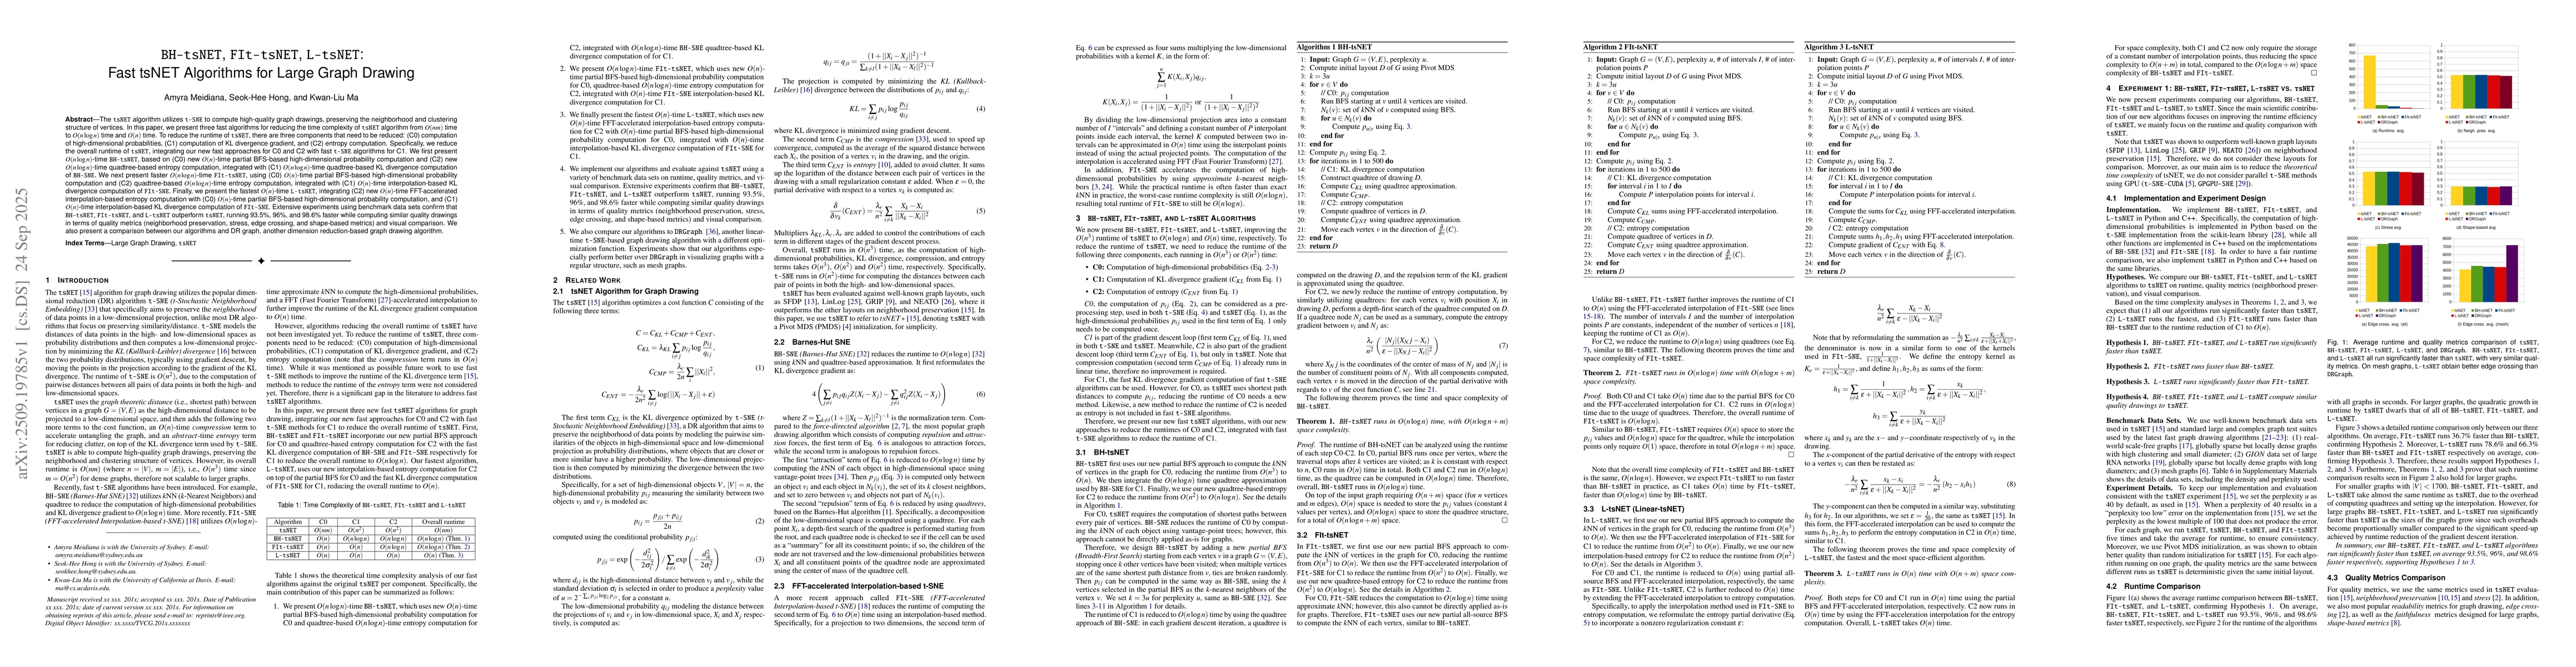
The tsNET algorithm utilizes t-SNE to compute high-quality graph drawings, preserving the neighborhood and clustering structure. We present three fast algorithms for reducing the time complexity of ts...

Cancer treatment outcomes are influenced not only by clinical and demographic factors but also by the collaboration of healthcare teams. However, prior work has largely overlooked the potential role o...
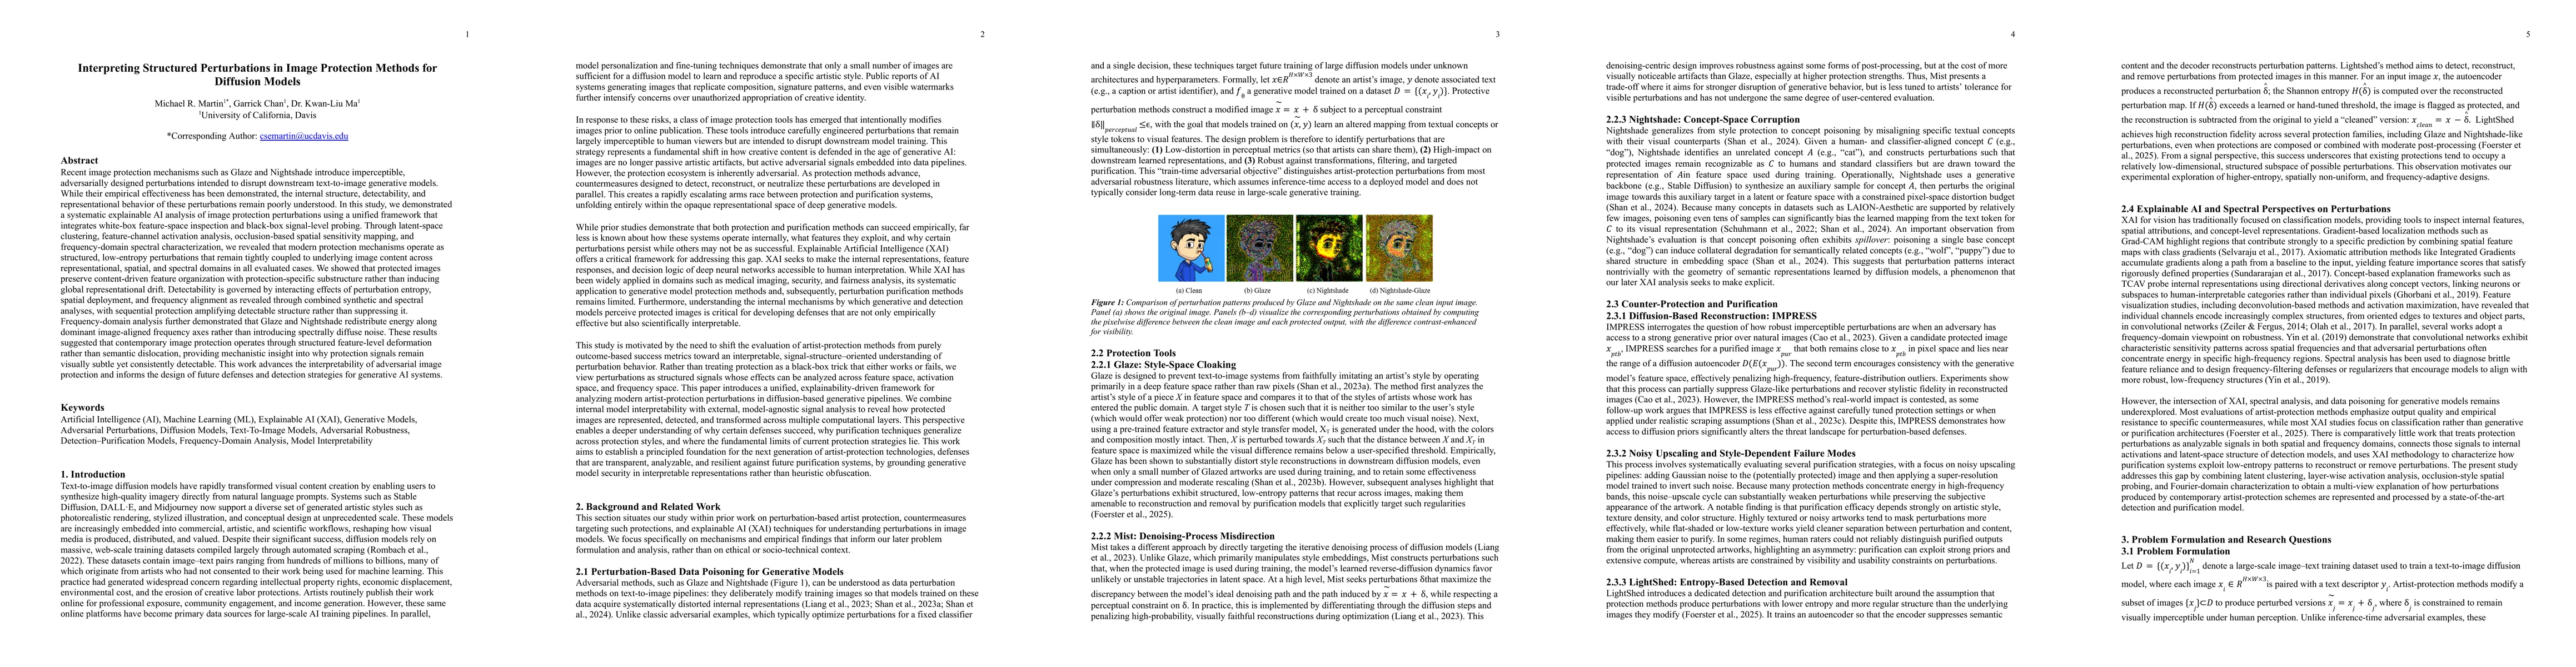
Recent image protection mechanisms such as Glaze and Nightshade introduce imperceptible, adversarially designed perturbations intended to disrupt downstream text-to-image generative models. While thei...
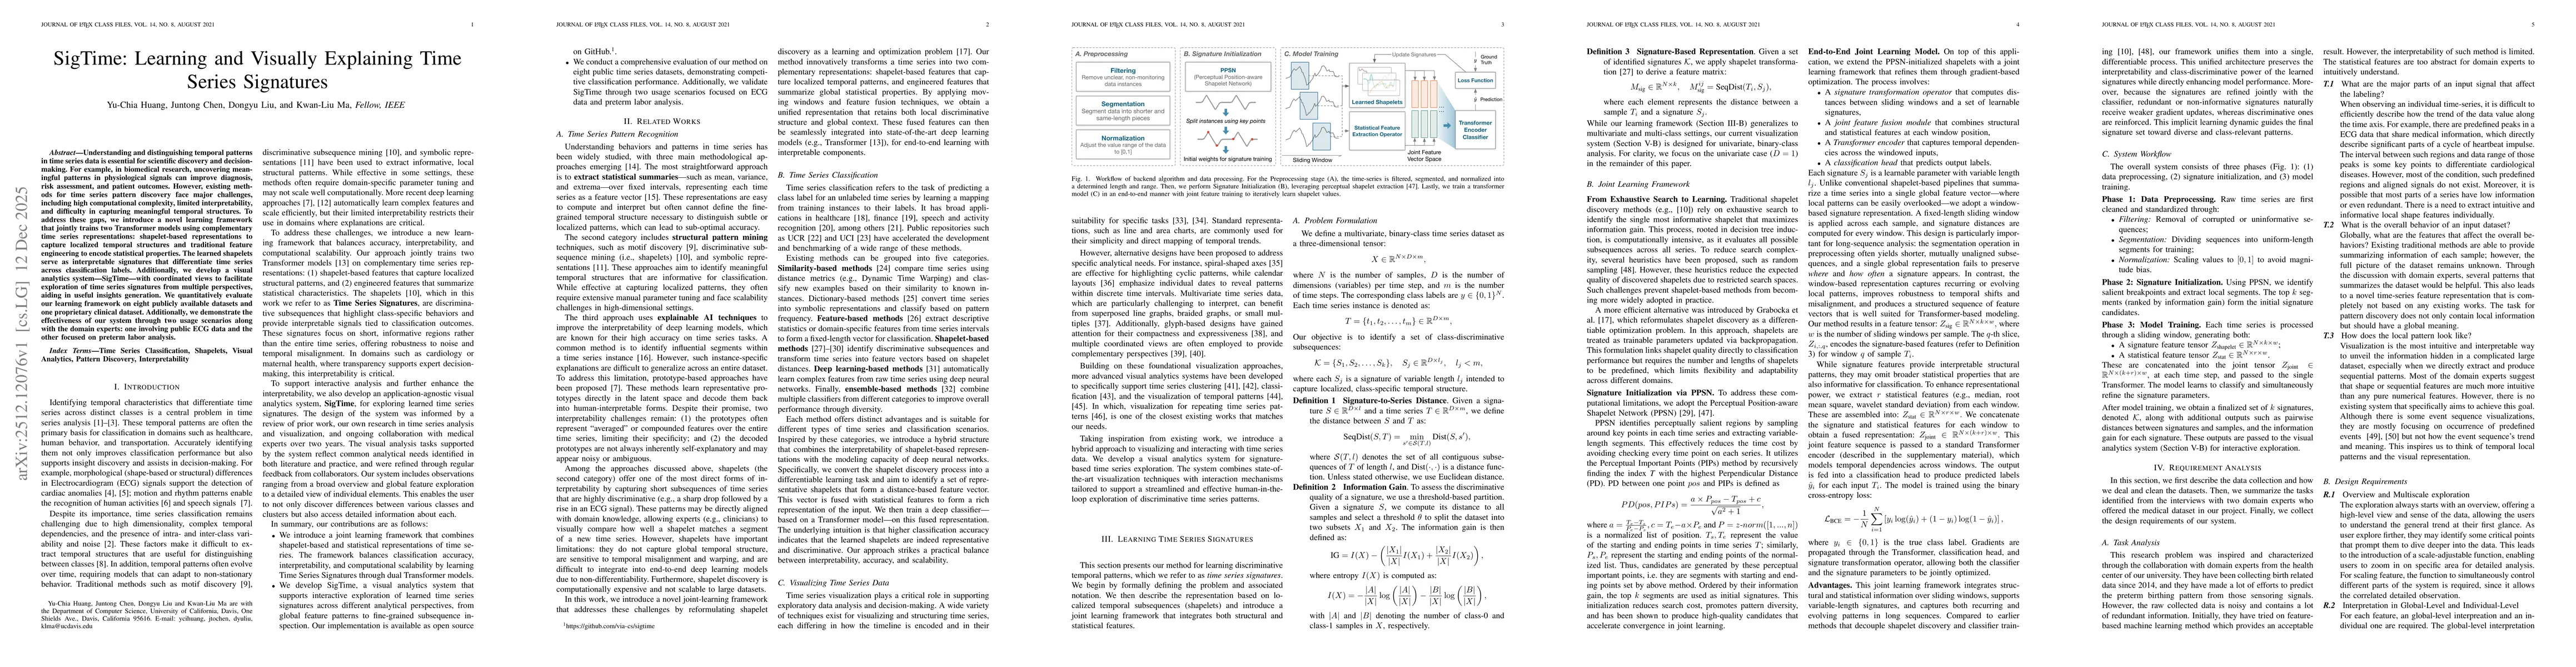
Understanding and distinguishing temporal patterns in time series data is essential for scientific discovery and decision-making. For example, in biomedical research, uncovering meaningful patterns in...
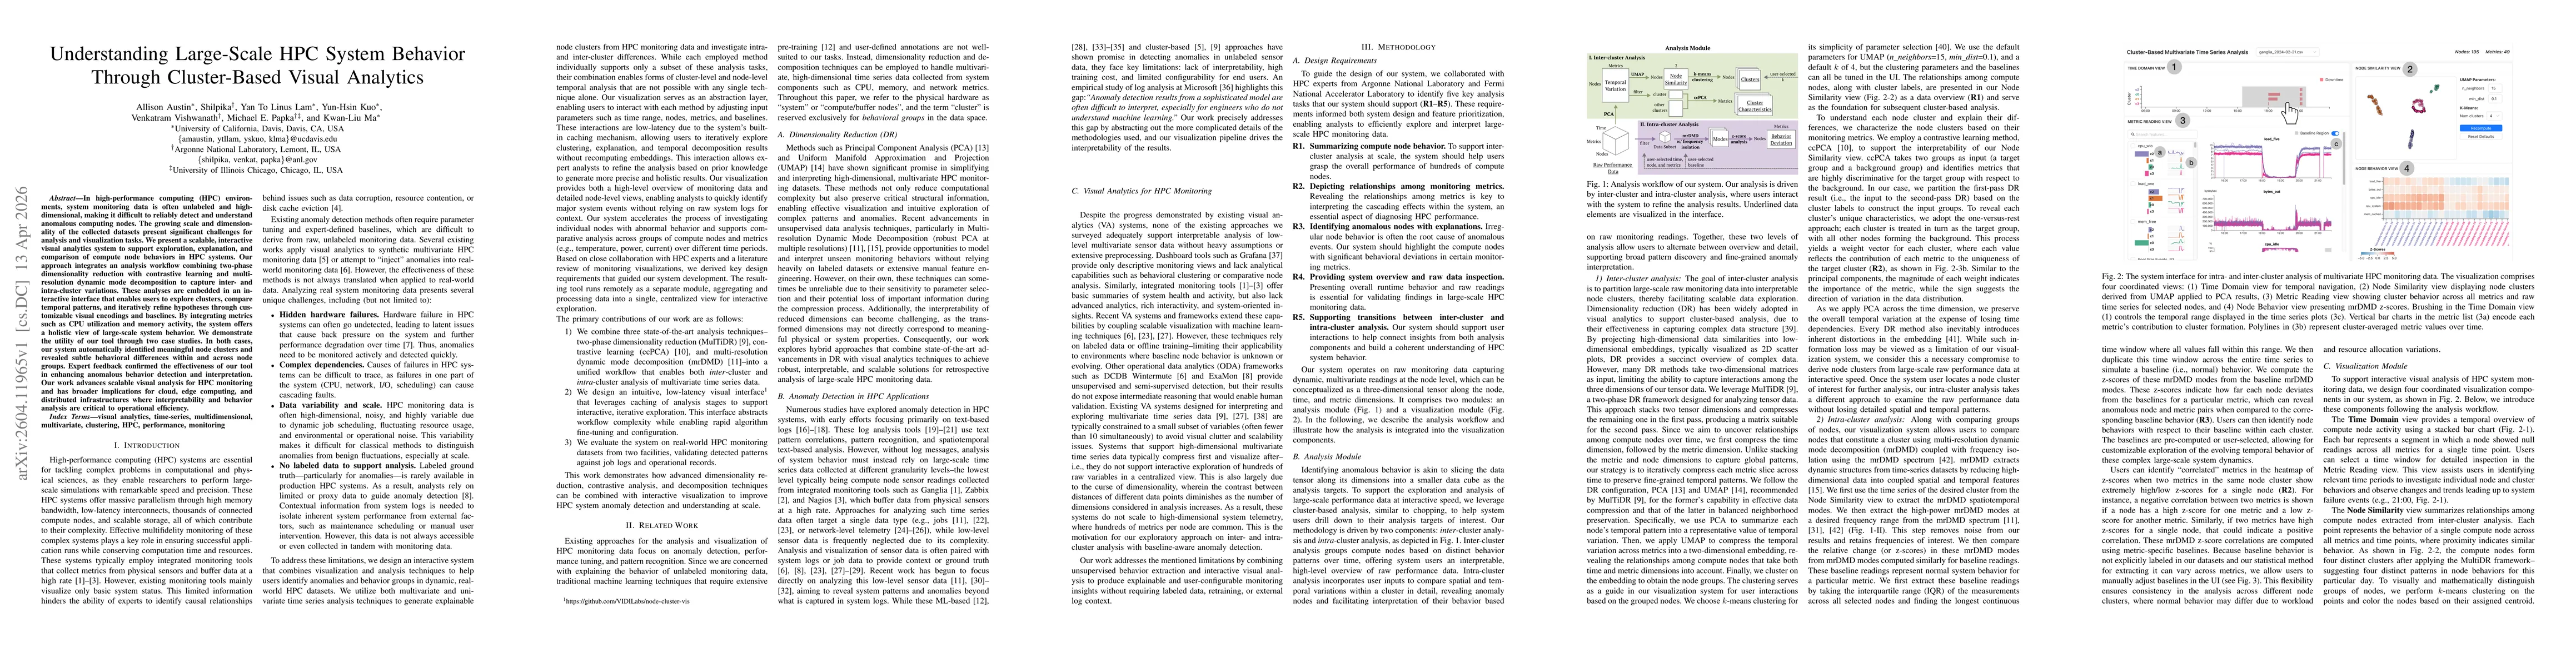
In high-performance computing (HPC) environments, system monitoring data is often unlabeled and high-dimensional, making it difficult to reliably detect and understand anomalous computing nodes. The g...
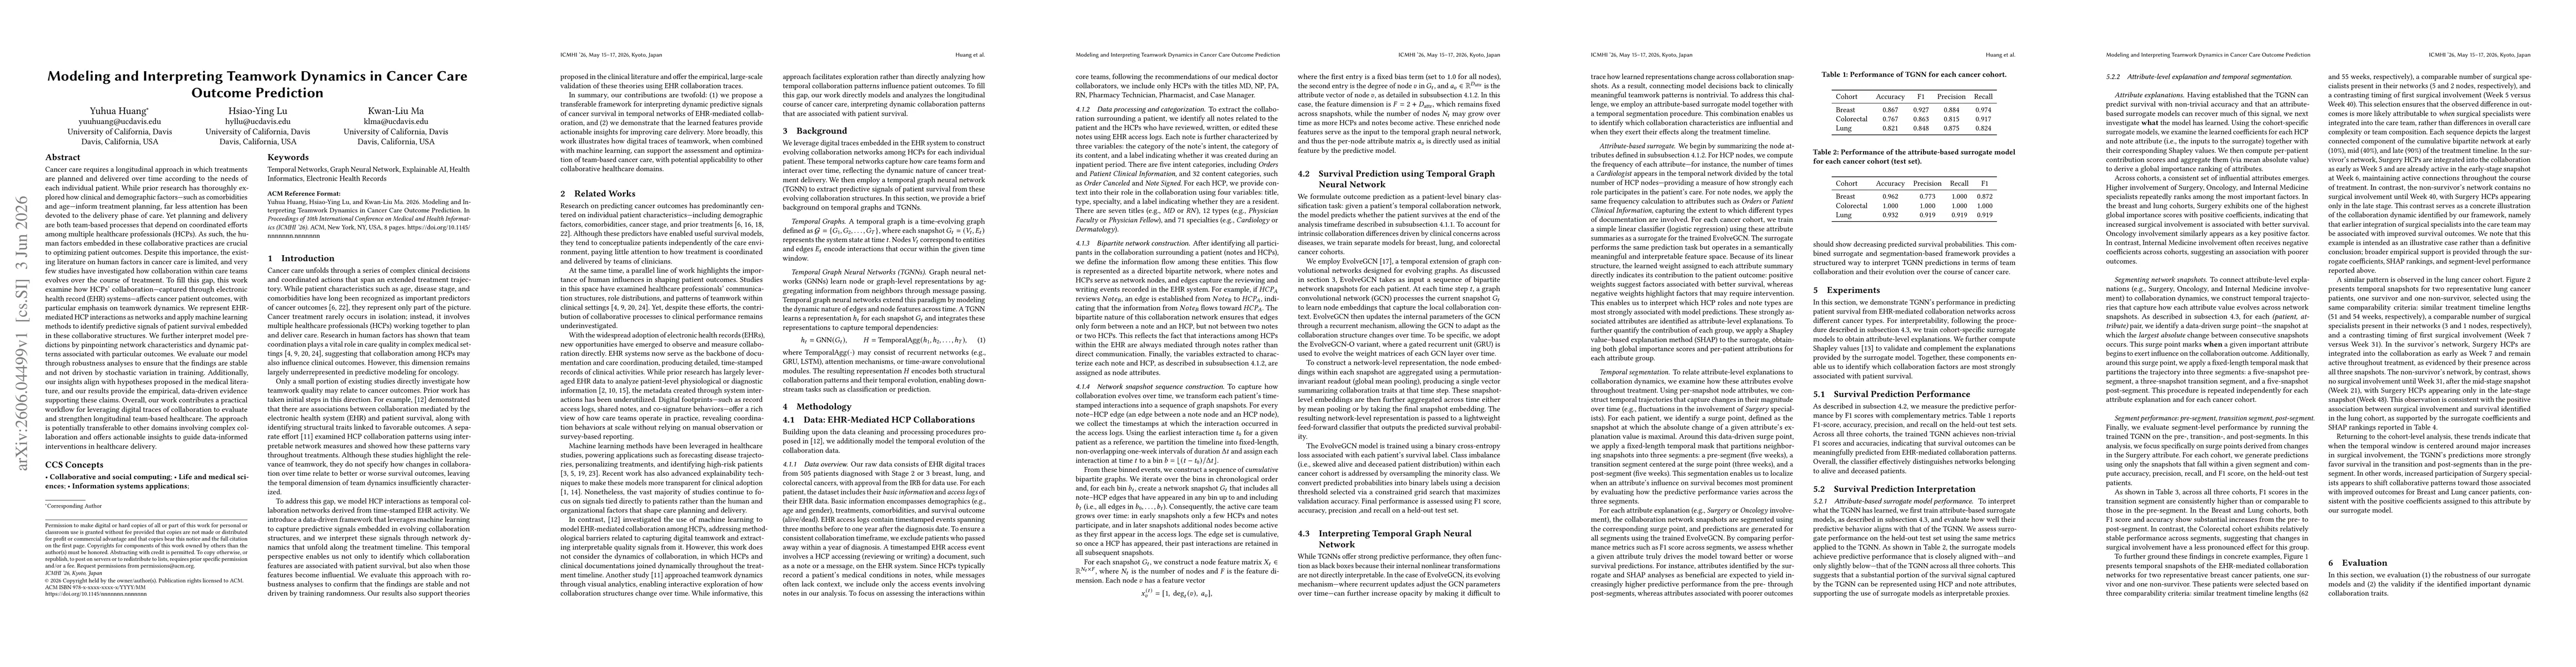
Cancer care requires a longitudinal approach in which treatments are planned and delivered over time according to the needs of each individual patient. While prior research has thoroughly explored how...
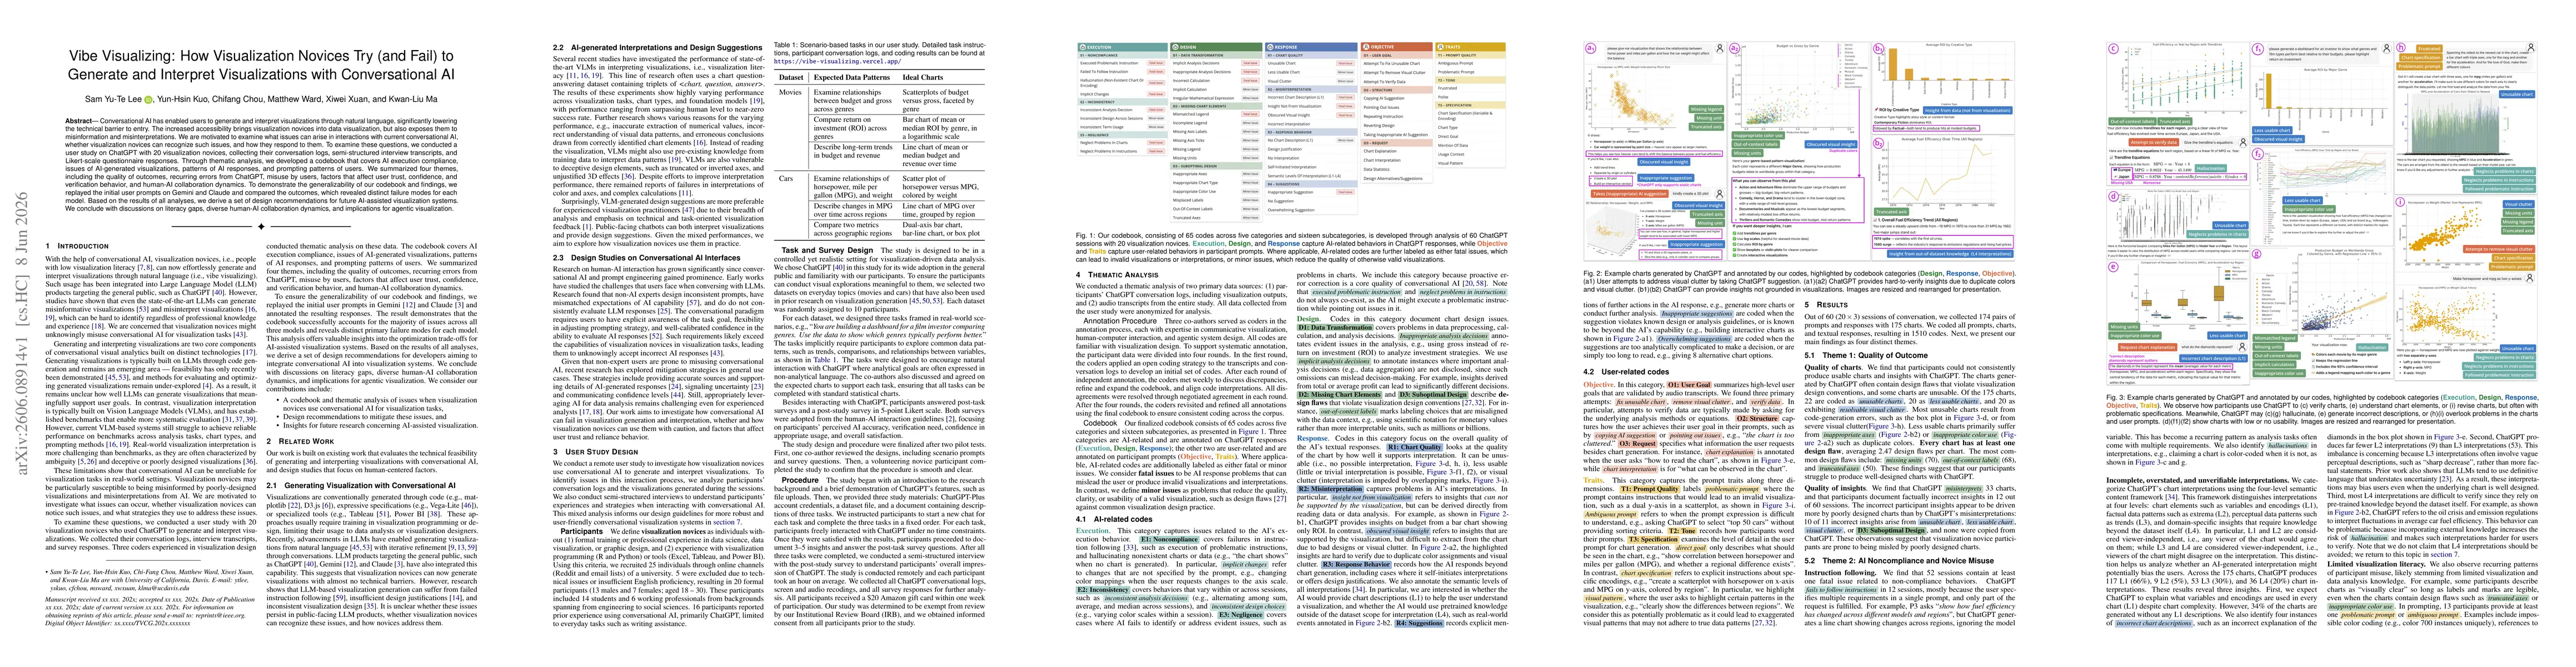
Conversational AI has enabled users to generate and interpret visualizations through natural language, significantly lowering the technical barrier to entry. The increased accessibility brings visuali...

Graph Retrieval-Augmented Generation (GraphRAG) enables Large Language Models (LLMs) to leverage structured, domain-specific knowledge graph databases for factually grounded responses. However, the re...