A Machine-Learning-Aided Visual Analysis Workflow for Investigating Air Pollution Data
Publication
Metrics
AI Quick Summary
This paper introduces a machine-learning-aided visual analysis workflow for investigating air pollution data, employing dimensionality reduction and other methods to simplify complex spatial, temporal, and feature-based analyses. The developed visual analytic system enables flexible exploration of different analysis aspects, demonstrated through multiple use cases.
Paper Preview
Abstract
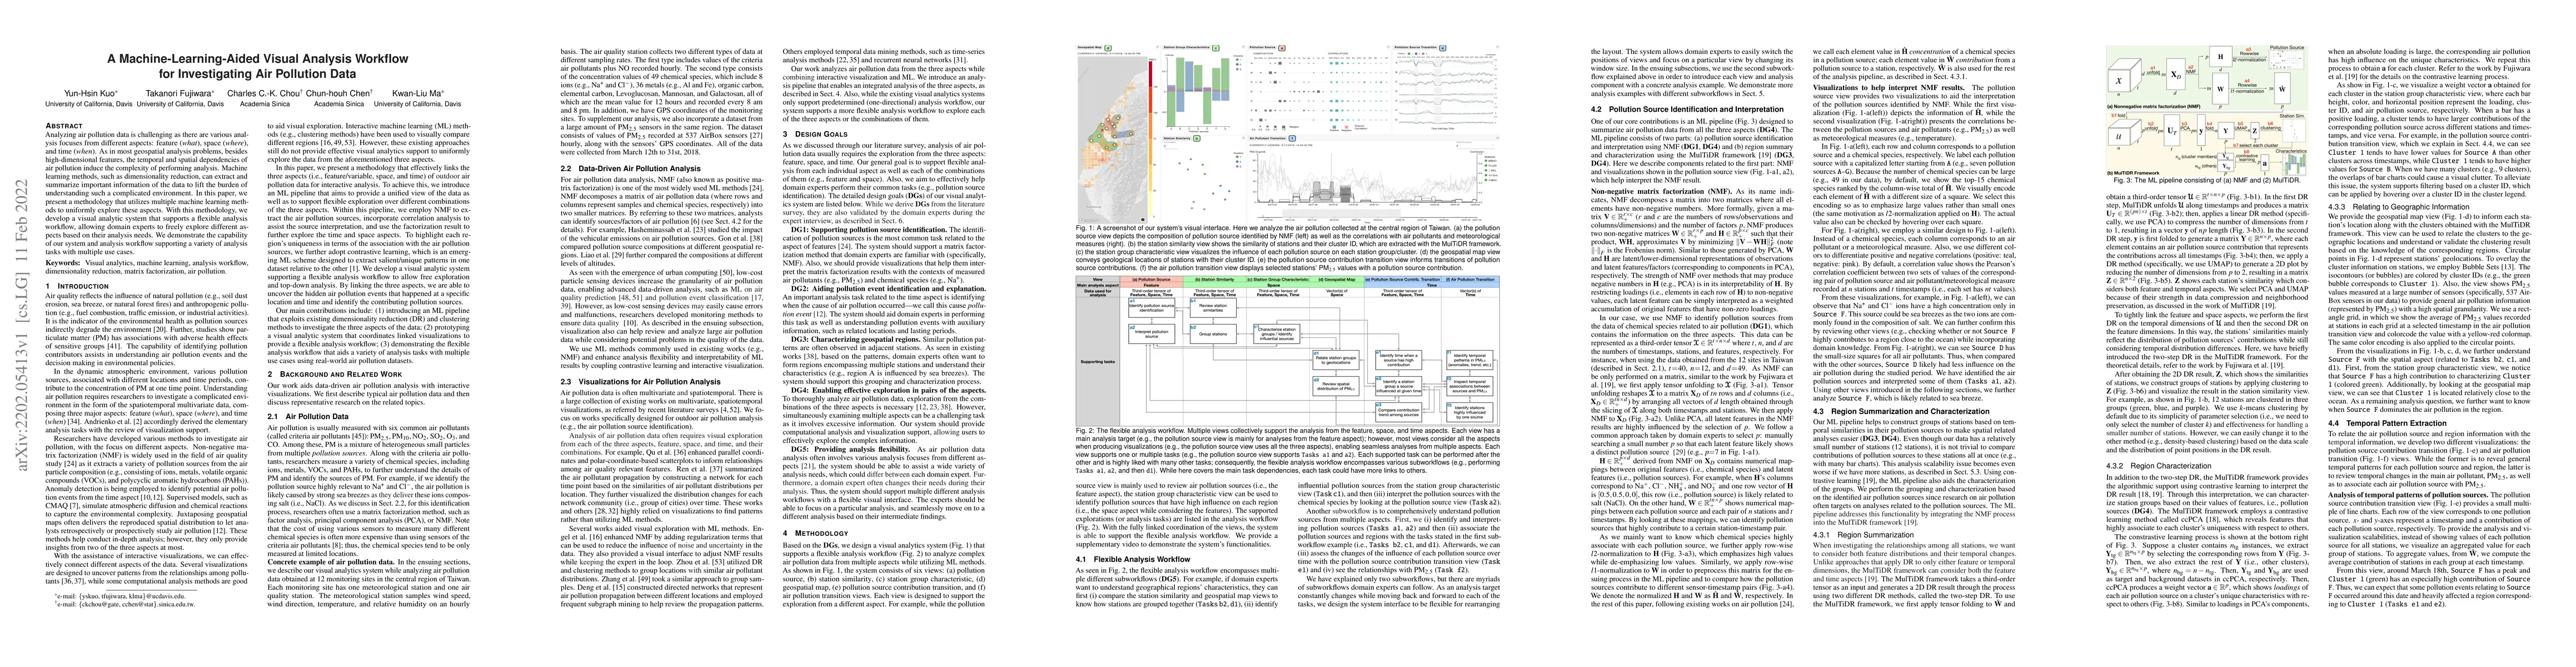
Analyzing air pollution data is challenging as there are various analysis focuses from different aspects: feature (what), space (where), and time (when). As in most geospatial analysis problems, besides high-dimensional features, the temporal and spatial dependencies of air pollution induce the complexity of performing analysis. Machine learning methods, such as dimensionality reduction, can extract and summarize important information of the data to lift the burden of understanding such a complicated environment. In this paper, we present a methodology that utilizes multiple machine learning methods to uniformly explore these aspects. With this methodology, we develop a visual analytic system that supports a flexible analysis workflow, allowing domain experts to freely explore different aspects based on their analysis needs. We demonstrate the capability of our system and analysis workflow supporting a variety of analysis tasks with multiple use cases.
AI Key Findings
Get AI-generated insights about this paper's methodology, results, significance, and more — seven facets brought into focus.
Impact
Paper Details
Authors
PDF Preview
Key Terms
Citation Network
Current paper (gray), citations (green), references (blue)
Display is limited for performance on very large graphs.
Discussion 0