Academic Profile
Statistics
Similar Authors
Papers on arXiv
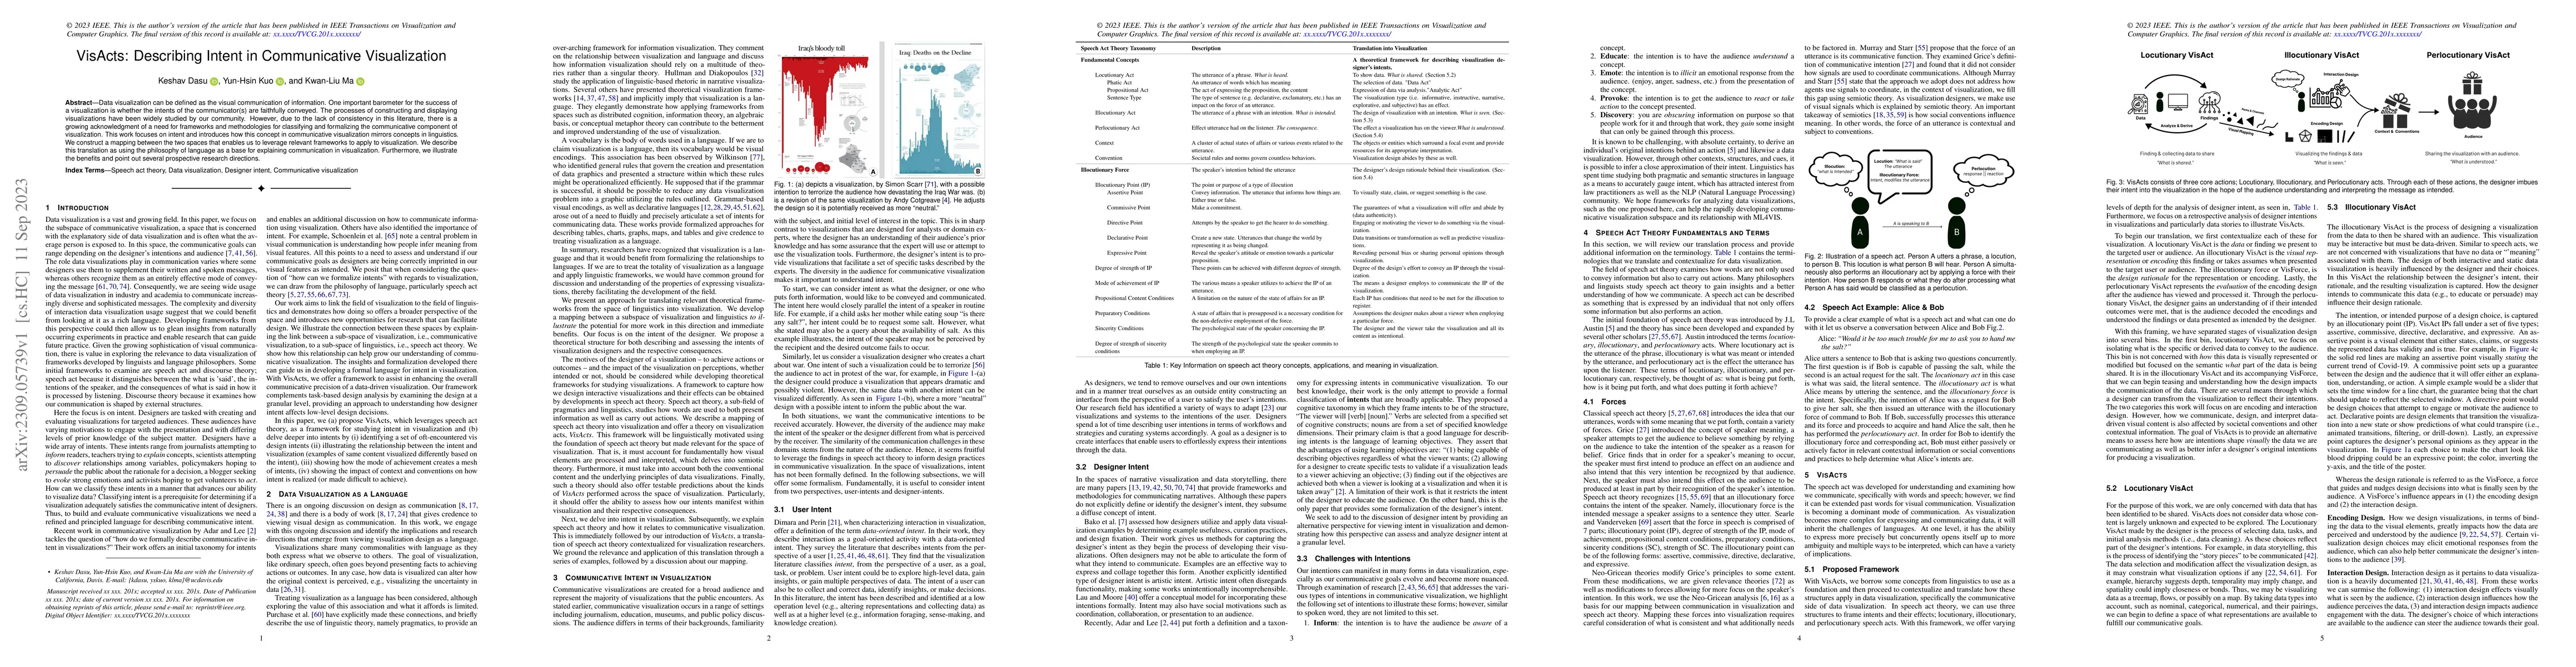
Data visualization can be defined as the visual communication of information. One important barometer for the success of a visualization is whether the intents of the communicator(s) are faithfully ...
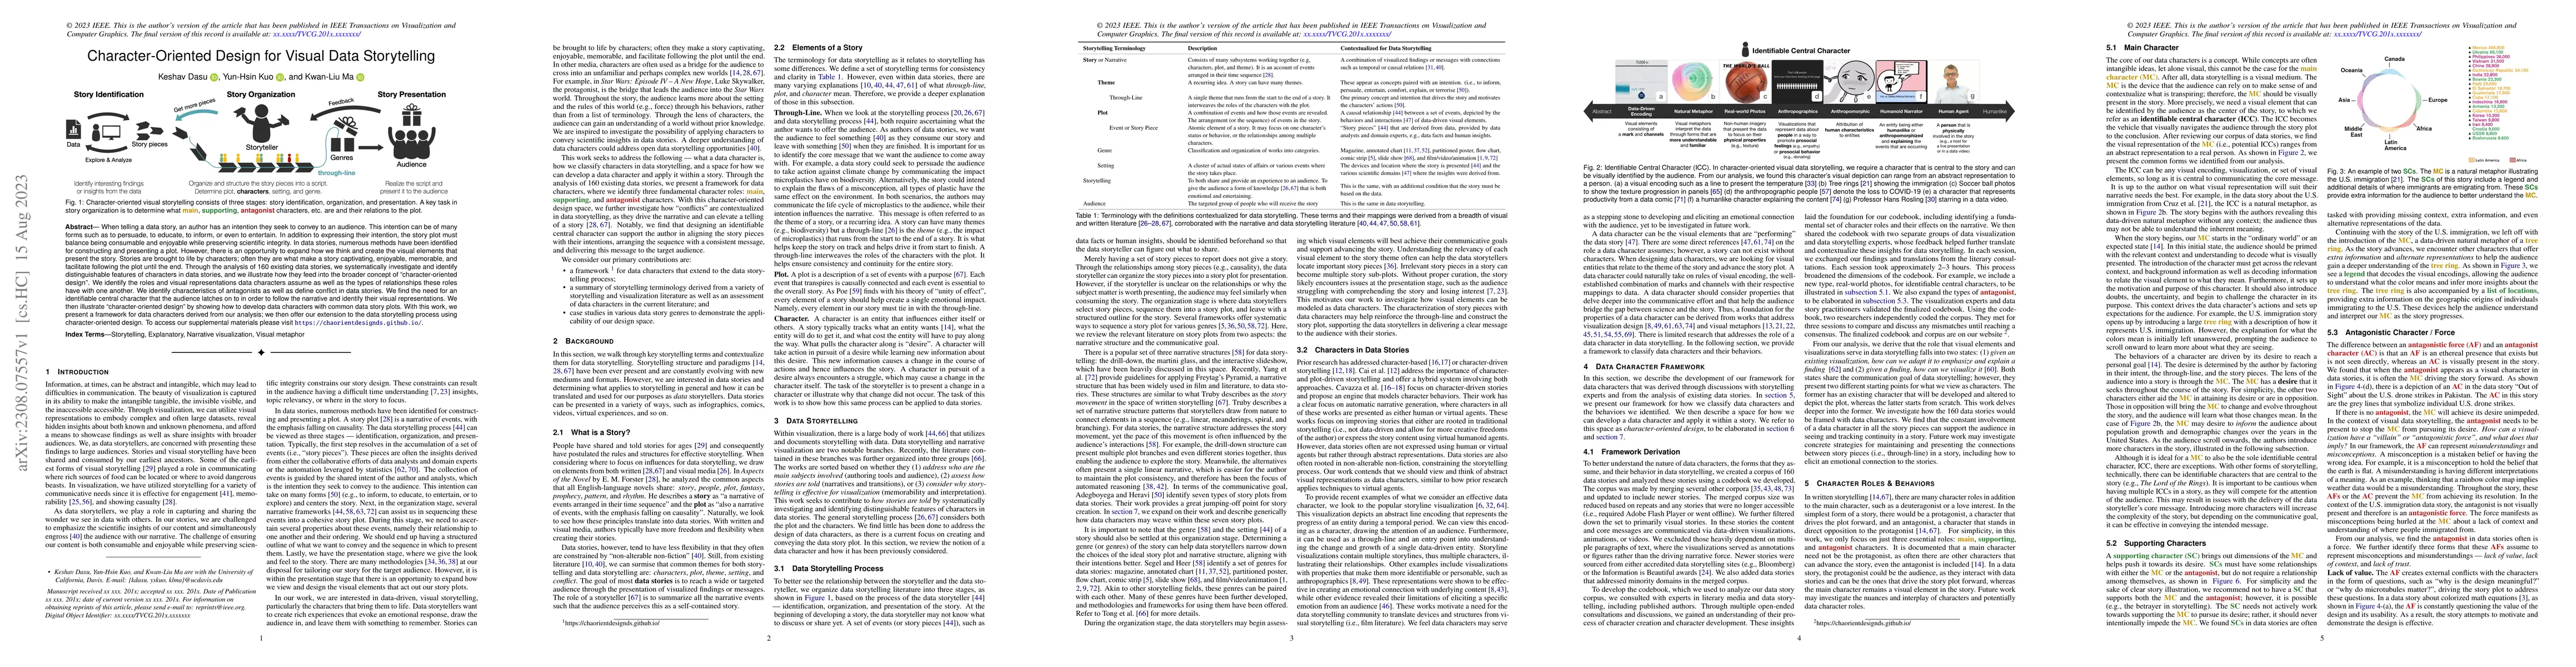
When telling a data story, an author has an intention they seek to convey to an audience. This intention can be of many forms such as to persuade, to educate, to inform, or even to entertain. In add...
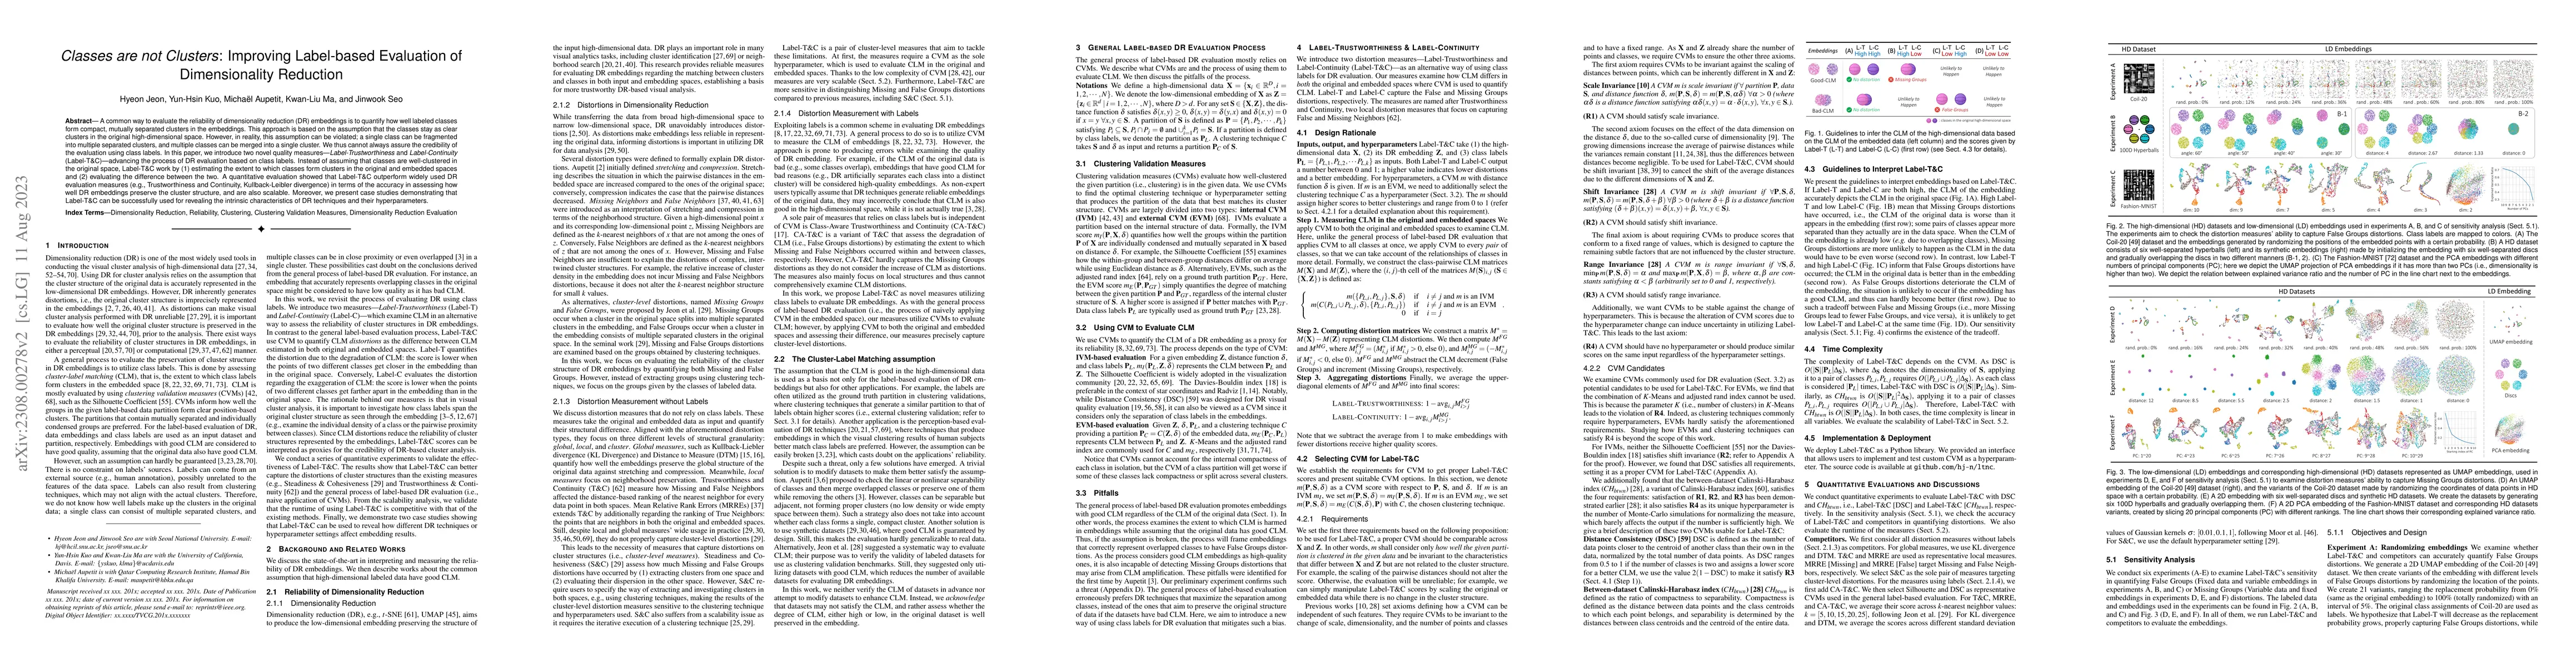
A common way to evaluate the reliability of dimensionality reduction (DR) embeddings is to quantify how well labeled classes form compact, mutually separated clusters in the embeddings. This approac...
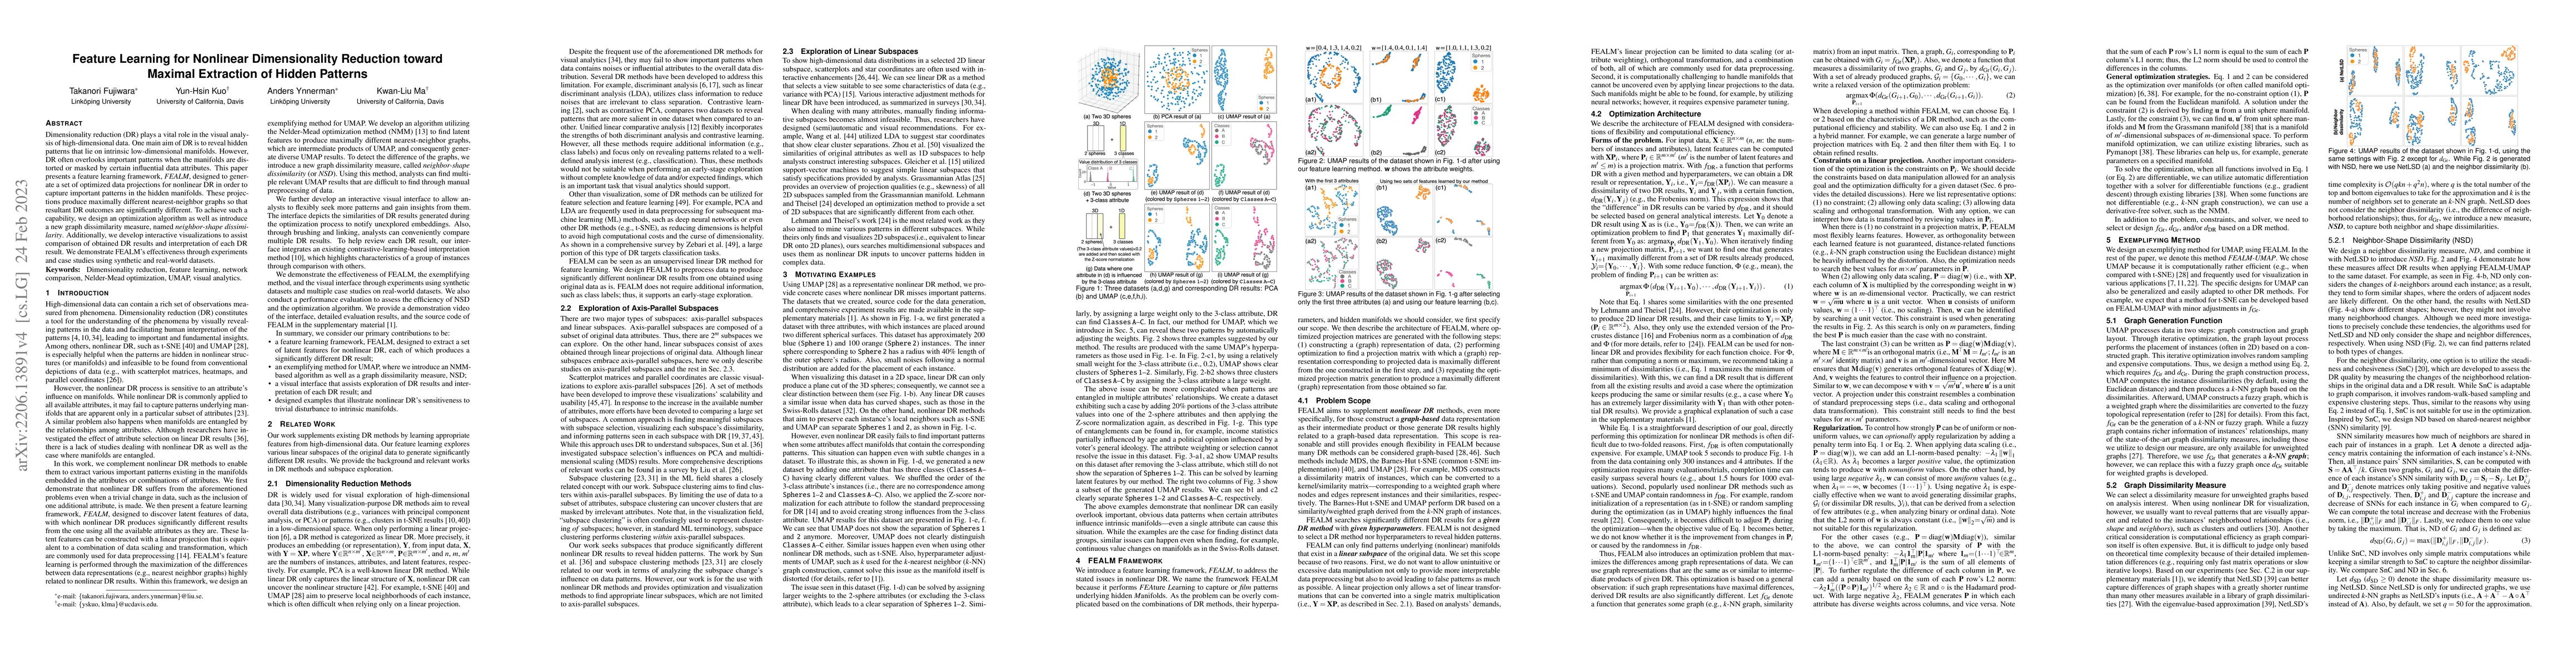
Dimensionality reduction (DR) plays a vital role in the visual analysis of high-dimensional data. One main aim of DR is to reveal hidden patterns that lie on intrinsic low-dimensional manifolds. How...
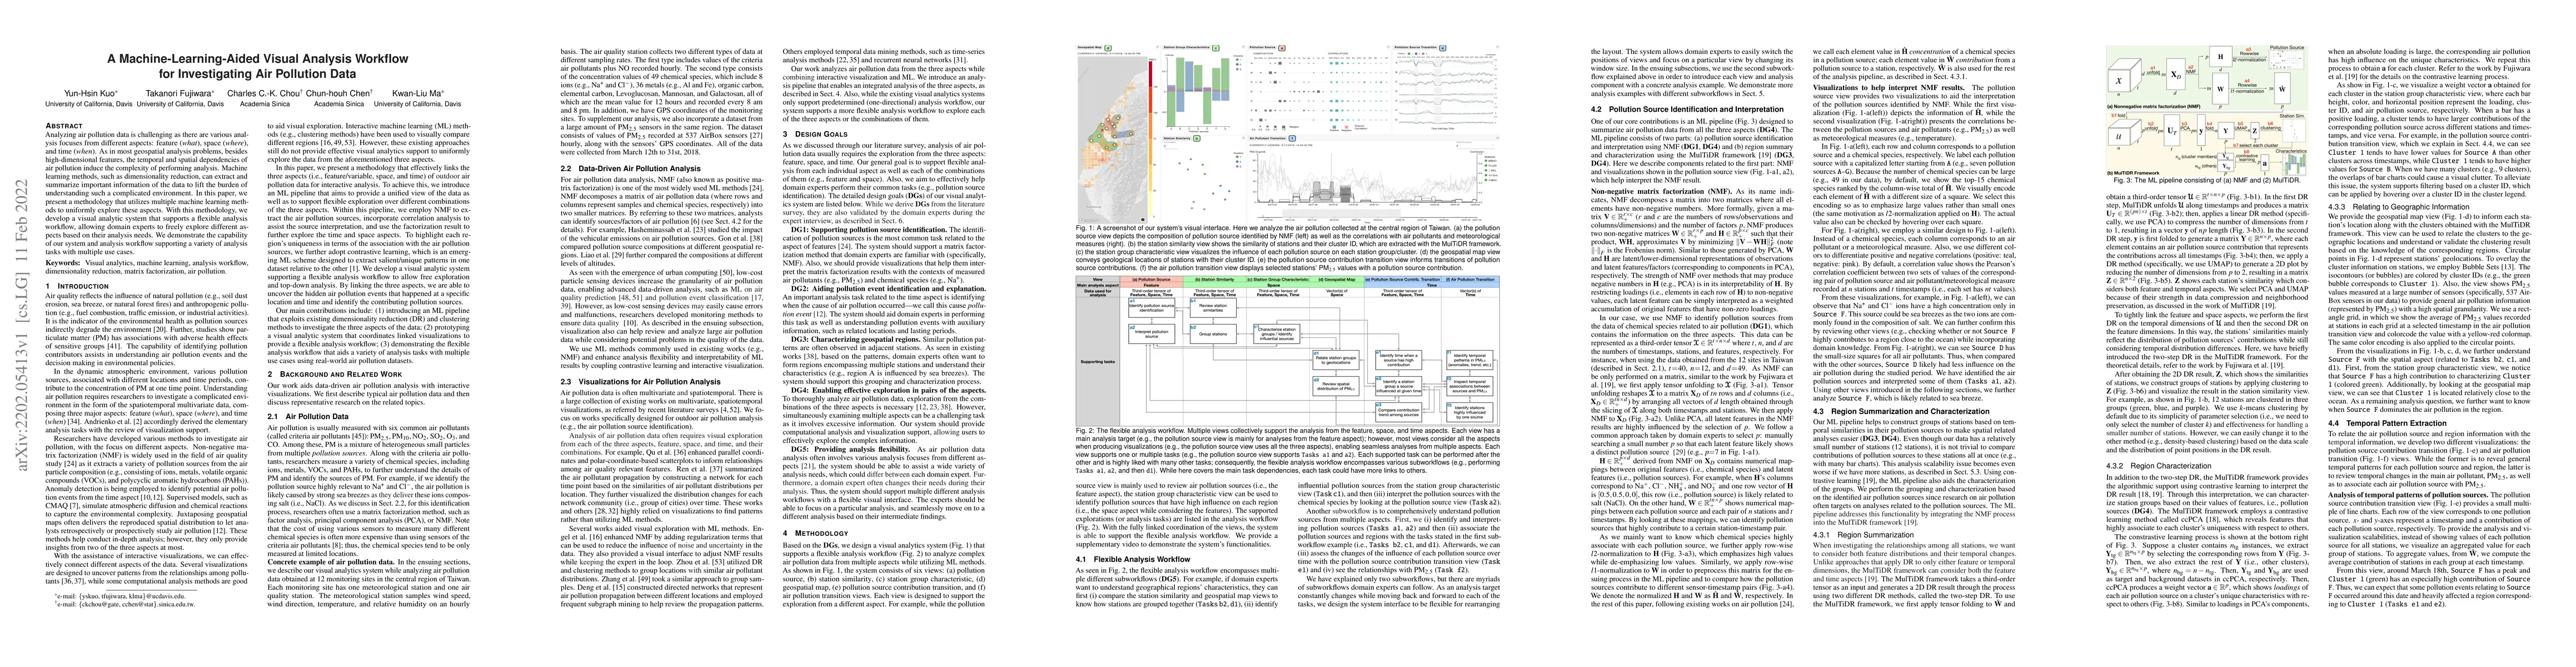
Analyzing air pollution data is challenging as there are various analysis focuses from different aspects: feature (what), space (where), and time (when). As in most geospatial analysis problems, bes...
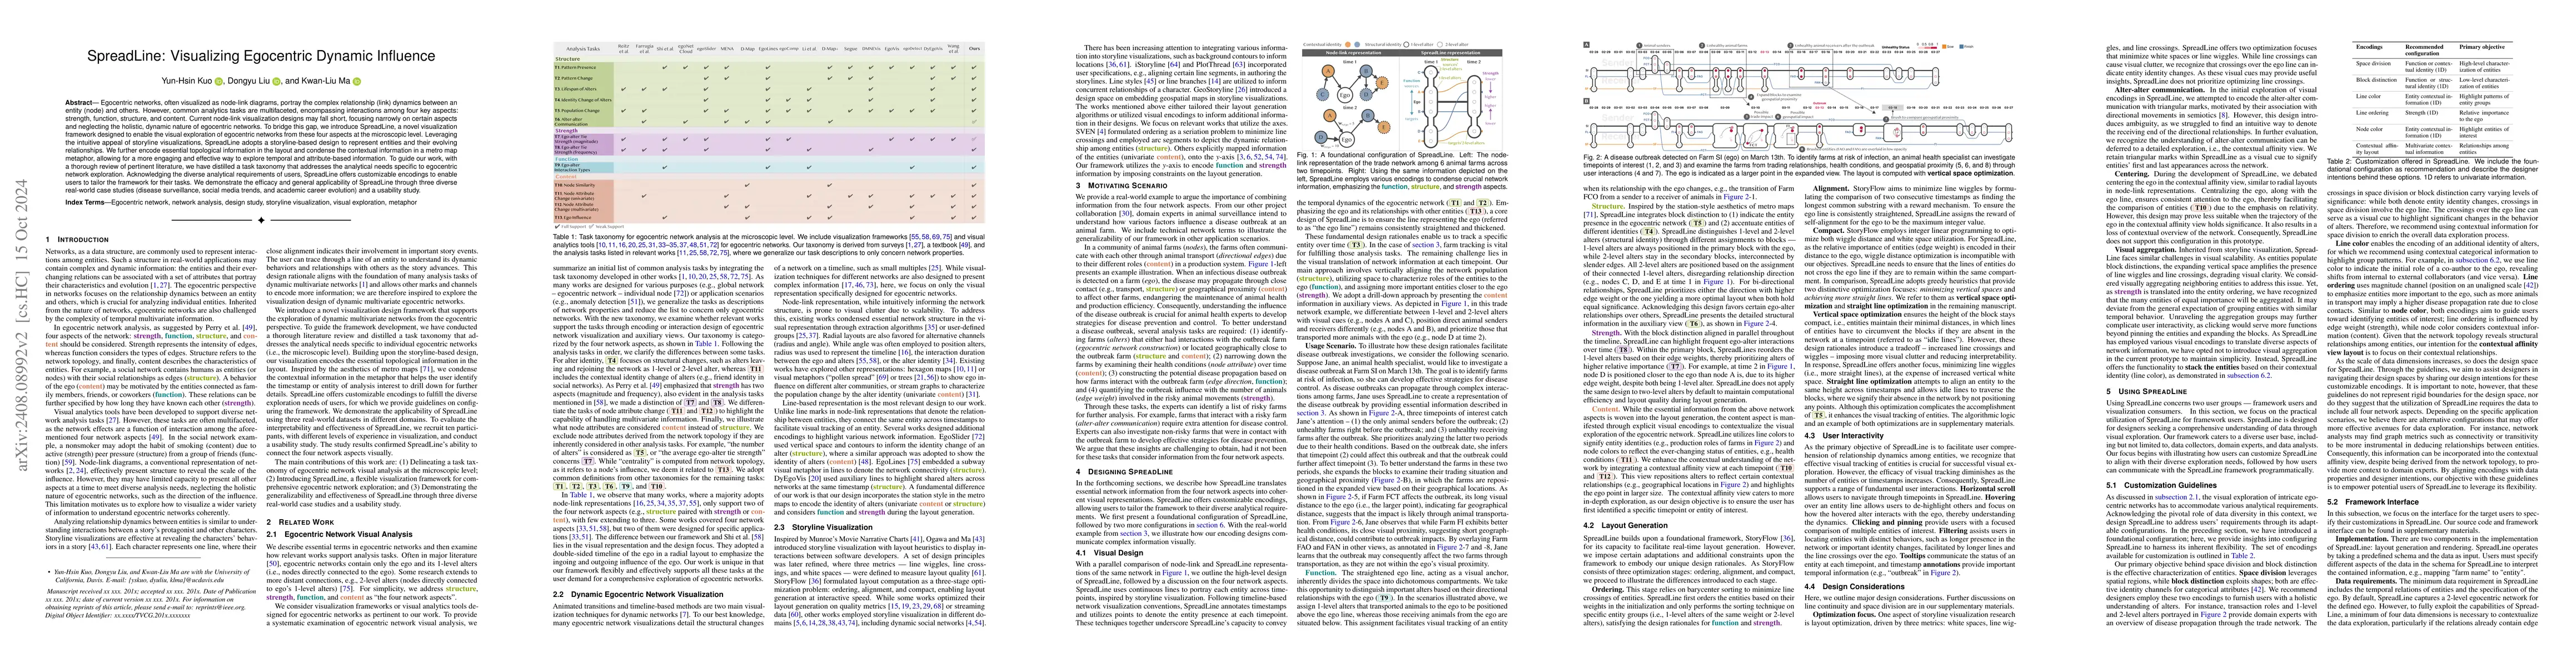
Egocentric networks, often visualized as node-link diagrams, portray the complex relationship (link) dynamics between an entity (node) and others. However, common analytics tasks are multifaceted, enc...
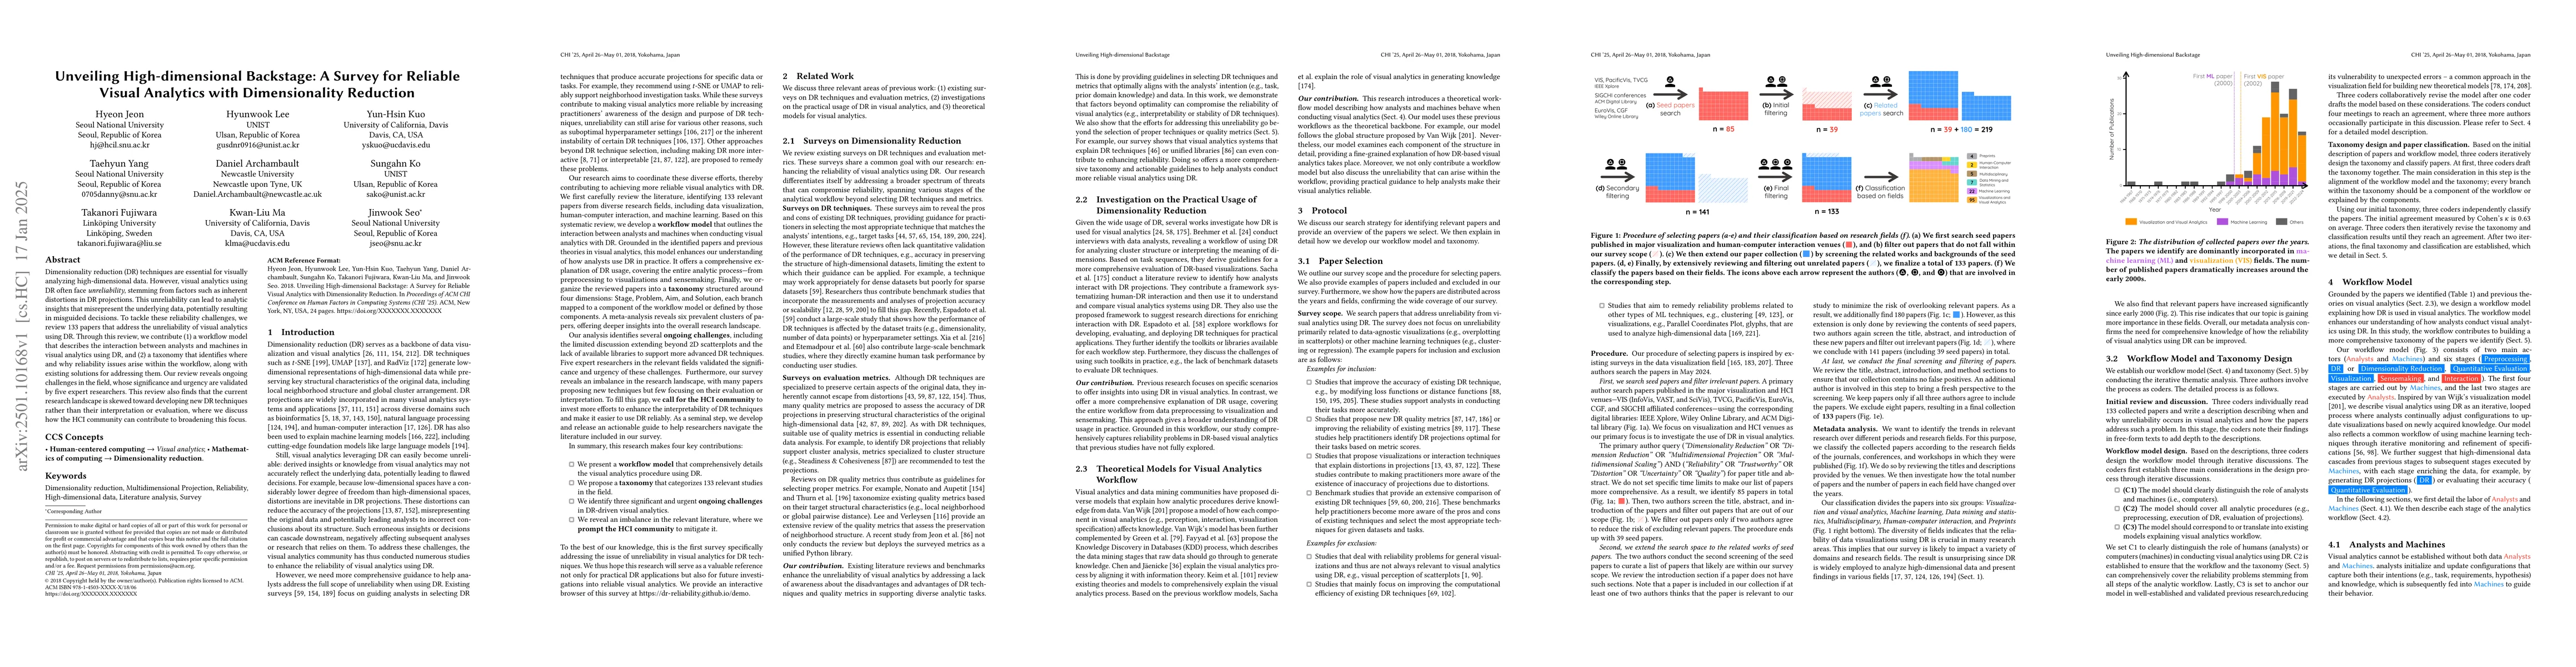
Dimensionality reduction (DR) techniques are essential for visually analyzing high-dimensional data. However, visual analytics using DR often face unreliability, stemming from factors such as inherent...
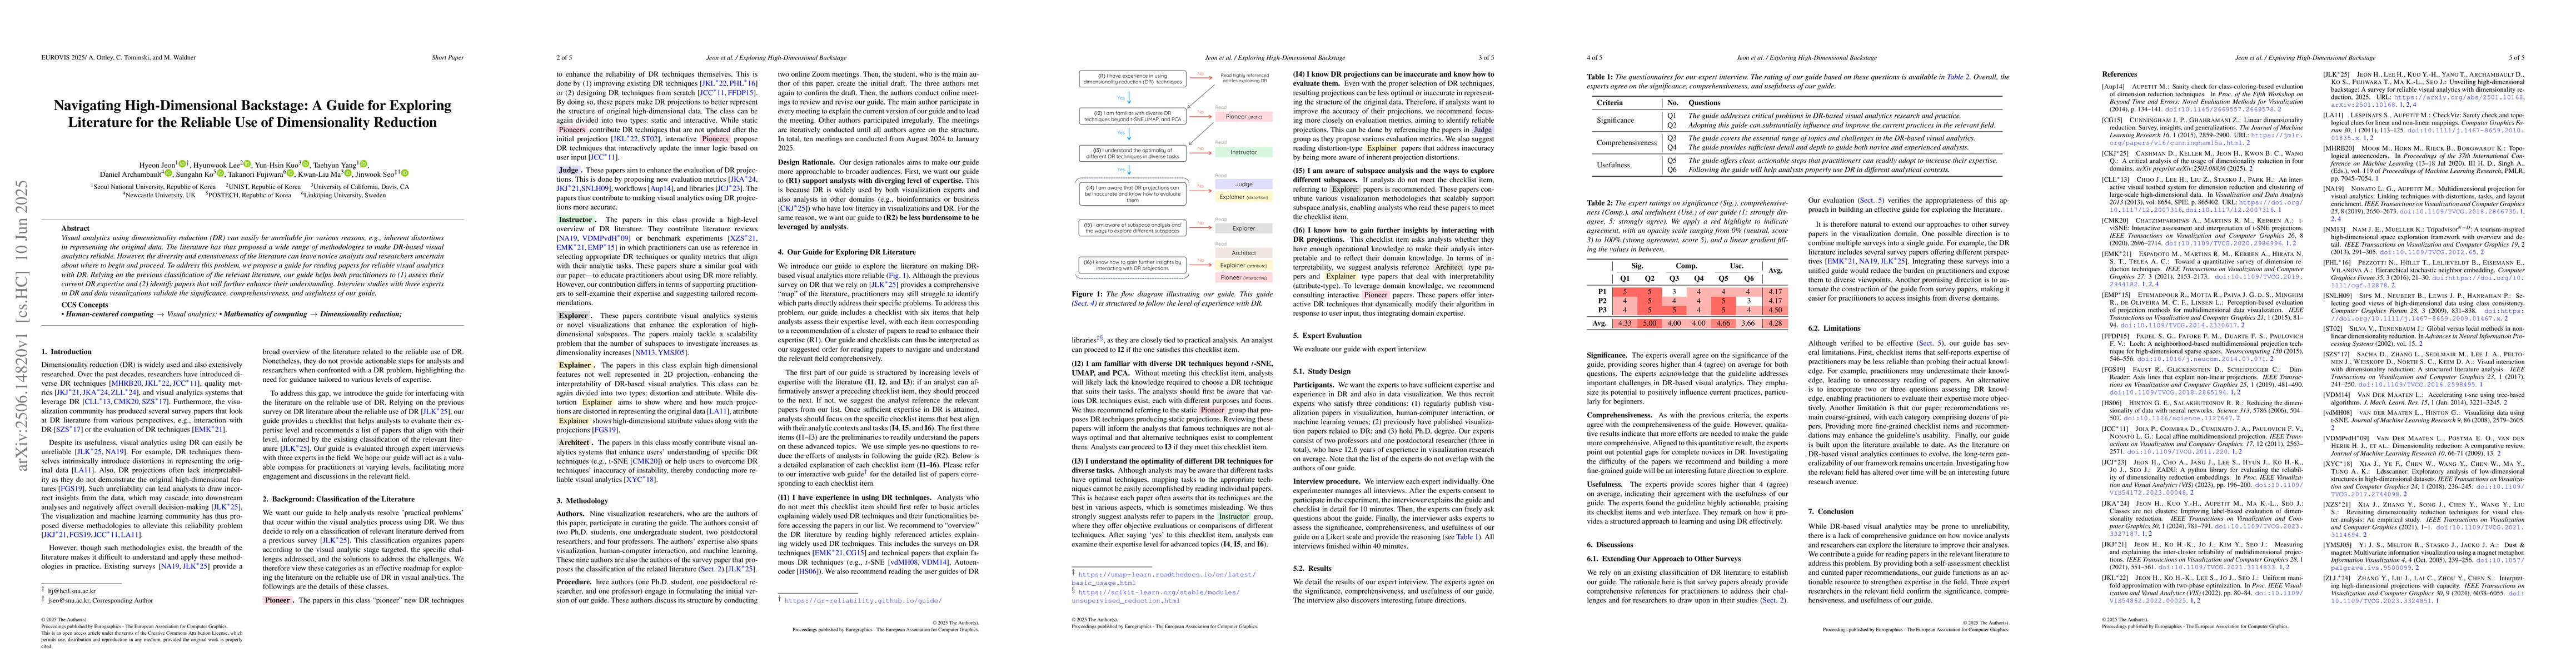
Visual analytics using dimensionality reduction (DR) can easily be unreliable for various reasons, e.g., inherent distortions in representing the original data. The literature has thus proposed a wide...
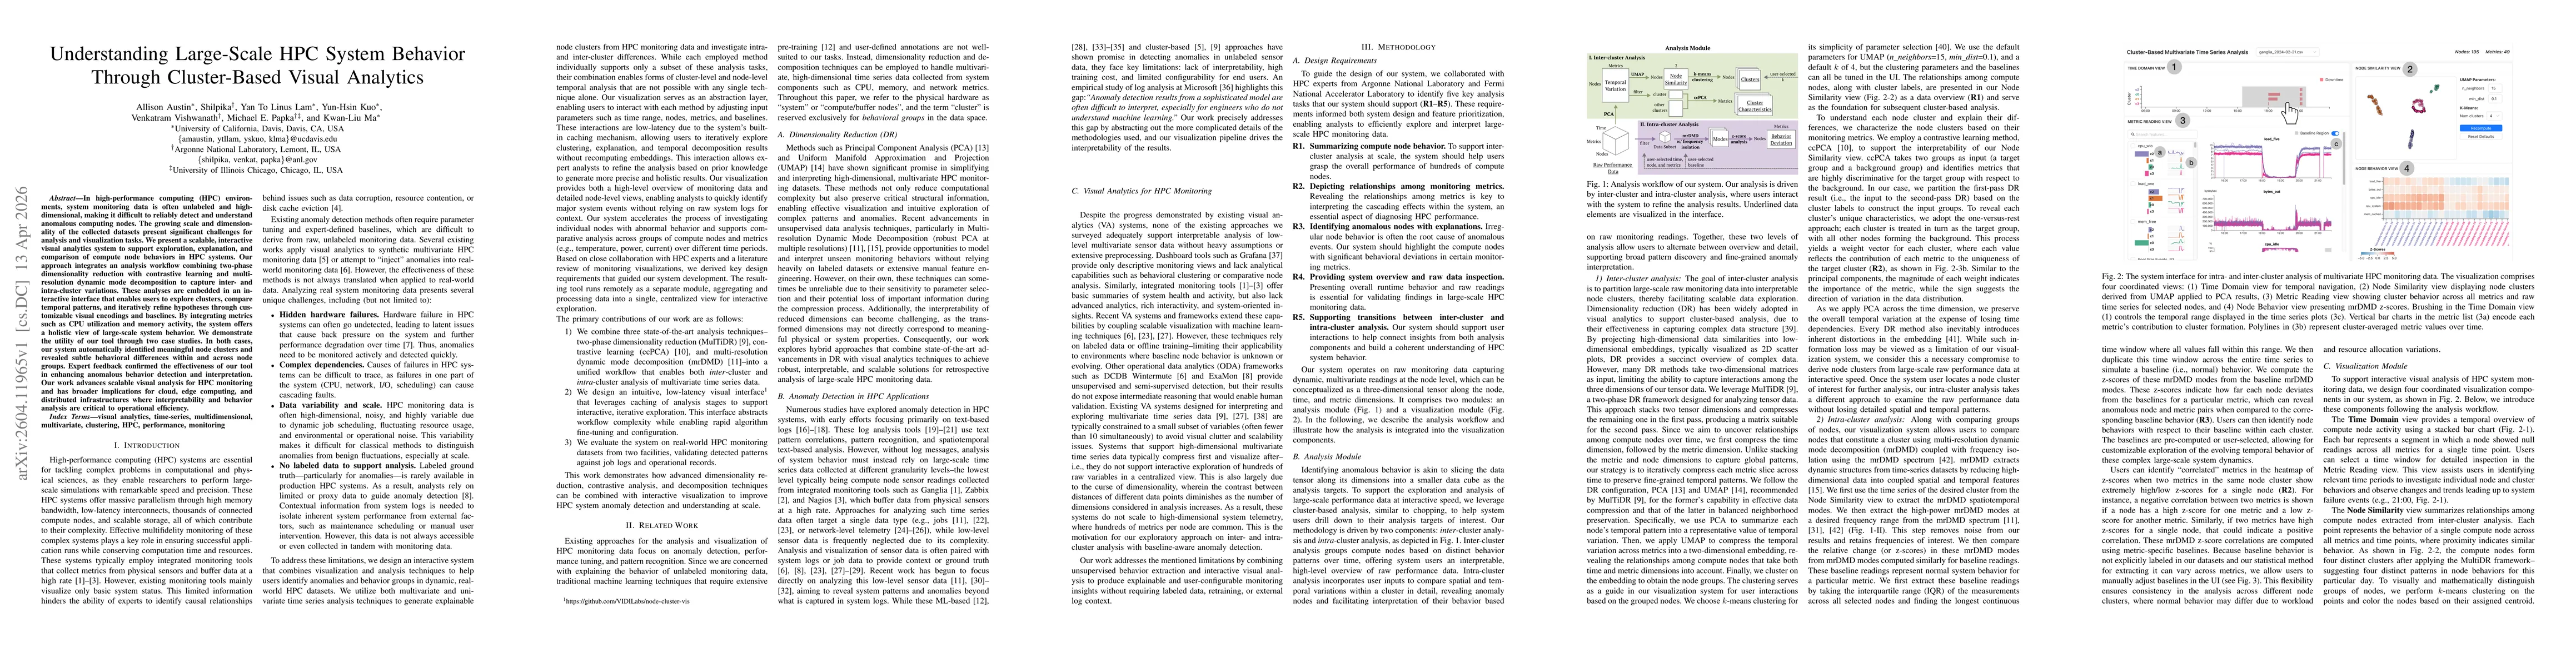
In high-performance computing (HPC) environments, system monitoring data is often unlabeled and high-dimensional, making it difficult to reliably detect and understand anomalous computing nodes. The g...
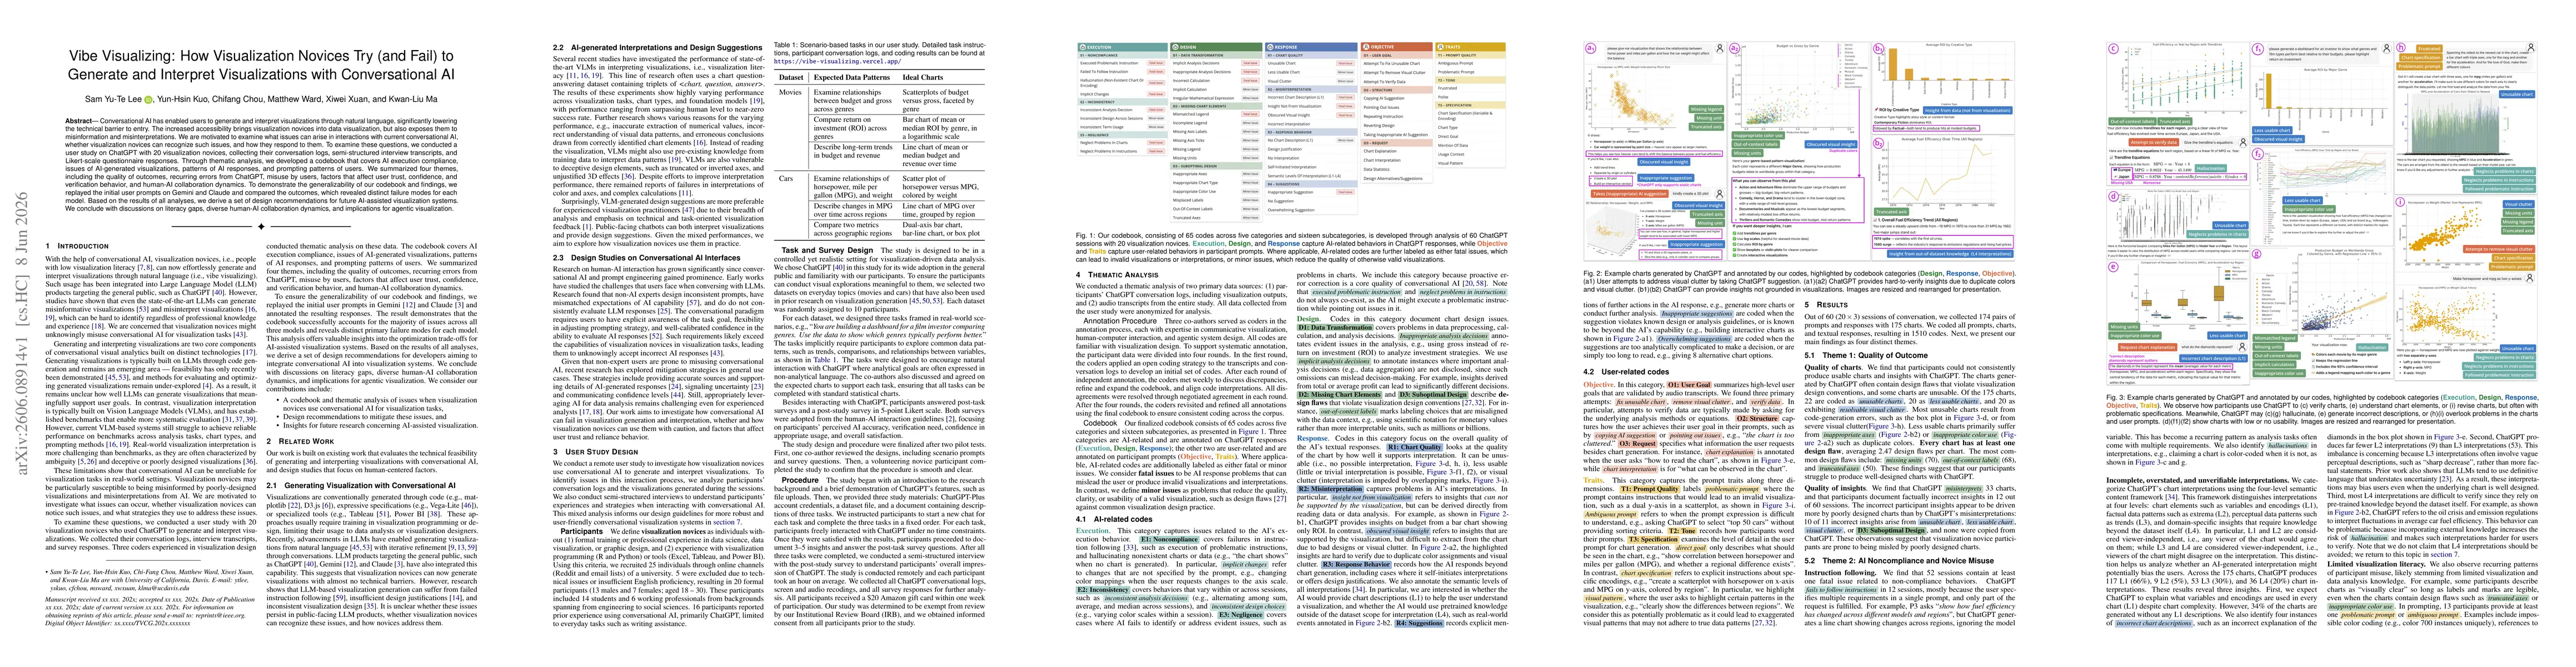
Conversational AI has enabled users to generate and interpret visualizations through natural language, significantly lowering the technical barrier to entry. The increased accessibility brings visuali...