VisActs introduces a framework for describing intent in communicative visualization, mapping linguistic concepts to visualization to formalize its communicative component. This approach leverages the philosophy of language to enhance the understanding and classification of visualization intent, highlighting potential research avenues.
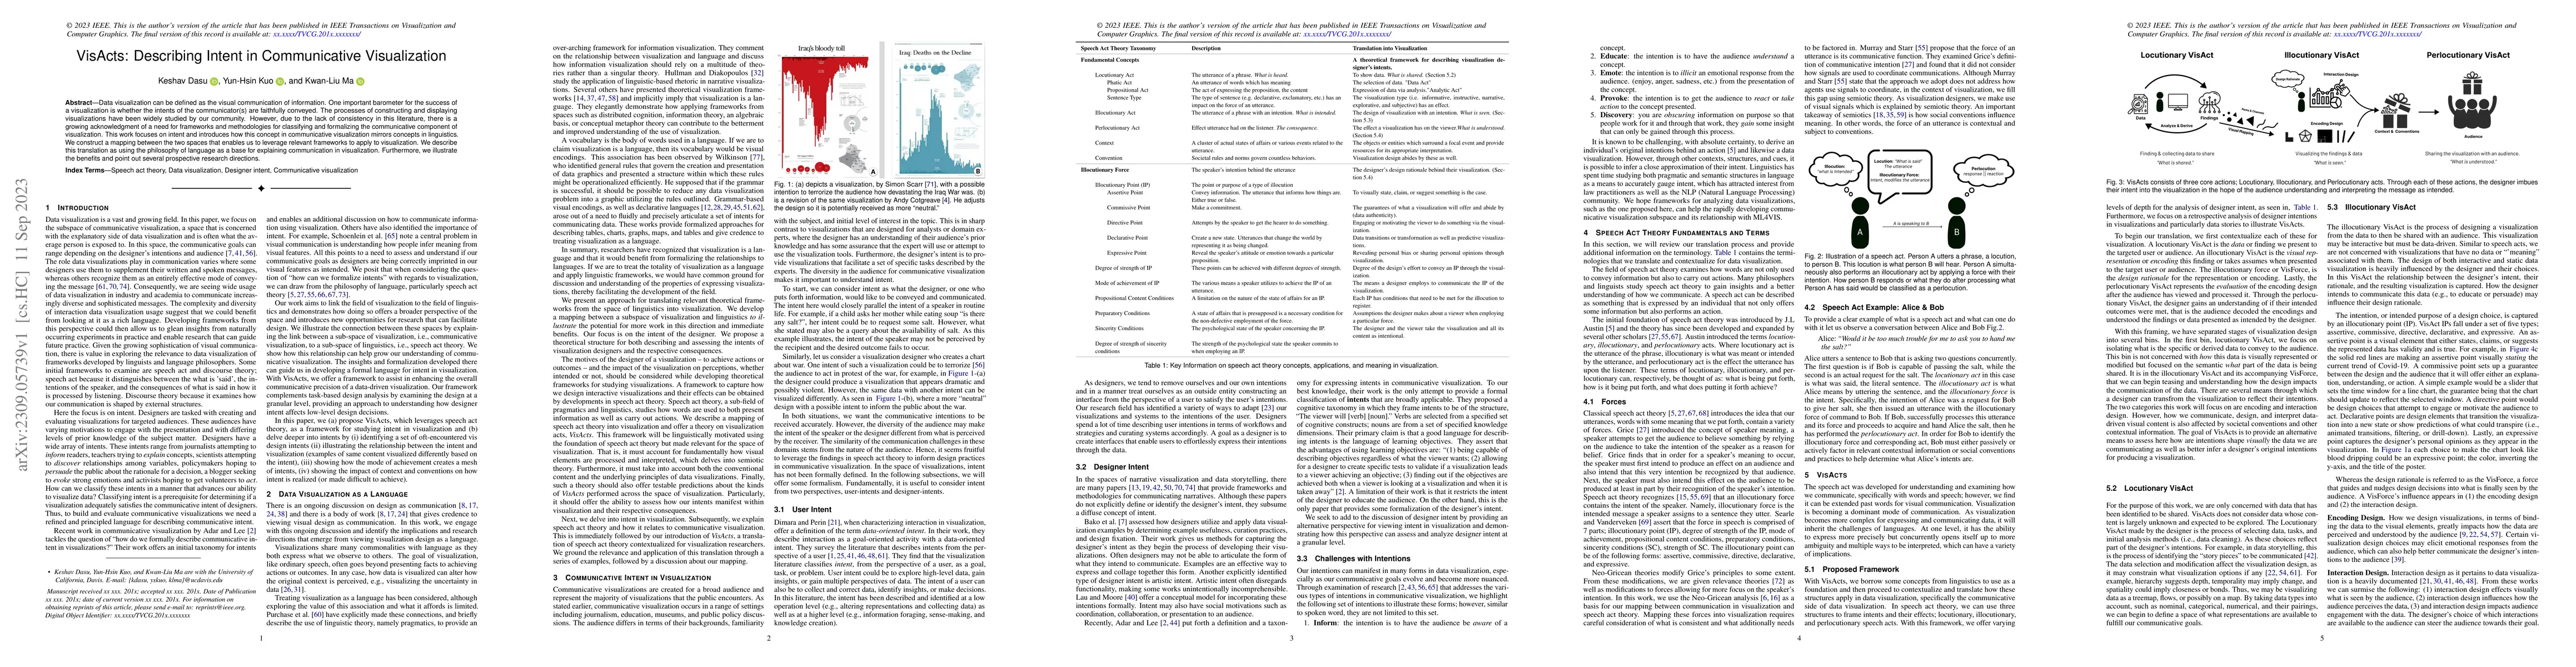
Data visualization can be defined as the visual communication of information. One important barometer for the success of a visualization is whether the intents of the communicator(s) are faithfully conveyed. The processes of constructing and displaying visualizations have been widely studied by our community. However, due to the lack of consistency in this literature, there is a growing acknowledgment of a need for frameworks and methodologies for classifying and formalizing the communicative component of visualization. This work focuses on intent and introduces how this concept in communicative visualization mirrors concepts in linguistics. We construct a mapping between the two spaces that enables us to leverage relevant frameworks to apply to visualization. We describe this translation as using the philosophy of language as a base for explaining communication in visualization. Furthermore, we illustrate the benefits and point out several prospective research directions.
Get AI-generated insights about this paper's methodology, results, and significance.
Current paper (gray), citations (green), references (blue)
Eytan Adar, Elsie Lee-Robbins
Jie Zhang, Xiaolong Li, Gerard de Melo et al.
No citations found for this paper.
Title | Authors | Year | Actions |
---|---|---|---|
Understanding how Designers Find and Use Data Visualization Examples
|
Hannah K. Bako, Xinyi Liu, L. Battle, Zhicheng Liu
|
2022
|
View Paper |
Unifying Effects of Direct and Relational Associations for Visual Communication
|
Melissa A. Schoenlein, Johnny Campos, Kevin J. Lande, Laurent Lessard, Karen B. Schloss
|
2022
|
View Paper |
Affective Learning Objectives for Communicative Visualizations
|
Elsie Lee-Robbins, Eytan Adar
|
2022
|
View Paper |
How Do Viewers Synthesize Conflicting Information from Data Visualizations?
|
Prateek Mantri, Hariharan Subramonyam, Audrey L. Michal, Cindy Xiong
|
2022
|
View Paper |
Negative Emotions, Positive Outcomes? Exploring the Communication of Negativity in Serious Data Stories
|
Xingyu Lan, Yanqiu Wu, Yang Shi, Qing Chen, Nan Cao
|
2022
|
View Paper |
The Science of Visual Data Communication: What Works
|
S. Franconeri, Lace M. K. Padilla, P. Shah, Jeffrey M. Zacks, J. Hullman
|
2021
|
View Paper |
Predicting intent behind selections in scatterplot visualizations
|
K. Gadhave, Jochen Görtler, Zach Cutler, C. Nobre, O. Deussen, Miriah D. Meyer, J. M. Phillips, A. Lex
|
2021
|
View Paper |
Context Matters: A Theory of Semantic Discriminability for Perceptual Encoding Systems
|
Kushin Mukherjee, Brian Yin, Brianne E. Sherman, Laurent Lessard, Karen B. Schloss
|
2021
|
View Paper |
A Survey of Perception-Based Visualization Studies by Task
|
Ghulam Jilani Quadri, P. Rosen
|
2021
|
View Paper |
Communicative Visualizations as a Learning Problem
|
Eytan Adar, Elsie Lee
|
2020
|
View Paper |
P5: Portable Progressive Parallel Processing Pipelines for Interactive Data Analysis and Visualization
|
J. Li, K. Ma
|
2020
|
View Paper |
What is Interaction for Data Visualization?
|
Evanthia Dimara, Charles Perin
|
2020
|
View Paper |
Why Authors Don't Visualize Uncertainty
|
J. Hullman
|
2019
|
View Paper |
Afterthoughts
|
Richard W. Unger
|
2019
|
View Paper |
Sea of Genes: A Reflection on Visualising Metagenomic Data for Museums
|
Keshav Dasu, K. Ma, Joyce Ma, Jennifer Frazier
|
2019
|
View Paper |
Mapping Color to Meaning in Colormap Data Visualizations
|
Karen B. Schloss, Connor Gramazio, Allison T. Silverman, Madeline L. Parker, Audrey S. Wang
|
2019
|
View Paper |
Vega-Lite: A Grammar of Interactive Graphics
|
Arvind Satyanarayan, Dominik Moritz, Kanit Wongsuphasawat, Jeffrey Heer
|
2018
|
View Paper |
Context
|
J. McGregor
|
2018
|
View Paper |
Force and Conversational States
|
Sarah E. Murray, W. Starr
|
2018
|
View Paper |
Decision making with visualizations: a cognitive framework across disciplines
|
Lace M. K. Padilla, Sarah H. Creem-Regehr, M. Hegarty, Jeanine K. Stefanucci
|
2018
|
View Paper |
Patterns in Award Winning Data Storytelling
|
Adegboyega Ojo, B. Heravi
|
2018
|
View Paper |
Uncertainty Visualization Influences how Humans Aggregate Discrepant Information
|
Miriam Greis, Aditi Joshi, Ken Singer, A. Schmidt, Tonja Machulla
|
2018
|
View Paper |
Emerging and Recurring Data-Driven Storytelling Techniques: Analysis of a Curated Collection of Recent Stories
|
Charles D. Stolper, Bongshin Lee, N. Riche, J. Stasko
|
2016
|
View Paper |
More Than Telling a Story: Transforming Data into Visually Shared Stories
|
Bongshin Lee, N. Riche, Petra Isenberg, Sheelagh Carpendale
|
2015
|
View Paper |
Storytelling in Information Visualizations: Does it Engage Users to Explore Data?
|
Jeremy Boy, F. Détienne, Jean-Daniel Fekete
|
2015
|
View Paper |
“Whoa! We’re going deep in the trees!”: Patterns of collaboration around an interactive information visualization exhibit
|
Pryce Davis, Michael S. Horn, Florian Block, B. Phillips, E. M. Evans, J. Diamond, Chia Shen
|
2015
|
View Paper |
Visualization Analysis and Design
|
T. Munzner
|
2014
|
View Paper |
An Algebraic Process for Visualization Design
|
G. Kindlmann, C. Scheidegger
|
2014
|
View Paper |
User Centered Design
|
Nara L. Newcomer, David Lindahl, Kelley Martin
|
2014
|
View Paper |
Beyond Mouse and Keyboard: Expanding Design Considerations for Information Visualization Interactions
|
Bongshin Lee, Petra Isenberg, N. Riche, Sheelagh Carpendale
|
2012
|
View Paper |
The DeepTree Exhibit: Visualizing the Tree of Life to Facilitate Informal Learning
|
Florian Block, Michael S. Horn, B. Phillips, J. Diamond, E. M. Evans, Chia Shen
|
2012
|
View Paper |
D³ Data-Driven Documents
|
M. Bostock, Vadim Ogievetsky, Jeffrey Heer
|
2011
|
View Paper |
Visualization Rhetoric: Framing Effects in Narrative Visualization
|
J. Hullman, N. Diakopoulos
|
2011
|
View Paper |
Collaborative visualization: Definition, challenges, and research agenda
|
Petra Isenberg, N. Elmqvist, J. Scholtz, D. Cernea, K. Ma, H. Hagen
|
2011
|
View Paper |
Speech acts in context
|
J. Mey
|
2011
|
View Paper |
Narrative Visualization: Telling Stories with Data
|
E. Segel, Jeffrey Heer
|
2010
|
View Paper |
Mental Models, Visual Reasoning and Interaction in Information Visualization: A Top-down Perspective
|
Zhicheng Liu, J. Stasko
|
2010
|
View Paper |
An Information-theoretic Framework for Visualization
|
Min Chen, H. Leitte
|
2010
|
View Paper |
Declarative Language Design for Interactive Visualization
|
Jeffrey Heer, M. Bostock
|
2010
|
View Paper |
Semiology of Graphics - Diagrams, Networks, Maps
|
Jacques Bertin, William J. Berg
|
2010
|
View Paper |
Characterizing Users' Visual Analytic Activity for Insight Provenance
|
D. Gotz, Michelle X. Zhou
|
2008
|
View Paper |
Distributed Cognition as a Theoretical Framework for Information Visualization
|
Zhicheng Liu, N. Nersessian, J. Stasko
|
2008
|
View Paper |
Design as communication: exploring the validity and utility of relating intention to interpretation
|
N. Crilly, D. Good, D. Matravers, P. Clarkson
|
2008
|
View Paper |
Theoretical Foundations of Information Visualization
|
H. Purchase, N. Andrienko, T. Jankun-Kelly, M. Ward
|
2008
|
View Paper |
Towards a Model of Information Aesthetics in Information Visualization
|
A. Lau, A. Moere
|
2007
|
View Paper |
The Grammar of Graphics
|
Mark Bailey
|
2007
|
View Paper |
VizQL: a language for query, analysis and visualization
|
P. Hanrahan
|
2006
|
View Paper |
The grammar of society: the nature and dynamics of social norms
|
C. Bicchieri
|
2005
|
View Paper |
Graphic design as communication
|
M. Barnard
|
2005
|
View Paper |
From Analysis to Design: Visual Communication in the Teaching of Writing
|
D. George
|
2002
|
View Paper |
On the Essential Contexts of Artifacts or on the Proposition That "Design Is Making Sense (Of Things)"
|
K. Krippendorff
|
1989
|
View Paper |
Automating the design of graphical presentations of relational information
|
J. Mackinlay
|
1986
|
View Paper |
Linguistic Communication and Speech Acts
|
K. Bach, R. Harnish
|
1983
|
View Paper |
Expression and Meaning: Studies in the Theory of Speech Acts
|
J. Searle
|
1979
|
View Paper |
Elements of a Plan-Based Theory of Speech Acts
|
Philip R. Cohen, C. Raymond Perrault
|
1979
|
View Paper |
Austin on Locutionary and Illocutionary Acts
|
J. Searle
|
1968
|
View Paper |
Do Illocutionary Forces Exist
|
L. Jonathan Cohen
|
1964
|
View Paper |
Should you trust a data visualisation. https://gravyanecdote.com/uncategorized/ should-you-trust-a-data-visualisation
|
2023
|
||
Sharing WhiteHouse Chart via Twitter
|
2023
|
||
How the virus got out
|
2020
|
||
Meaning
|
Gregory S. Sullivan
|
2019
|
View Paper |
Applying Pragmatics Principles for Interaction with Visual Analytics
|
Enamul Hoque, V. Setlur, Melanie Tory, I. Dykeman
|
2018
|
View Paper |
Signs In Use An Introduction To Semiotics
|
A. Strauß
|
2016
|
View Paper |
Relevance Communication And Cognition
|
Ines Gloeckner
|
2016
|
View Paper |
Engaging Museum Visitors with Scientific Data through Visualization: A Comparison of Three Strategies
|
Joyce Ma
|
2013
|
View Paper |
An Exploratory Study of Interactivity in Visualization Tools: ‘Flow’ of Interaction
|
Hai-Ning Liang, Paul C. Parsons, Hsien-Chi Wu, K. Sedig
|
2010
|
View Paper |
How to Do Things with Words之脉络分析
|
蒋家义
|
2009
|
View Paper |
Semiotics and Visual Representation
|
B. Curtin
|
2009
|
View Paper |
How to Do Things With Words
|
Csr Young
|
2009
|
View Paper |
Visitors’ interpretations of images of the nanoscale
|
2008
|
||
Speech Acts and Illocutionary Logic
|
J. Searle, D. Vanderveken
|
2005
|
View Paper |
Peirce on signs : writings on semiotic
|
C. Peirce, J. Hoopes
|
1991
|
View Paper |
Speech Acts: An Essay in the Philosophy of Language
|
J. Searle
|
1969
|
View Paper |
Engaging or motivating the viewer to do something via the visualization
|
|||
Data transitions or transformation as well as predictive visualizations
|
|||
Educate : the intention is to have the audience understand a concept
|
|||
The guarantees of what a visualization will offer and abide by (data authenticity)
|
|||
Revealing personal bias or sharing personal opinions through visualization
|
|||
Here’s When We Expect Omicron to Peak
|
|||
@Wattenberger's chart twitter thread
|
|||
The means a designer employs to communicate the IP of the visualization
|
|||
Iraq’s bloody toll
|
|||
America’s Economic Growth in the 21st Century
|
Showing first page preview. Click "Open Full PDF" to view the complete paper.
Your comment contains inappropriate language and has been rejected.
Are you sure you want to remove this tag? This action cannot be undone.
Someone just found a breakthrough paper!
Comments (0)