SpreadLine is a novel visualization framework that holistically explores egocentric dynamic influence through a storyline-based design, addressing strength, function, structure, and content of relationships. It integrates topological and contextual information to facilitate analytical tasks, as demonstrated in real-world applications and a usability study.
No key terms available for this paper.
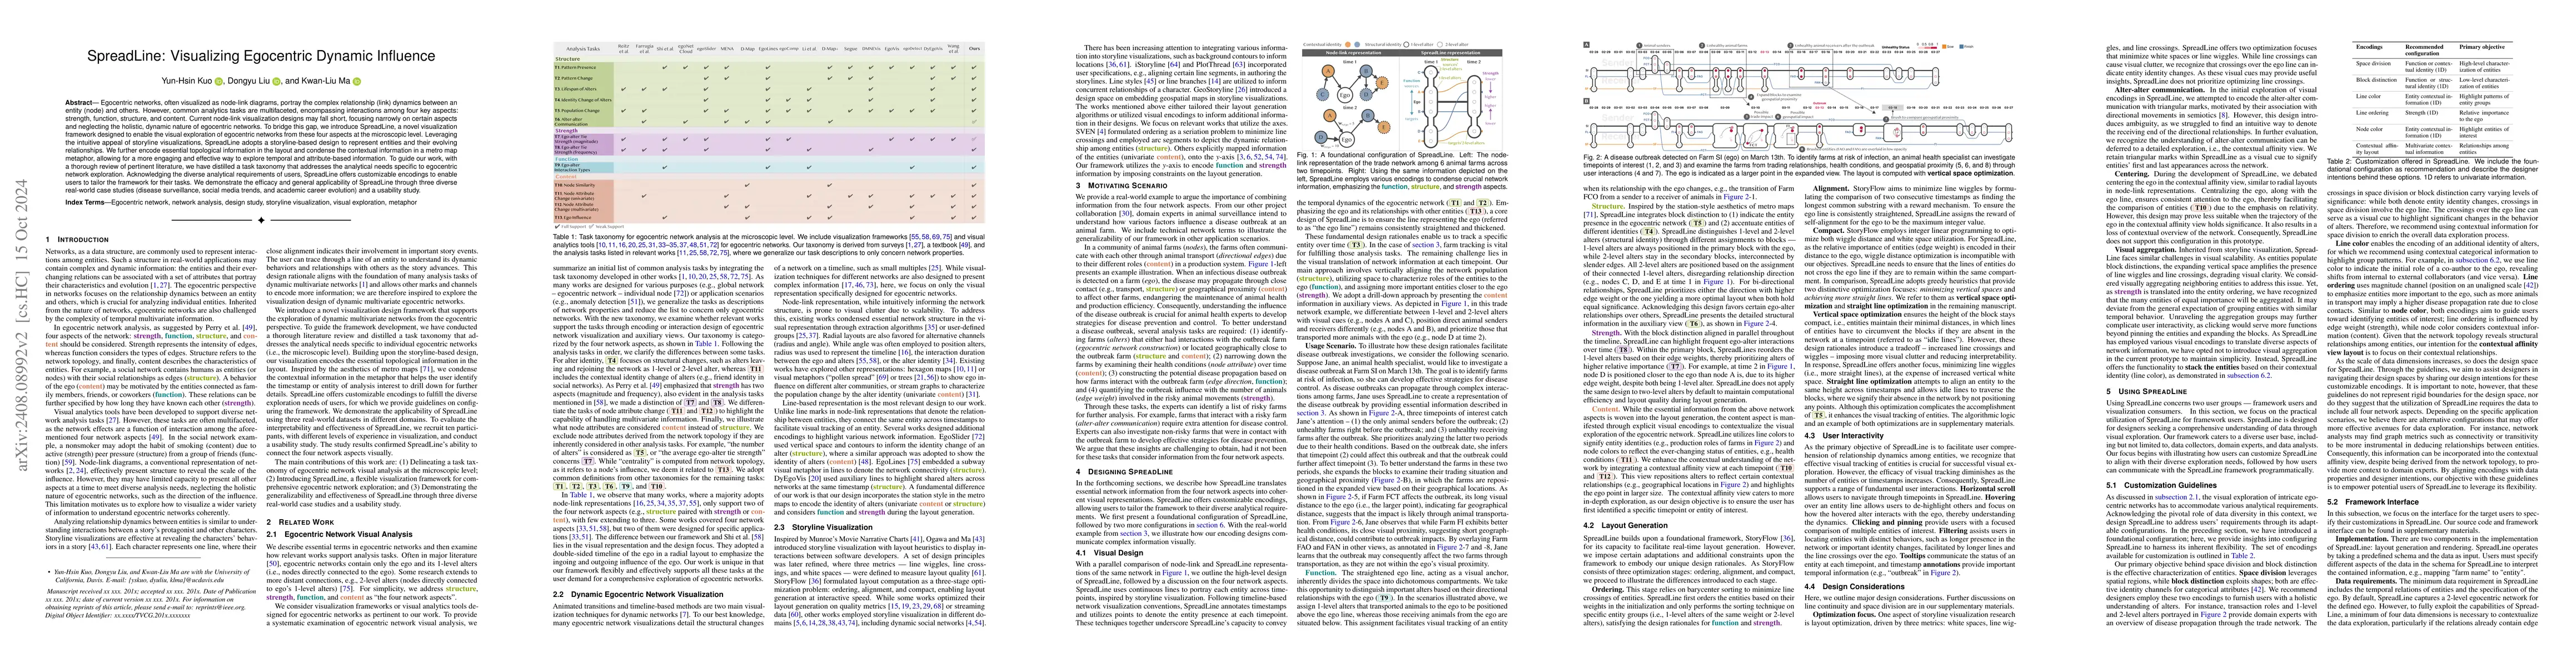
Egocentric networks, often visualized as node-link diagrams, portray the complex relationship (link) dynamics between an entity (node) and others. However, common analytics tasks are multifaceted, encompassing interactions among four key aspects: strength, function, structure, and content. Current node-link visualization designs may fall short, focusing narrowly on certain aspects and neglecting the holistic, dynamic nature of egocentric networks. To bridge this gap, we introduce SpreadLine, a novel visualization framework designed to enable the visual exploration of egocentric networks from these four aspects at the microscopic level. Leveraging the intuitive appeal of storyline visualizations, SpreadLine adopts a storyline-based design to represent entities and their evolving relationships. We further encode essential topological information in the layout and condense the contextual information in a metro map metaphor, allowing for a more engaging and effective way to explore temporal and attribute-based information. To guide our work, with a thorough review of pertinent literature, we have distilled a task taxonomy that addresses the analytical needs specific to egocentric network exploration. Acknowledging the diverse analytical requirements of users, SpreadLine offers customizable encodings to enable users to tailor the framework for their tasks. We demonstrate the efficacy and general applicability of SpreadLine through three diverse real-world case studies (disease surveillance, social media trends, and academic career evolution) and a usability study.
This graph shows how this paper is connected to other research. The current paper is shown in dark gray, papers that cite it are in green, and papers it references are in blue. You can:
• Hover over any node to see the paper title
• Click a node to view that paper's details
• Drag nodes to rearrange the graph
• Use the zoom controls (bottom right) to zoom in/out
Title | Authors | Year | Actions |
---|---|---|---|
Storylines with a Protagonist
|
Tim Hegemann, Alexander Wolff
|
2024
|
View Paper |
Title | Authors | Year | Actions |
---|---|---|---|
IMVis: Visual analytics for influence maximization algorithm evaluation in hypergraphs
|
Jin Xu, Chaojian Zhang, Ming Xie, Xiuxiu Zhan, Luwang Yan, Yubo Tao, Zhigeng Pan
|
2024
|
View Paper |
Explain-and-Test: An Interactive Machine Learning Framework for Exploring Text Embeddings
|
Shivam Raval, Carolyn Wang, Fernanda B. Viégas, Martin Wattenberg
|
2023
|
View Paper |
Character-Oriented Design for Visual Data Storytelling
|
Keshav Dasu, Yun-Hsin Kuo, K. Ma
|
2023
|
View Paper |
The State of the Art in Visualizing Dynamic Multivariate Networks
|
Bharati Kale, Maoyuan Sun, M. Papka
|
2023
|
View Paper |
Evaluating ChatGPT's Information Extraction Capabilities: An Assessment of Performance, Explainability, Calibration, and Faithfulness
|
Bo Li, Gexiang Fang, Yang Yang, Quansen Wang, Wei Ye, Wen Zhao, Shikun Zhang
|
2023
|
View Paper |
ChatGPT-4 Outperforms Experts and Crowd Workers in Annotating Political Twitter Messages with Zero-Shot Learning
|
Petter Törnberg
|
2023
|
View Paper |
Investigating Animal Infectious Diseases with Visual Analytics
|
Yun-Hsin Kuo, B. Martínez-López, K. Ma
|
2023
|
View Paper |
ChatGPT outperforms crowd workers for text-annotation tasks
|
F. Gilardi, Meysam Alizadeh, M. Kubli
|
2023
|
View Paper |
Knowledge Graphs: Opportunities and Challenges
|
Ciyuan Peng, Feng Xia, Mehdi Naseriparsa, Francesco Osborne
|
2023
|
View Paper |
Crossing Minimization in Time Interval Storylines
|
Alexander Dobler, M. Nöllenburg, Daniel Stojanovic, Anaïs Villedieu, J. Wulms
|
2023
|
View Paper |
Geo-Storylines: Integrating Maps into Storyline Visualizations
|
Golina Hulstein, Vanessa Peña Araya, A. Bezerianos
|
2022
|
View Paper |
Egocentric visual analysis of dynamic citation network
|
Teng Wang, Zeyu Li, Jiawan Zhang
|
2022
|
View Paper |
ScrollyVis: Interactive Visual Authoring of Guided Dynamic Narratives for Scientific Scrollytelling
|
Eric Mörth, S. Bruckner, N. Smit
|
2022
|
View Paper |
The Science of Visual Data Communication: What Works
|
S. Franconeri, Lace M. K. Padilla, P. Shah, Jeffrey M. Zacks, J. Hullman
|
2021
|
View Paper |
HyperStorylines: Interactively untangling dynamic hypergraphs
|
Vanessa Peña-Araya, Tong Xue, Emmanuel Pietriga, L. Amsaleg, A. Bezerianos
|
2021
|
View Paper |
Towards a Survey on Static and Dynamic Hypergraph Visualizations
|
M. Fischer, A. Frings, D. Keim, Daniel Seebacher
|
2021
|
View Paper |
DyEgoVis: Visual Exploration of Dynamic Ego-Network Evolution
|
Kun Fu, Tingyun Mao, Yang Wang, Daoyu Lin, Yuanben Zhang, Xian Sun
|
2021
|
View Paper |
Calliope: Automatic Visual Data Story Generation from a Spreadsheet
|
Danqing Shi, Xinyue Xu, F. Sun, Yang Shi, Nan Cao
|
2020
|
View Paper |
egoDetect: Visual Detection and Exploration of Anomaly in Social Communication Network
|
J. Pu, Jingwen Zhang, Hui Shao, Tingting Zhang, Yunbo Rao
|
2020
|
View Paper |
PlotThread: Creating Expressive Storyline Visualizations using Reinforcement Learning
|
Tan Tang, Renzhong Li, Xinke Wu, Shuhan Liu, Johannes Knittel, Steffen Koch, Thomas Ertl, Lingyun Yu, Peiran Ren, Yingcai Wu
|
2020
|
View Paper |
In Search of Patient Zero: Visual Analytics of Pathogen Transmission Pathways in Hospitals
|
Tom Baumgartl, Markus Petzold, M. Wunderlich, Markus Höhn, D. Archambault, M. Lieser, A. Dalpke, Simone Scheithauer, M. Marschollek, V. Eichel, N. Mutters, Highmed Consortium, T. V. Landesberger
|
2020
|
View Paper |
Storyline Visualizations with Ubiquitous Actors
|
E. D. Giacomo, W. Didimo, G. Liotta, F. Montecchiani, Alessandra Tappini
|
2020
|
View Paper |
A Survey on Transit Map Layout – from Design, Machine, and Human Perspectives
|
Hsiang-Yun Wu, Benjamin Niedermann, Shigeo Takahashi, M. Roberts, M. Nöllenburg
|
2020
|
View Paper |
A review: Knowledge reasoning over knowledge graph
|
Xiaojun Chen, Shengbin Jia, Yang Xiang
|
2020
|
View Paper |
EgoVis: A Visual Analysis System for Social Networks Based on Egocentric Research
|
Qiang Lu, Jing Huang, Yifan Ge, Dajiu Wen, B. Chen, Ye Yu
|
2019
|
View Paper |
A system for generating storyline visualizations using hierarchical task network planning
|
Kalpesh Padia, K. Bandara, C. Healey
|
2019
|
View Paper |
iStoryline: Effective Convergence to Hand-drawn Storylines
|
Tan Tang, Sadia Rubab, Jiewen Lai, Weiwei Cui, Lingyun Yu, Yingcai Wu
|
2019
|
View Paper |
DMNEVis: A Novel Visual Approach to Explore Evolution of Dynamic Multivariate Network
|
Di Peng, Wei Tian, B. Lu, Min Zhu
|
2018
|
View Paper |
Segue: Overviewing Evolution Patterns of Egocentric Networks by Interactive Construction of Spatial Layouts
|
Po-Ming Law, Yanhong Wu, Rahul C. Basole
|
2018
|
View Paper |
The “y” of it Matters, Even for Storyline Visualization
|
Dustin L. Arendt, M. Pirrung
|
2017
|
View Paper |
Computing Storyline Visualizations with Few Block Crossings
|
Thomas C. van Dijk, Fabian Lipp, Peter Markfelder, A. Wolff
|
2017
|
View Paper |
egoComp: A node-link-based technique for visual comparison of ego-networks
|
Dongyu Liu, Fangzhou Guo, Bowen Deng, Huamin Qu, Yingcai Wu
|
2017
|
View Paper |
A visual analytics approach for understanding egocentric intimacy network evolution and impact propagation in MMORPGs
|
Quan Li, Qiaomu Shen, Yao Ming, Peng-Tao Xu, Yun Wang, Xiaojuan Ma, Huamin Qu
|
2017
|
View Paper |
Five factors that guide attention in visual search
|
J. Wolfe, T. Horowitz
|
2017
|
View Paper |
A Taxonomy and Survey of Dynamic Graph Visualization
|
Fabian Beck, Michael Burch, S. Diehl, D. Weiskopf
|
2017
|
View Paper |
Storyline visualizations of eye tracking of movie viewing
|
J. Timothy Balint, Dustin L. Arendt, L. Blaha
|
2016
|
View Paper |
D-Map: Visual analysis of ego-centric information diffusion patterns in social media
|
Siming Chen, Shuai Chen, Zhenhuang Wang, Jie Liang, Xiaoru Yuan, Nan Cao, Yadong Wu
|
2016
|
View Paper |
MENA: Visual Analysis of Multivariate Egocentric Network Evolution
|
Qinglai He, Min Zhu, B. Lu, Hanqing Liu, Qiaomu Shen
|
2016
|
View Paper |
Crossing Minimization in Storyline Visualization
|
M. Gronemann, M. Jünger, F. Liers, Francesco Mambelli
|
2016
|
View Paper |
Egocentric Analysis of Dynamic Networks with EgoLines
|
Jian Zhao, Michael Glueck, Fanny Chevalier, Yanhong Wu, Azam Khan
|
2016
|
View Paper |
A design study of personal bibliographic data visualization
|
Tsai-Ling Fung, Jia-Kai Chou, K. Ma
|
2016
|
View Paper |
egoSlider: Visual Analysis of Egocentric Network Evolution
|
Yanhong Wu, Naveen Pitipornvivat, Jian Zhao, Sixiao Yang, Guowei Huang, Huamin Qu
|
2016
|
View Paper |
Contact Trees: Network Visualization beyond Nodes and Edges
|
A. Sallaberry, Yang-chih Fu, Hwai-Chung Ho, K. Ma
|
2016
|
View Paper |
EgoNetCloud: Event-based egocentric dynamic network visualization
|
Qingsong Liu, Yifan Hu, Lei Shi, Xinzhu Mu, Yutao Zhang, Jie Tang
|
2015
|
View Paper |
On Minimizing Crossings in Storyline Visualizations
|
I. Kostitsyna, M. Nöllenburg, V. Polishchuk, A. Schulz, Darren Strash
|
2015
|
View Paper |
A Layout Technique for Storyline-based Visualization of Consecutive Numerical Time-varying Data
|
Sayaka Yagi, T. Itoh, M. Takatsuka
|
2015
|
View Paper |
Traditional and new principles of perceptual grouping
|
J. Brooks
|
2015
|
View Paper |
An Efficient Framework for Generating Storyline Visualizations from Streaming Data
|
Y. Tanahashi, Chien-Hsin Hsueh, K. Ma
|
2015
|
View Paper |
1.5D Egocentric Dynamic Network Visualization
|
Lei Shi, Chen Wang, Zhen Wen, Huamin Qu, Chuang Lin, Qi Liao
|
2015
|
View Paper |
SVEN: Informative Visual Representation of Complex Dynamic Structure
|
Dustin L. Arendt, L. Blaha
|
2014
|
View Paper |
Visualization Analysis and Design
|
T. Munzner
|
2014
|
View Paper |
An effective demonstration for group collaboration based on storyline visualization technology
|
Qiang Lu, Xiang-Yuan Zhu, Li Liu, Shu-Bo Cao
|
2014
|
View Paper |
A Task Taxonomy for Network Evolution Analysis
|
Jae-wook Ahn, C. Plaisant, B. Shneiderman
|
2014
|
View Paper |
StoryFlow: Tracking the Evolution of Stories
|
Shixia Liu, Yingcai Wu, Enxun Wei, Mengchen Liu, Yang Liu
|
2013
|
View Paper |
Design Considerations for Optimizing Storyline Visualizations
|
Y. Tanahashi, K. Ma
|
2012
|
View Paper |
Social Network Analysis: History, Theory and Methodology
|
C. Prell
|
2011
|
View Paper |
Visualizing the Evolution of Community Structures in Dynamic Social Networks
|
K. Reda, Chayant Tantipathananandh, Andrew E. Johnson, J. Leigh, T. Berger-Wolf
|
2011
|
View Paper |
Exploring temporal ego networks using small multiples and tree-ring layouts
|
Michael Farrugia, N. Hurley, A. Quigley
|
2011
|
View Paper |
Software evolution storylines
|
Michael Ogawa, K. Ma
|
2010
|
View Paper |
A Framework for an Ego-centered and Time-aware Visualization of Relations in Arbitrary Data Repositories
|
Florian Reitz
|
2010
|
View Paper |
Recent Findings on Peer Group Influences on Adolescent Smoking
|
B. Simons-Morton, T. Farhat
|
2010
|
View Paper |
Tracing genealogical data with TimeNets
|
N. Kim, S. Card, Jeffrey Heer
|
2010
|
View Paper |
ArnetMiner: extraction and mining of academic social networks
|
Jie Tang, Jing Zhang, Limin Yao, Juan-Zi Li, Li Zhang, Zhong Su
|
2008
|
View Paper |
11 DMap + : Interactive Visual Analysis and Exploration of Egocentric and Event-centric Information Diffusion Patterns in Social Media
|
Siming Chen, Shuai Chen, Zhenhuang Wang
|
2018
|
View Paper |
Storytelling by the StoryCake visualization
|
Qiang Lu, Bingjie Chai, Haibo Zhang
|
2017
|
View Paper |
Minimizing Wiggles in Storyline Visualizations
|
2017
|
View Paper | |
A Survey of Multi-faceted Graph Visualization
|
S. Hadlak, H. Schumann, Hans-Jörg Schulz
|
2015
|
View Paper |
Glyph-based Visualization: Foundations, Design Guidelines, Techniques and Applications
|
R. Borgo, J. Kehrer, David H. S. Chung, E. Maguire, R. Laramee, H. Hauser, M. Ward, Min Chen
|
2013
|
View Paper |
Temporal Multivariate Networks
|
D. Archambault, J. Abello, J. Kennedy, S. Kobourov, K. Ma, S. Miksch, C. Muelder, A. Telea
|
2013
|
View Paper |
Scientific story-telling using visualization
|
2011
|
||
Visualizing Data using t-SNE
|
L. Maaten, Geoffrey E. Hinton
|
2008
|
View Paper |
Spatial schemas in depictions
|
B. Tversky
|
1999
|
View Paper |
ChatGPT-4 [large language model]
|
|||
Movie narrative charts
|
Showing first page preview. Click "Open Full PDF" to view the complete paper.
Lorenzo Mur-Labadia, Ruben Martinez-Cantin, Josechu Guerrero
Published: 2025-03-11
Xi Wang, Otmar Hilliges, Marc Pollefeys, Luc Van Gool, Daiwei Zhang, Gengyan Li, Jiajie Li, Mickaël Bressieux
Published: 2024-06-28
Hyun Soo Park, Khiem Vuong, Tien Do
Published: 2022-07-15
You need to log in to post a comment.
Your comment contains inappropriate language.
Are you sure you want to remove this tag?
Someone just favorited a paper!
Comments (0)