Publication
Metrics
Paper Preview
Abstract
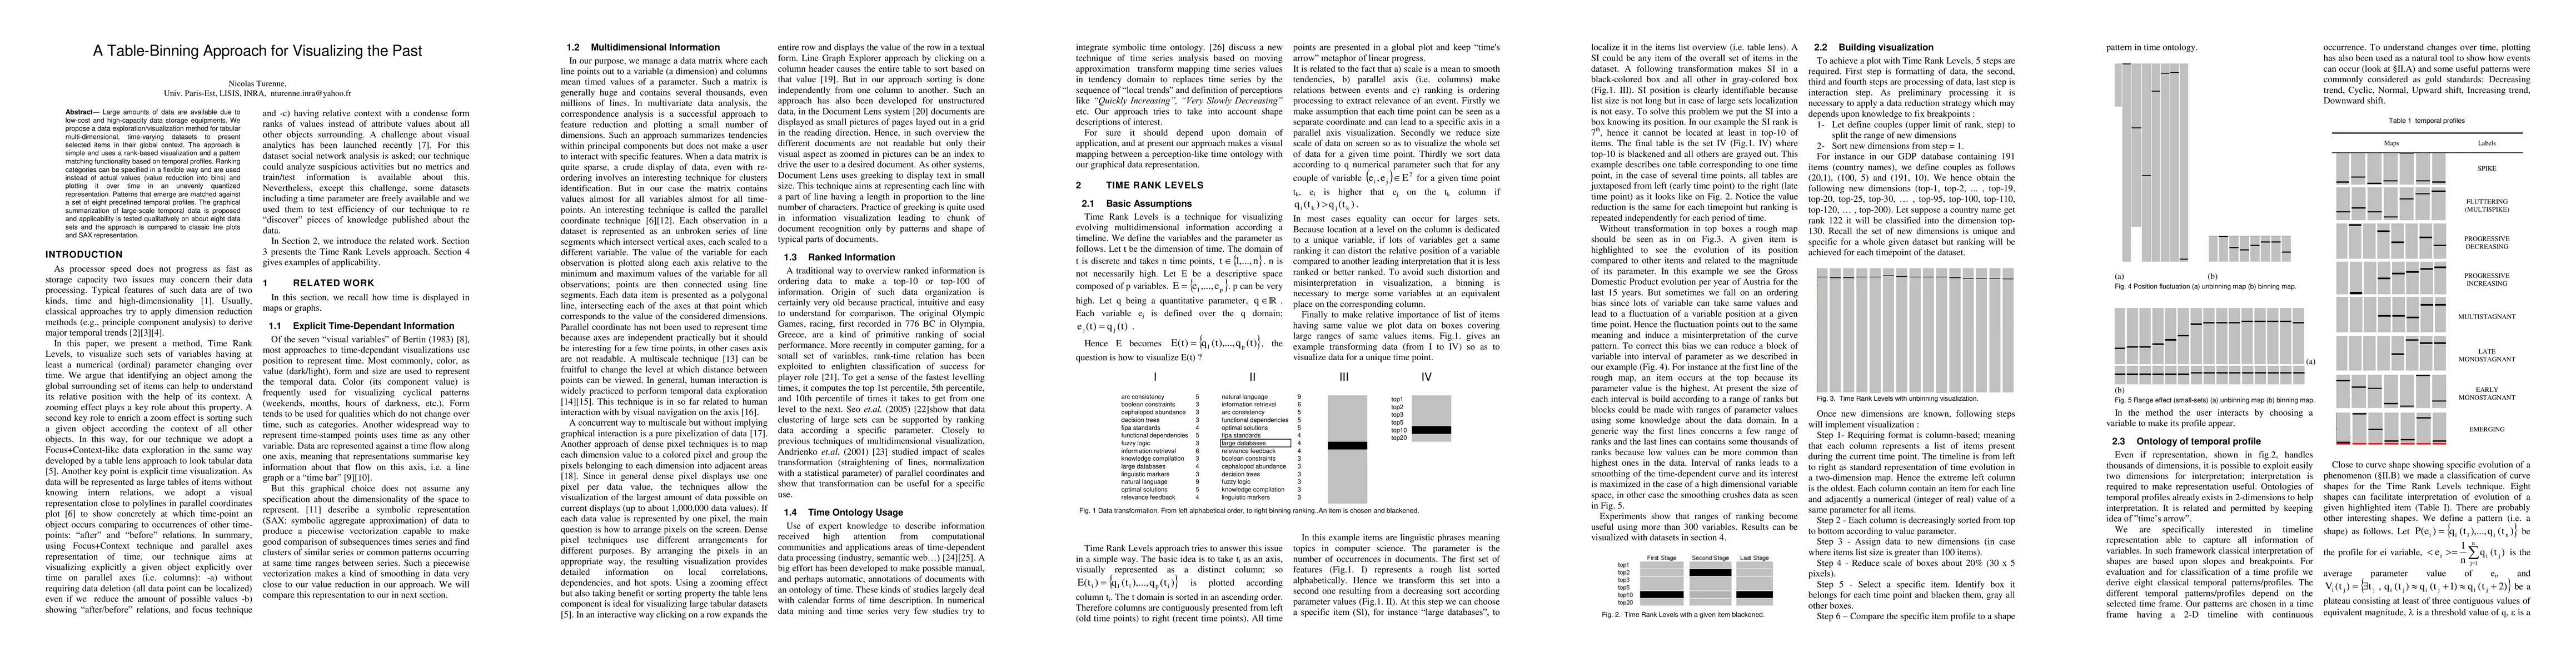
Large amounts of data are available due to low-cost and high-capacity data storage equipments. We propose a data exploration/visualization method for tabular multi-dimensional, time-varying datasets to present selected items in their global context. The approach is simple and uses a rank-based visualization and a pattern matching functionality based on temporal profiles. Ranking categories can be specified in a flexible way and are used instead of actual values (value reduction into bins) and plotting it over time in an unevenly quantized representation. Patterns that emerge are matched against a set of eight predefined temporal profiles. The graphical summarization of large-scale temporal data is proposed and applicability is tested qualitatively on about eight data sets and the approach is compared to classic line plots and SAX representation
AI Key Findings
Get AI-generated insights about this paper's methodology, results, significance, and more — seven facets brought into focus.
Impact
Paper Details
PDF Preview
Key Terms
Citation Network
Current paper (gray), citations (green), references (blue)
Display is limited for performance on very large graphs.
Discussion 0