A Tidy Data Structure and Visualisations for Multiple Variable Correlations and Other Pairwise Scores
Publication
Metrics
AI Quick Summary
This paper introduces a pipeline for calculating and visualizing multiple variable correlations and pairwise scores using a tidy data structure. The proposed method enhances traditional heatmaps with richer visualizations to reveal complex relationships, including those involving categorical variables and non-linear numeric associations, all implemented in the R package bullseye.
Paper Preview
Abstract
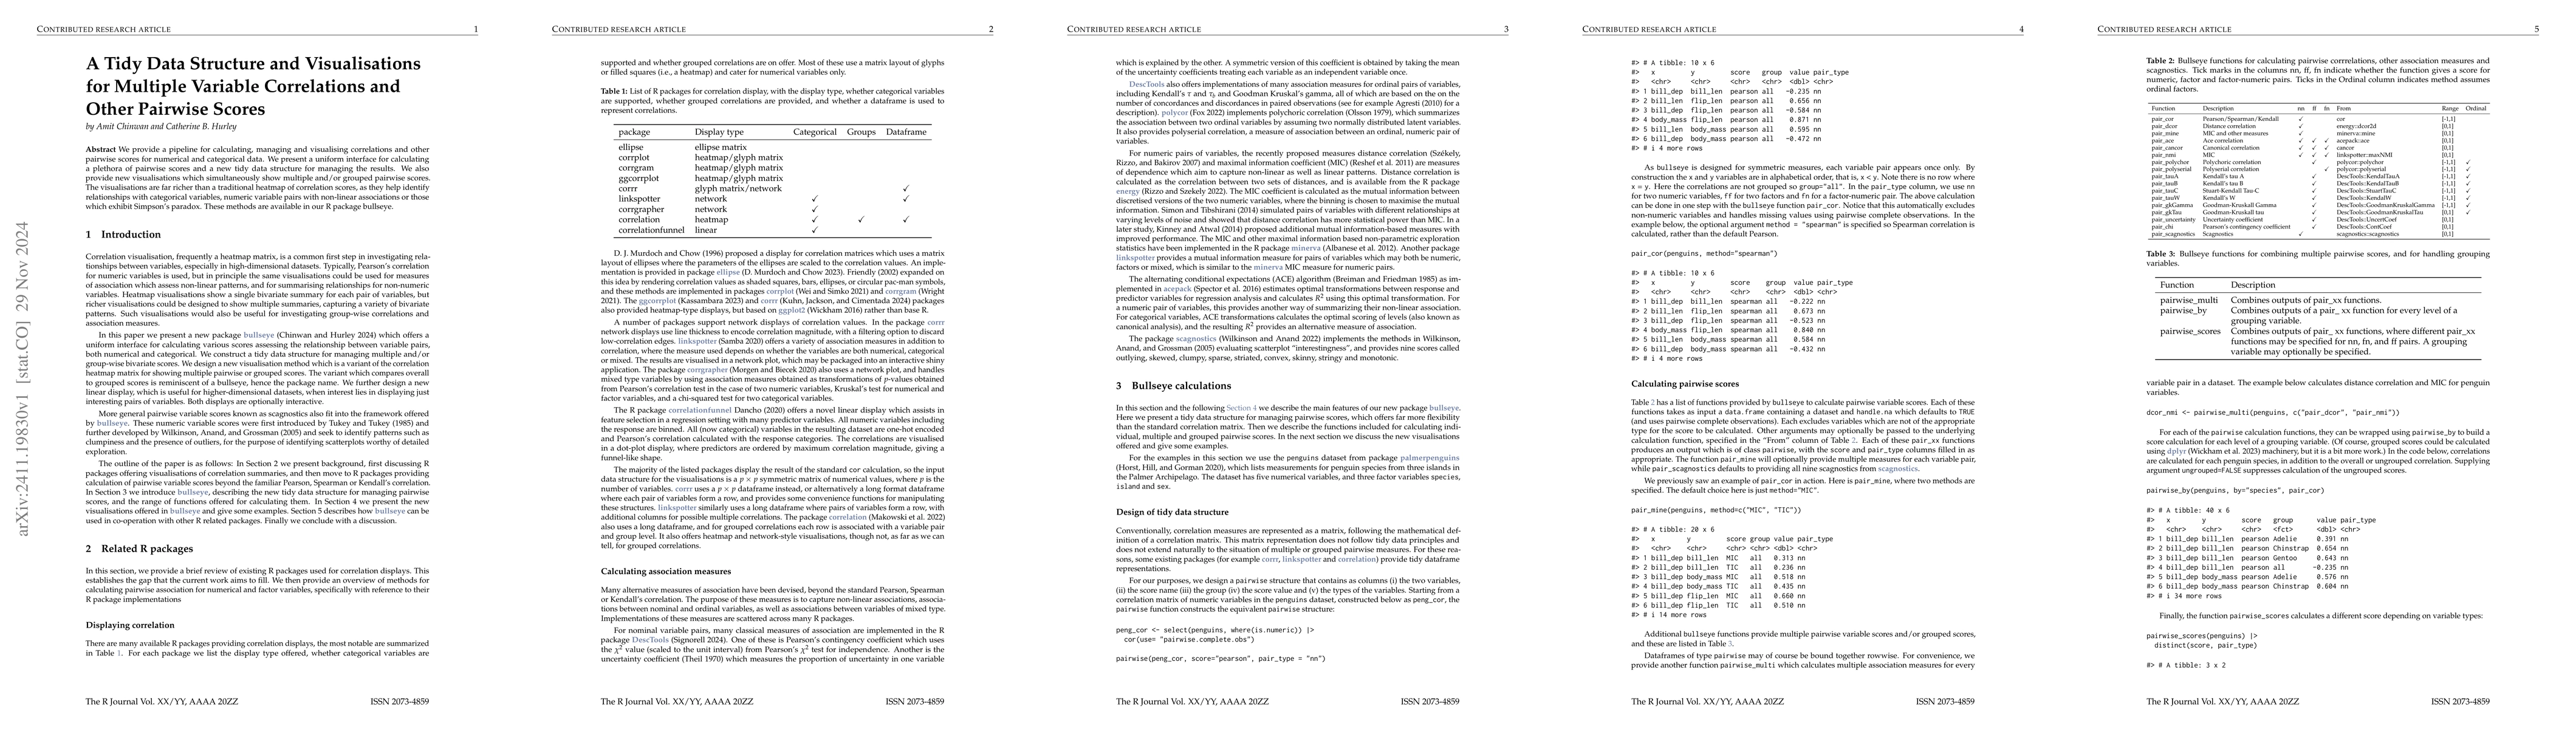
We provide a pipeline for calculating, managing and visualising correlations and other pairwise scores for numerical and categorical data. We present a uniform interface for calculating a plethora of pairwise scores and a new tidy data structure for managing the results. We also provide new visualisations which simultaneously show multiple and/or grouped pairwise scores. The visualisations are far richer than a traditional heatmap of correlation scores, as they help identify relationships with categorical variables, numeric variable pairs with non-linear associations or those which exhibit Simpson's paradox. These methods are available in our R package bullseye.
AI Key Findings
Get AI-generated insights about this paper's methodology, results, significance, and more — seven facets brought into focus.
Authors
PDF Preview
Related Papers
No references found for this paper.
Discussion 0