A Toolkit for Scalable Spreadsheet Visualization
Publication
Metrics
AI Quick Summary
This paper introduces a toolkit for visualizing large spreadsheets through logical areas, semantic classes, and data modules, integrated as a Gnumeric plug-in. It enables hierarchical and graph-based representations to help users identify conceptual similarities across large datasets efficiently.
Paper Preview
Abstract
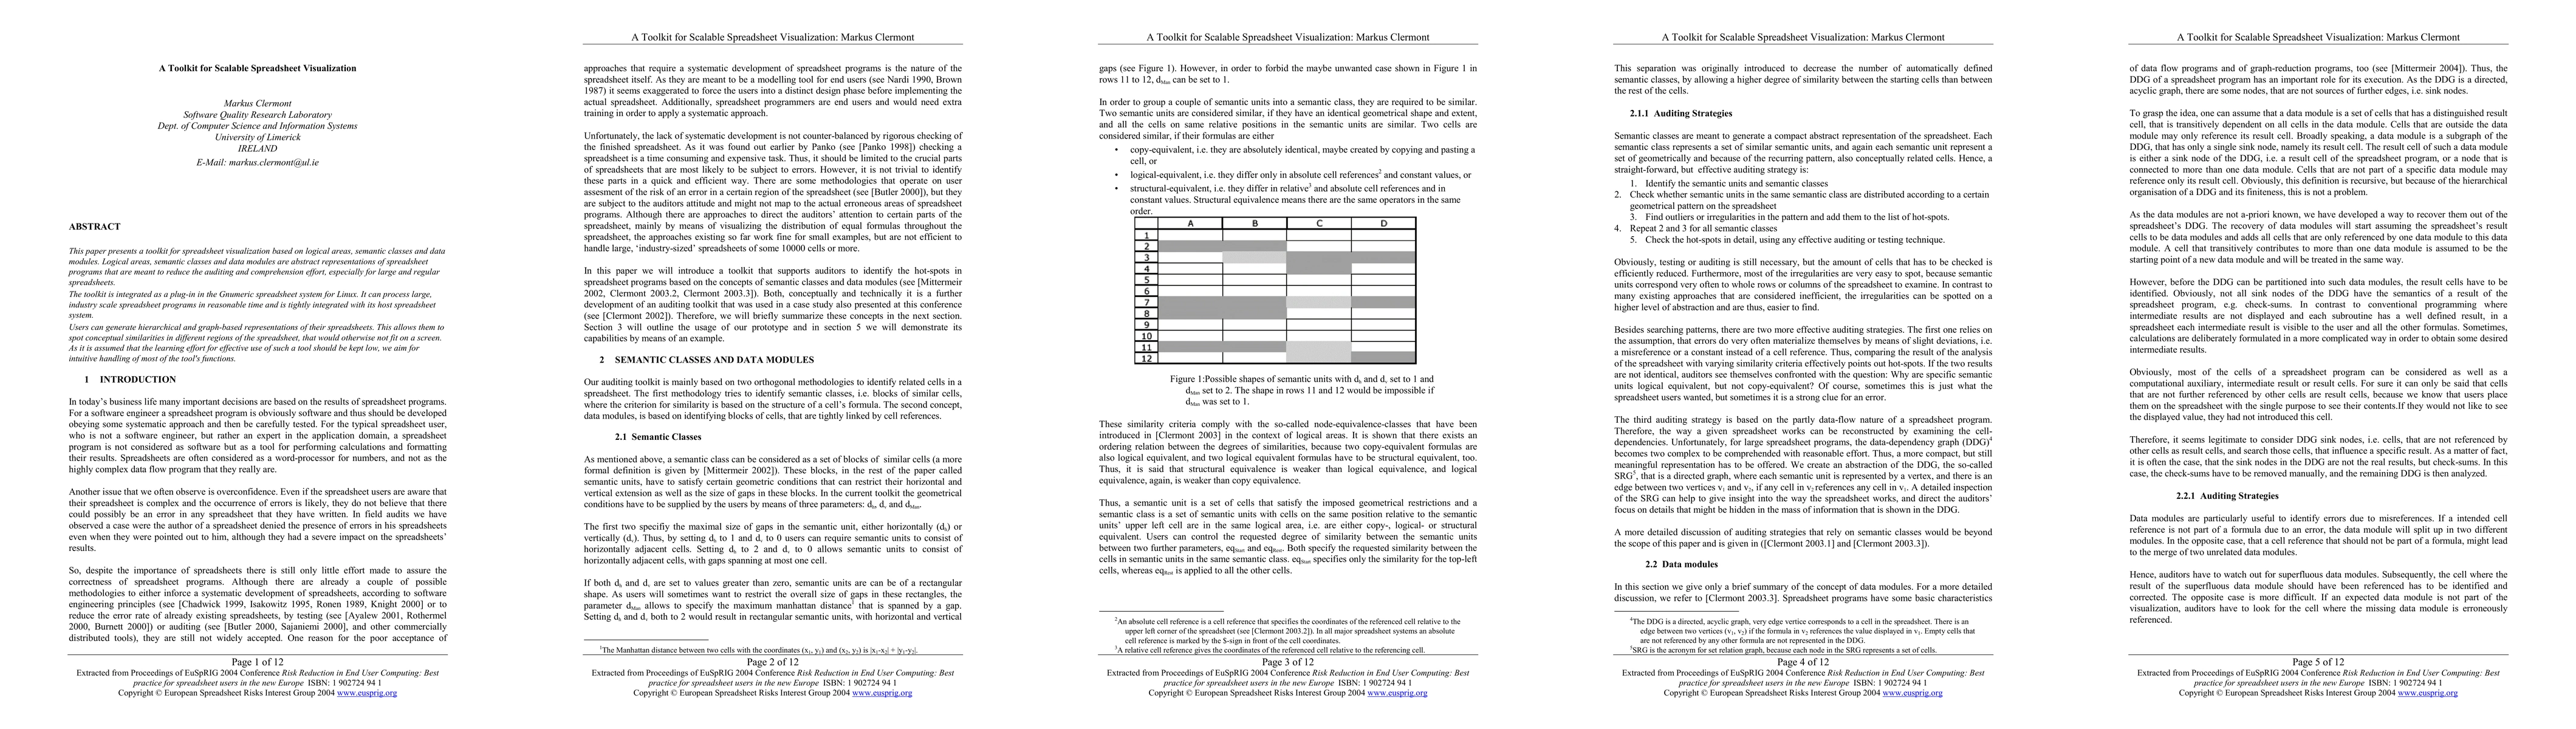
This paper presents a toolkit for spreadsheet visualization based on logical areas, semantic classes and data modules. Logical areas, semantic classes and data modules are abstract representations of spreadsheet programs that are meant to reduce the auditing and comprehension effort, especially for large and regular spreadsheets. The toolkit is integrated as a plug-in in the Gnumeric spreadsheet system for Linux. It can process large, industry scale spreadsheet programs in reasonable time and is tightly integrated with its host spreadsheet system. Users can generate hierarchical and graph-based representations of their spreadsheets. This allows them to spot conceptual similarities in different regions of the spreadsheet, that would otherwise not fit on a screen. As it is assumed that the learning effort for effective use of such a tool should be kept low, we aim for intuitive handling of most of the tool's functions.
AI Key Findings
Get AI-generated insights about this paper's methodology, results, significance, and more — seven facets brought into focus.
Impact
Paper Details
PDF Preview
Key Terms
Citation Network
Current paper (gray), citations (green), references (blue)
Display is limited for performance on very large graphs.
Discussion 0