ArxivLens

Quick Summary:

Summary: Oculus Excel Visualizer offers a point-and-click method for visualizing Excel data, enhancing analytic insight and validation by reusing existing spreadsheet layouts and formatting. This tool aims to simplify the interpretation of large datasets through content visualization.

Journal Reference: Proc. European Spreadsheet Risks Int. Grp. (EuSpRIG) 2006 175-183 ISBN:1-905617-08-9
arXiv Id: 0803.0166
Comments: 10 Pages, 11 Colour Figures
Date Published: 2008-03-10
Date Updated: 2008-03-10

Categories:

Key Terms (TF-IDF):

layout (0.358)
amounts (0.332)
validation (0.298)
insight (0.293)
data (0.282)
content (0.269)
analytic (0.269)
visual (0.266)
uses (0.246)
experiment (0.245)
directly (0.234)
provides (0.200)
point (0.186)
large (0.150)
present (0.144)
License: http://arxiv.org/licenses/nonexclusive-distrib/1.0/

Summary:

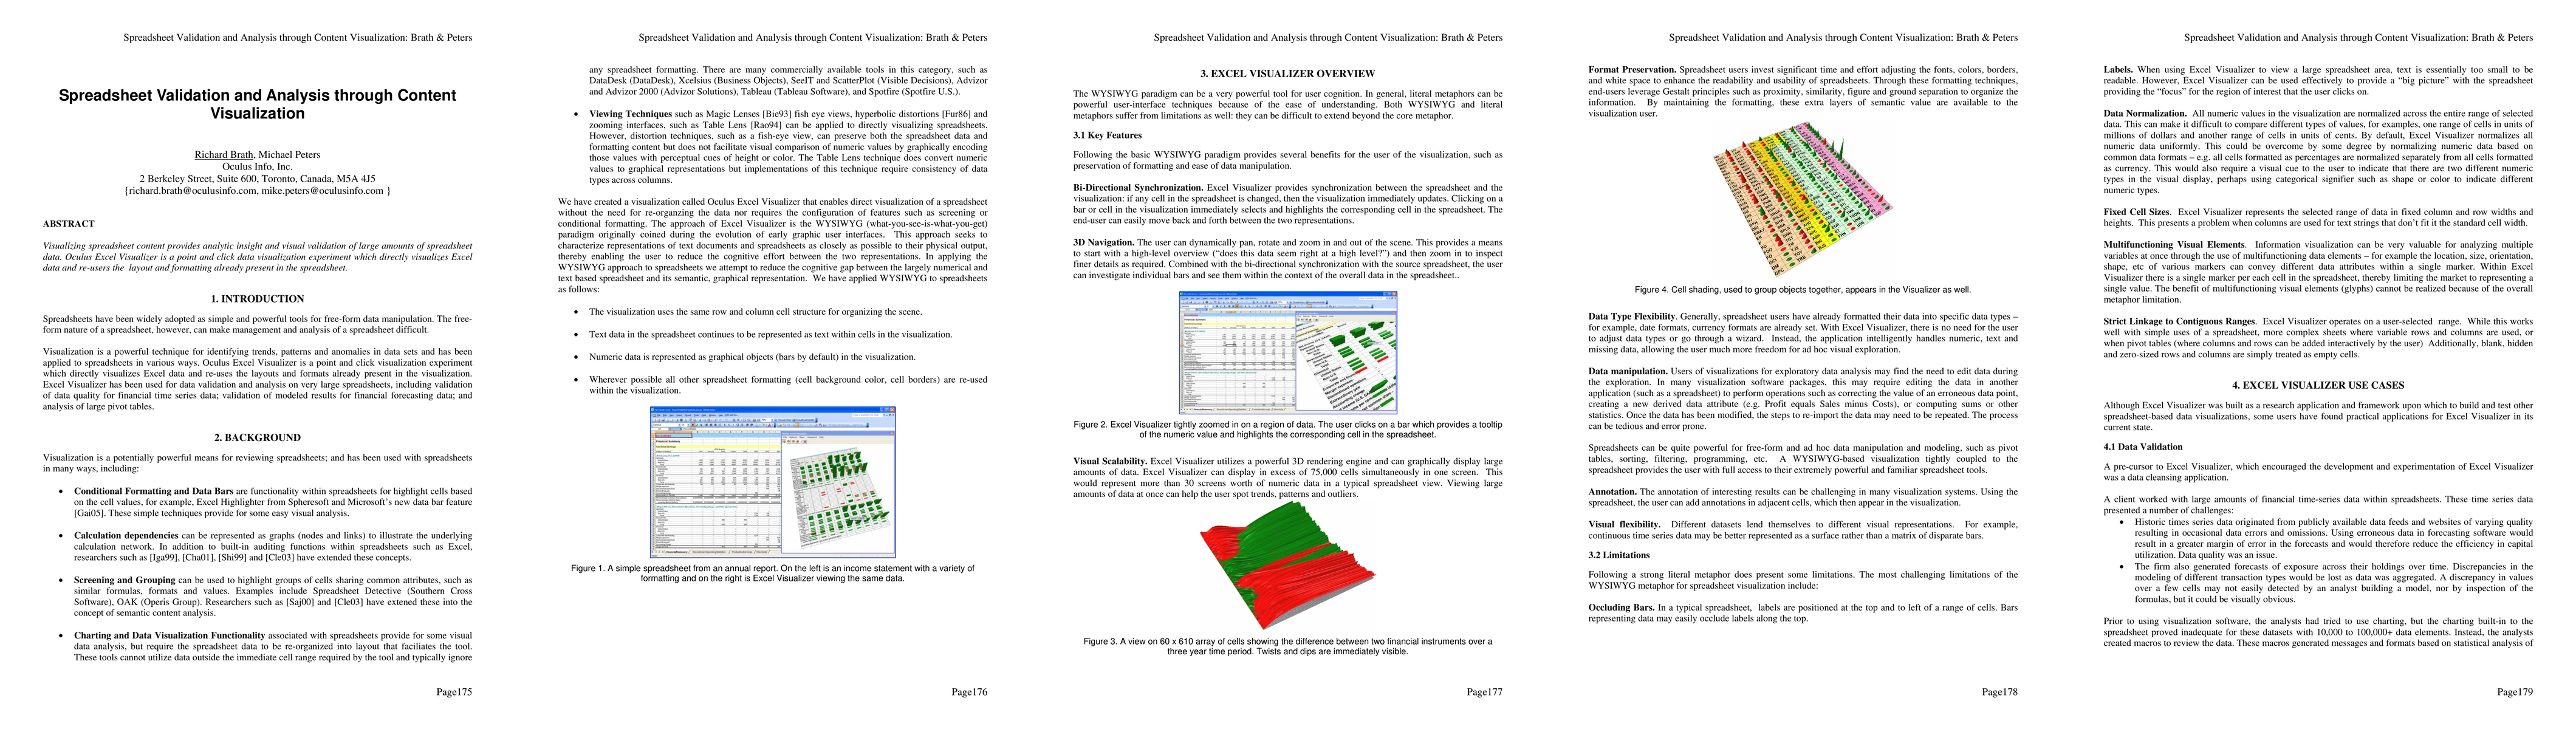
Visualizing spreadsheet content provides analytic insight and visual validation of large amounts of spreadsheet data. Oculus Excel Visualizer is a point and click data visualization experiment which directly visualizes Excel data and re-uses the layout and formatting already present in the spreadsheet.

Citation & Reference Network Visualization

This graph shows how this paper is connected to other research. The current paper is shown in dark gray, papers that cite it are in green, and papers it references are in blue. You can:

Current Paper
Papers citing this work (Citations)
Papers cited by this work (References)

• Hover over any node to see the paper title

• Click a node to view that paper's details

• Drag nodes to rearrange the graph

• Use the zoom controls (bottom right) to zoom in/out

Citations and References

Title Authors Year Actions
Towards User Assistance for Documents via Interactional Semantic Technology
A. Kohlhase
2010
View Paper
What we understand is what we get: Assessment in Spreadsheets
A. Kohlhase, M. Kohlhase
2010
View Paper
Facilitating Efficient Integrated Semantic Web Search with Visualization and Data Mining Techniques
S. Jayanthi, S. Prema
2010
View Paper
Metrics-Based Spreadsheet Visualization: Support for Focused Maintenance
K. Hodnigg, R. Mittermeir
2008
View Paper
Metrics-Based Spreadsheet Visualization
K. Hodnigg, R. Mittermeir, K. Hodnigg, R. Mittermeir
2008
View Paper
Specification, Transformation, Navigation Special Issue Dedicated to Bernd Krieg-brückner on the Occasion of His 60th Birthday Spreadsheets with a Semantic Layer Spreadsheets with a Semantic Layer
A. Kohlhase, M. Kohlhase
View Paper

Comments (0)

This website uses cookies to ensure you get the best experience. Learn more