A user study of visualisations of spatio-temporal eye tracking data
Publication
Metrics
AI Quick Summary
This study compared four spatio-temporal visualization techniques for eye movement data, focusing on accuracy in interpreting different types of questions based on two data sets. Results showed that visualizations incorporating area of interest information generally led to higher accuracy, indicating that no single visualization is best for all scenarios; thus, user studies may help determine the optimal visualization for specific data sets and research questions.
Paper Preview
Abstract
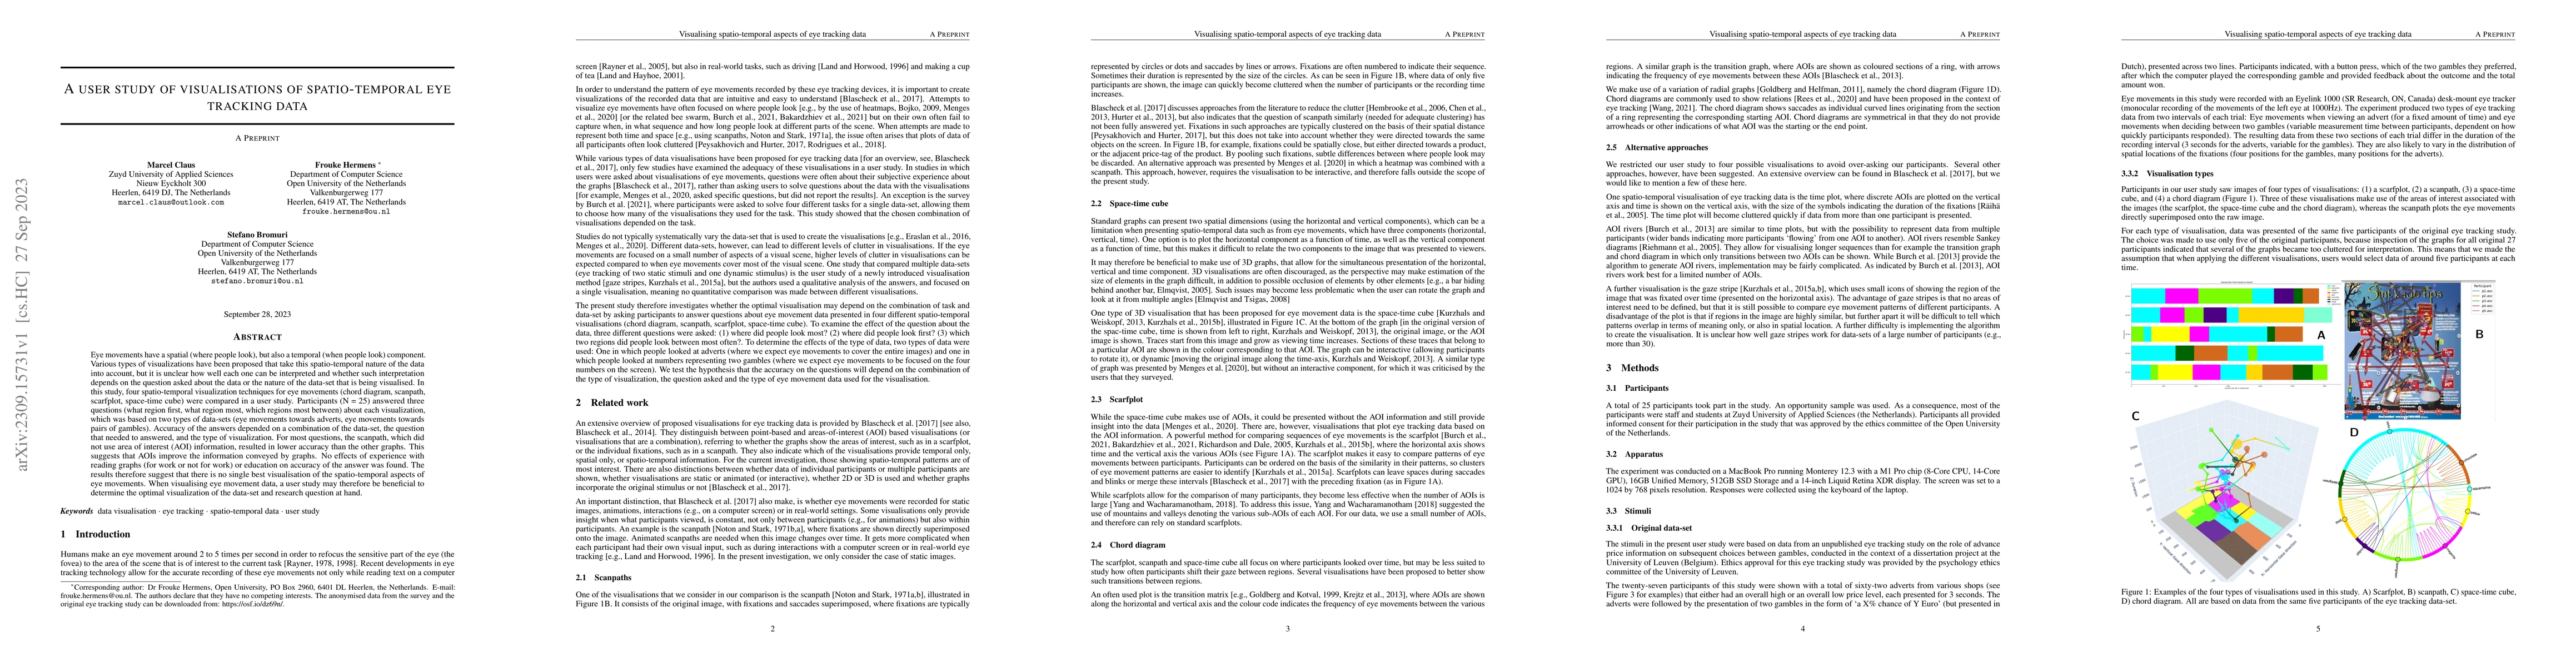
Eye movements have a spatial (where people look), but also a temporal (when people look) component. Various types of visualizations have been proposed that take this spatio-temporal nature of the data into account, but it is unclear how well each one can be interpreted and whether such interpretation depends on the question asked about the data or the nature of the data-set that is being visualised. In this study, four spatio-temporal visualization techniques for eye movements (chord diagram, scanpath, scarfplot, space-time cube) were compared in a user study. Participants (N = 25) answered three questions (what region first, what region most, which regions most between) about each visualization, which was based on two types of data-sets (eye movements towards adverts, eye movements towards pairs of gambles). Accuracy of the answers depended on a combination of the data-set, the question that needed to answered, and the type of visualization. For most questions, the scanpath, which did not use area of interest (AOI) information, resulted in lower accuracy than the other graphs. This suggests that AOIs improve the information conveyed by graphs. No effects of experience with reading graphs (for work or not for work) or education on accuracy of the answer was found. The results therefore suggest that there is no single best visualisation of the spatio-temporal aspects of eye movements. When visualising eye movement data, a user study may therefore be beneficial to determine the optimal visualization of the data-set and research question at hand.
AI Key Findings
Get AI-generated insights about this paper's methodology, results, significance, and more — seven facets brought into focus.
Impact
Paper Details
Authors
PDF Preview
Key Terms
Citation Network
Current paper (gray), citations (green), references (blue)
Display is limited for performance on very large graphs.
Discussion 0