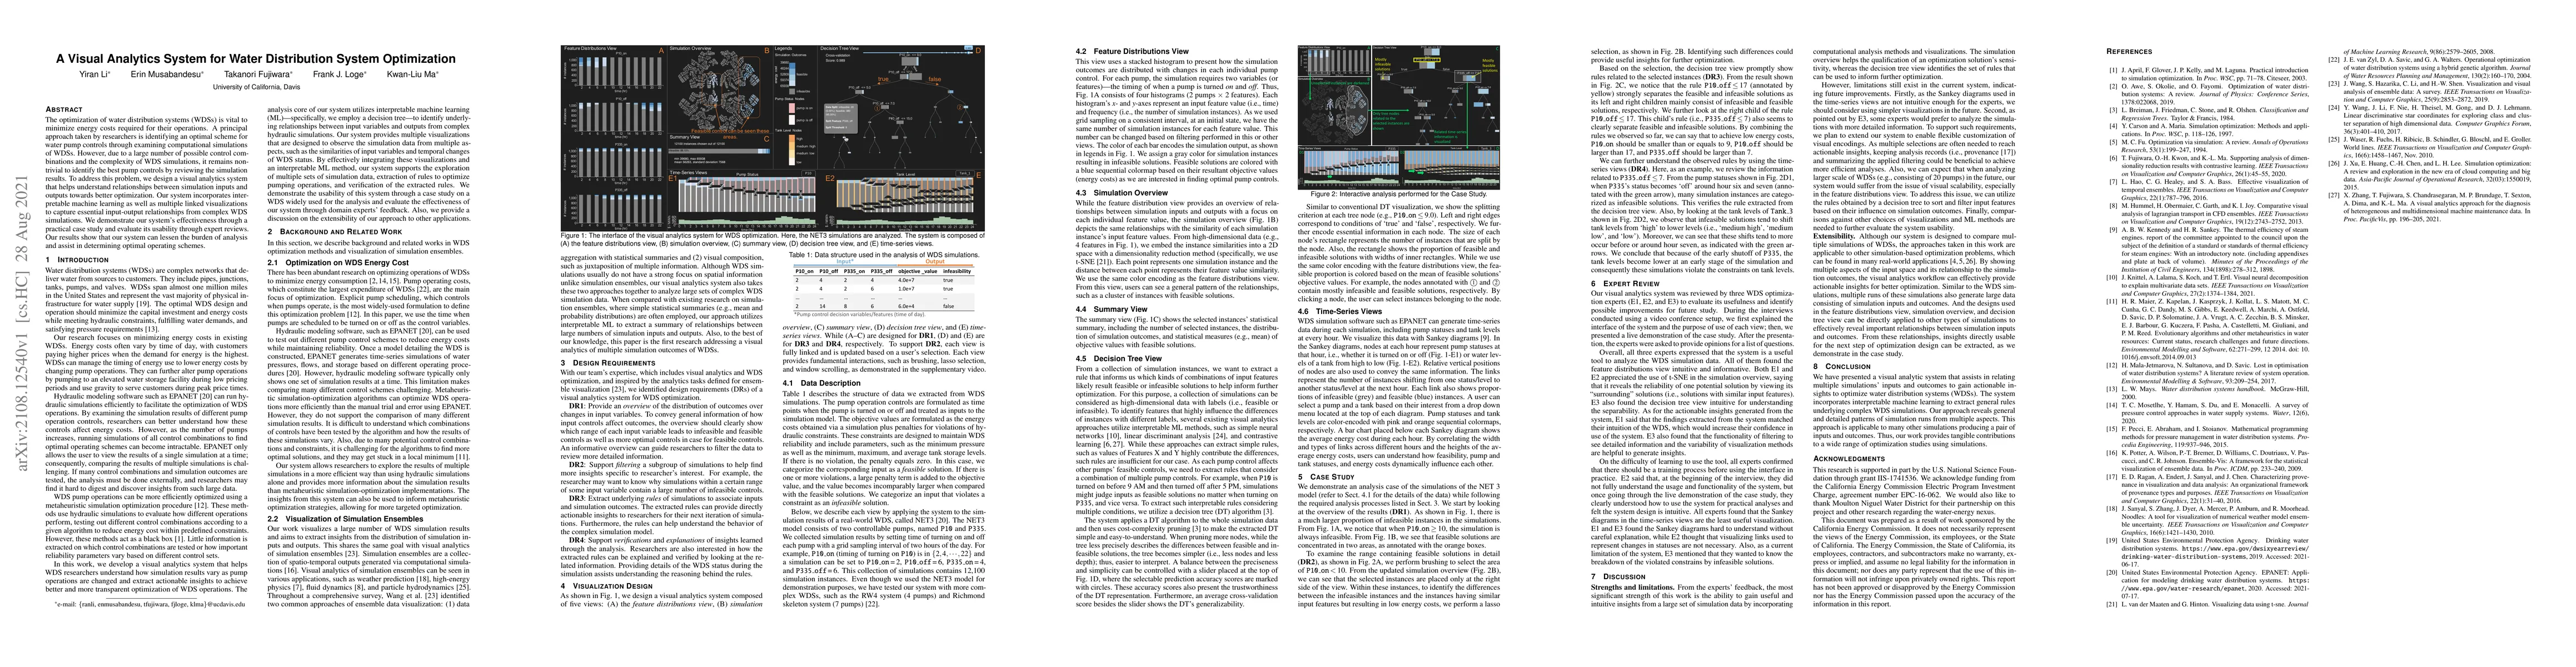
A Visual Analytics System for Water Distribution System Optimization
Publication
Metrics
AI Quick Summary
A new visual analytics system helps optimize water distribution systems by analyzing relationships between inputs and outputs through machine learning and linked visualizations, reducing the burden of analysis.
Paper Preview
Abstract
The optimization of water distribution systems (WDSs) is vital to minimize energy costs required for their operations. A principal approach taken by researchers is identifying an optimal scheme for water pump controls through examining computational simulations of WDSs. However, due to a large number of possible control combinations and the complexity of WDS simulations, it remains non-trivial to identify the best pump controls by reviewing the simulation results. To address this problem, we design a visual analytics system that helps understand relationships between simulation inputs and outputs towards better optimization. Our system incorporates interpretable machine learning as well as multiple linked visualizations to capture essential input-output relationships from complex WDS simulations. We demonstrate our system's effectiveness through a practical case study and evaluate its usability through expert reviews. Our results show that our system can lessen the burden of analysis and assist in determining optimal operating schemes.
AI Key Findings
Get AI-generated insights about this paper's methodology, results, significance, and more — seven facets brought into focus.
Impact
Paper Details
Authors
PDF Preview
Key Terms
Citation Network
Current paper (gray), citations (green), references (blue)
Display is limited for performance on very large graphs.
Discussion 0