HisVA: A Visual Analytics System for Studying History
Publication
Metrics
AI Quick Summary
This research paper presents HisVA, a visual analytics system that enables students to explore historical events from Wikipedia in a more effective way, leading to a deeper understanding of history.
Paper Preview
Abstract
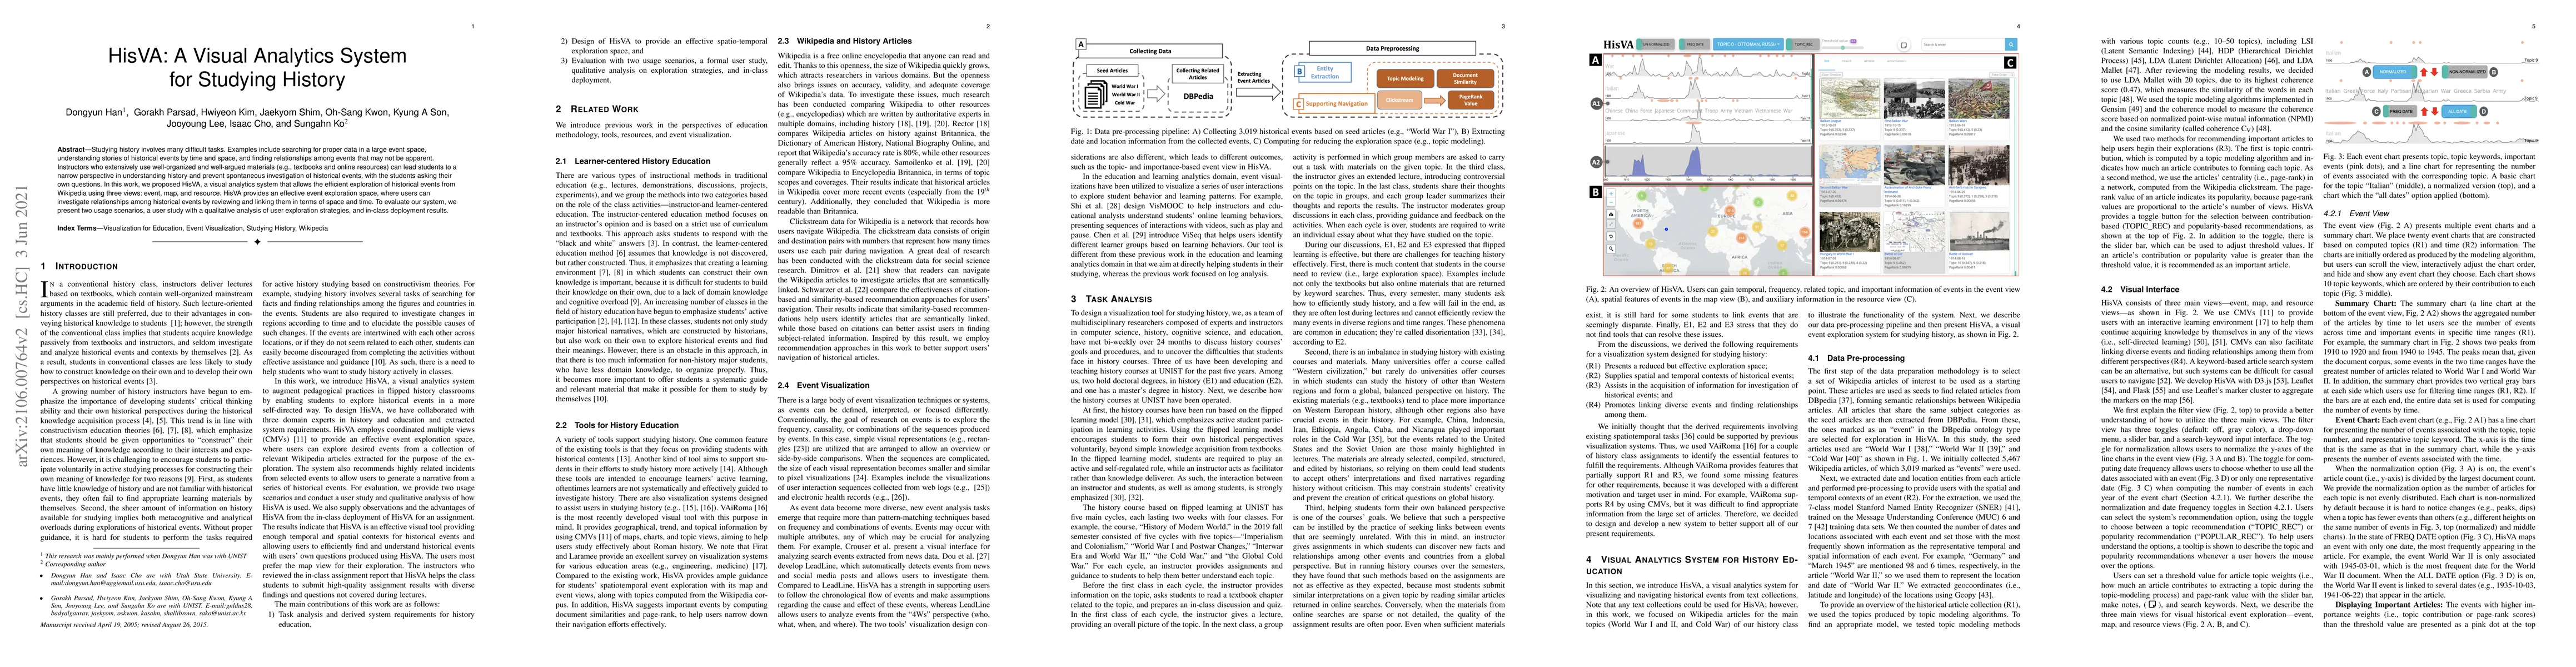
Studying history involves many difficult tasks. Examples include searching for proper data in a large event space, understanding stories of historical events by time and space, and finding relationships among events that may not be apparent. Instructors who extensively use well-organized and well-argued materials (e.g., textbooks and online resources) can lead students to a narrow perspective in understanding history and prevent spontaneous investigation of historical events, with the students asking their own questions. In this work, we proposed HisVA, a visual analytics system that allows the efficient exploration of historical events from Wikipedia using three views: event, map, and resource. HisVA provides an effective event exploration space, where users can investigate relationships among historical events by reviewing and linking them in terms of space and time. To evaluate our system, we present two usage scenarios, a user study with a qualitative analysis of user exploration strategies, and %expert feedback with in-class deployment results.
AI Key Findings
Get AI-generated insights about this paper's methodology, results, significance, and more — seven facets brought into focus.
Impact
Paper Details
Authors
PDF Preview
Key Terms
Citation Network
Current paper (gray), citations (green), references (blue)
Display is limited for performance on very large graphs.
Discussion 0