Advanced Python Performance Monitoring with Score-P
Publication
Metrics
AI Quick Summary
This paper presents an approach to enhance Python performance monitoring using the \scorep instrumentation framework, addressing the limitations of standard tools for highly parallel Python applications. The study concludes with an analysis of the overhead introduced by the new monitoring solution.
Paper Preview
Abstract
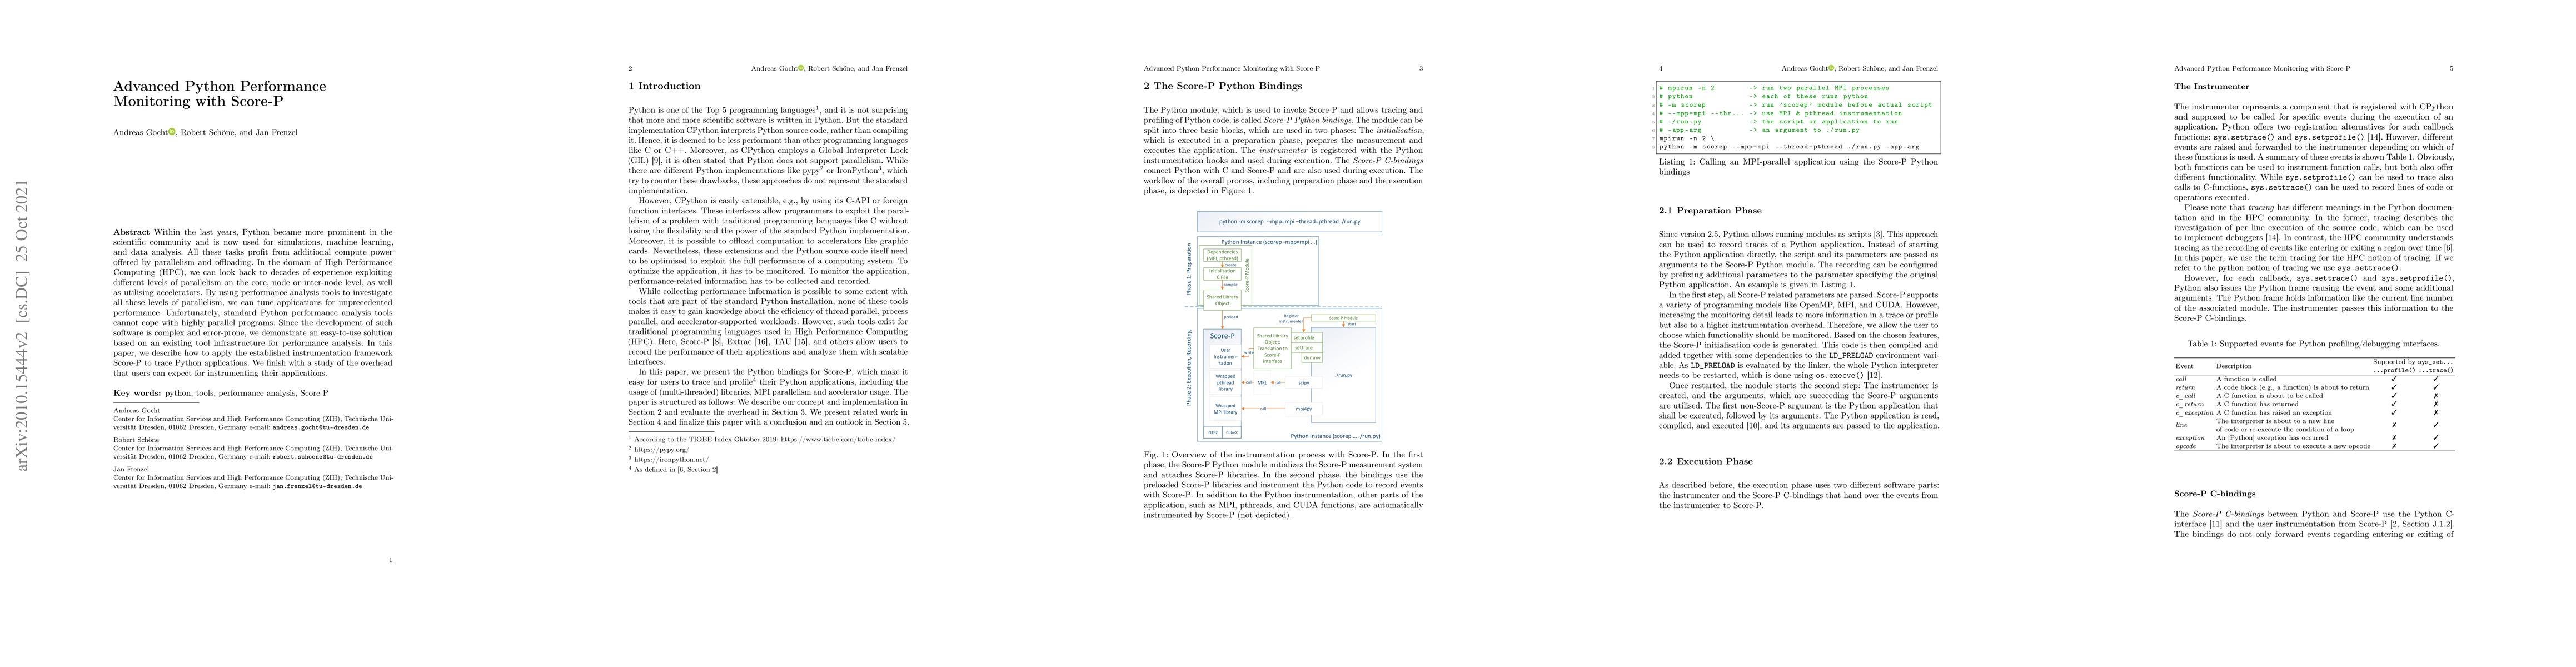
Within the last years, Python became more prominent in the scientific community and is now used for simulations, machine learning, and data analysis. All these tasks profit from additional compute power offered by parallelism and offloading. In the domain of High Performance Computing (HPC), we can look back to decades of experience exploiting different levels of parallelism on the core, node or inter-node level, as well as utilising accelerators. By using performance analysis tools to investigate all these levels of parallelism, we can tune applications for unprecedented performance. Unfortunately, standard Python performance analysis tools cannot cope with highly parallel programs. Since the development of such software is complex and error-prone, we demonstrate an easy-to-use solution based on an existing tool infrastructure for performance analysis. In this paper, we describe how to apply the established instrumentation framework \scorep to trace Python applications. We finish with a study of the overhead that users can expect for instrumenting their applications.
AI Key Findings
Get AI-generated insights about this paper's methodology, results, significance, and more — seven facets brought into focus.
Impact
Paper Details
Authors
PDF Preview
Key Terms
Citation Network
Current paper (gray), citations (green), references (blue)
Display is limited for performance on very large graphs.
Discussion 0