Publication
Metrics
AI Quick Summary
This paper introduces Scalene, a specialized Python profiler that simultaneously profiles CPU, memory, and GPU usage with low overhead. Scalene's innovative algorithms help identify performance bottlenecks and memory leaks, leading to significant optimizations and memory savings for Python developers.
Paper Preview
Abstract
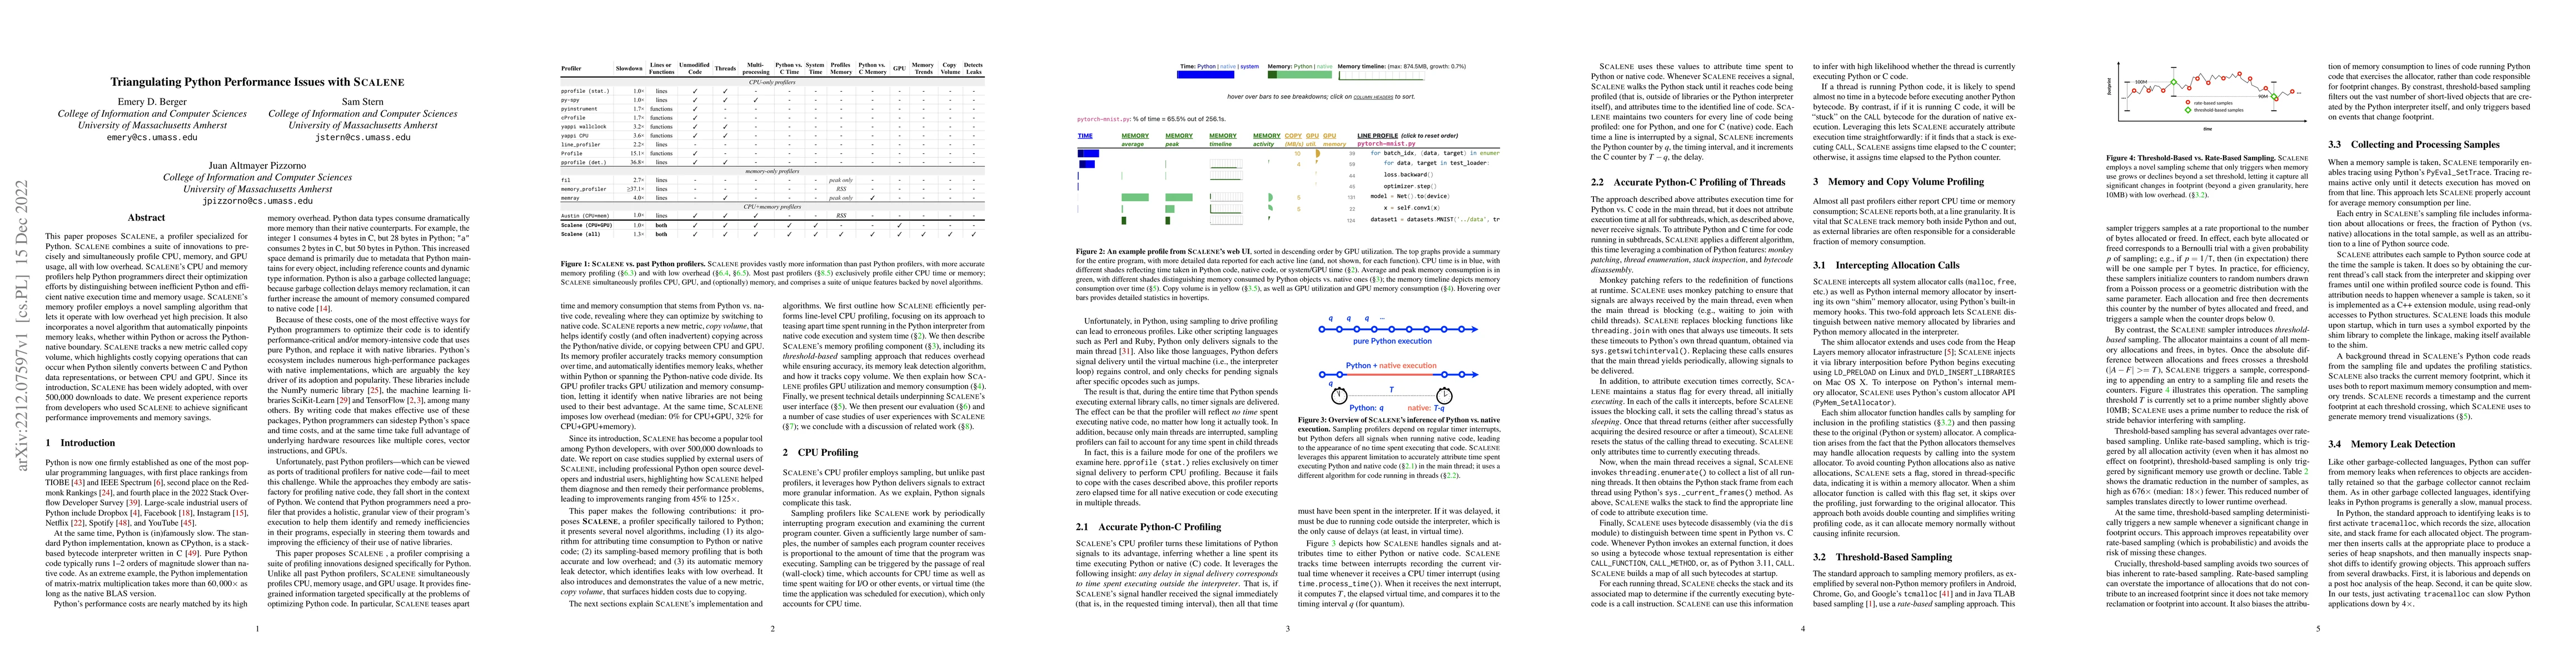
This paper proposes Scalene, a profiler specialized for Python. Scalene combines a suite of innovations to precisely and simultaneously profile CPU, memory, and GPU usage, all with low overhead. Scalene's CPU and memory profilers help Python programmers direct their optimization efforts by distinguishing between inefficient Python and efficient native execution time and memory usage. Scalene's memory profiler employs a novel sampling algorithm that lets it operate with low overhead yet high precision. It also incorporates a novel algorithm that automatically pinpoints memory leaks, whether within Python or across the Python-native boundary. Scalene tracks a new metric called copy volume, which highlights costly copying operations that can occur when Python silently converts between C and Python data representations, or between CPU and GPU. Since its introduction, Scalene has been widely adopted, with over 500,000 downloads to date. We present experience reports from developers who used Scalene to achieve significant performance improvements and memory savings.
AI Key Findings
Get AI-generated insights about this paper's methodology, results, significance, and more — seven facets brought into focus.
Impact
Paper Details
Authors
PDF Preview
Key Terms
Citation Network
Current paper (gray), citations (green), references (blue)
Display is limited for performance on very large graphs.
Discussion 0