Aggregate-Driven Trace Visualizations for Performance Debugging
Publication
Metrics
AI Quick Summary
TraVista is a tool for debugging performance issues in cloud systems by comparing a single trace against aggregate data, addressing challenges in identifying, visualizing, and processing trace data. It enhances Gantt chart visualizations with metric, temporal, and structure aggregate data for effective diagnosis.
Paper Preview
Abstract
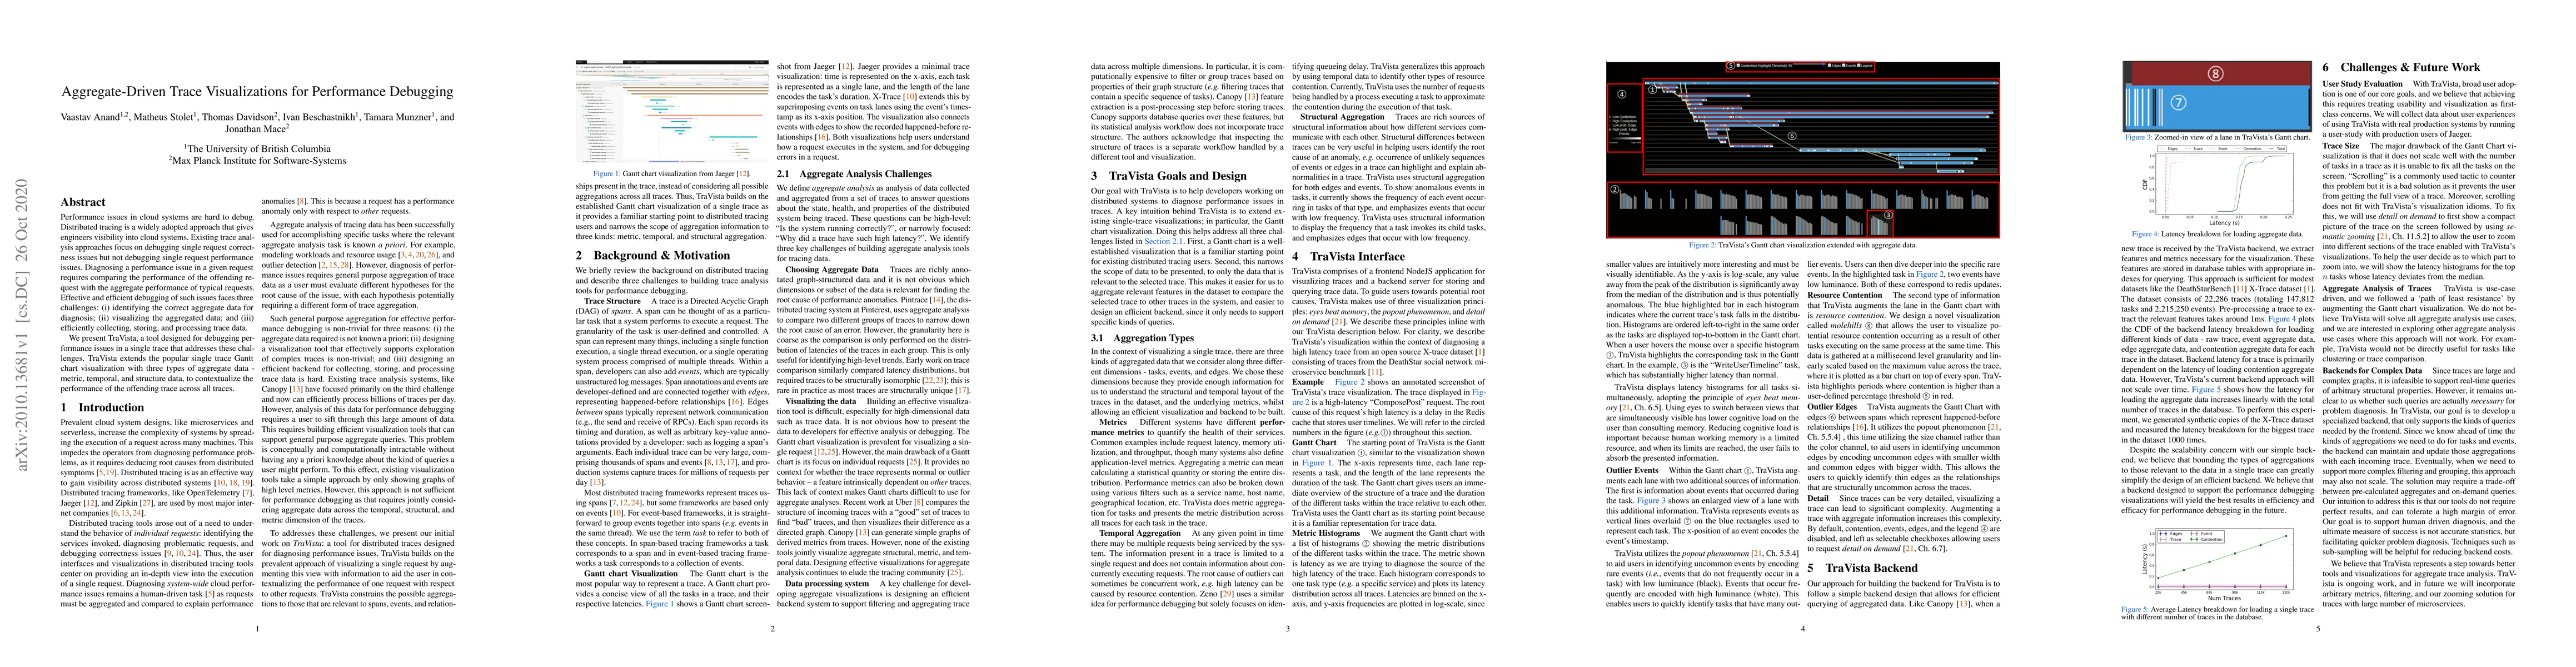
Performance issues in cloud systems are hard to debug. Distributed tracing is a widely adopted approach that gives engineers visibility into cloud systems. Existing trace analysis approaches focus on debugging single request correctness issues but not debugging single request performance issues. Diagnosing a performance issue in a given request requires comparing the performance of the offending request with the aggregate performance of typical requests. Effective and efficient debugging of such issues faces three challenges: (i) identifying the correct aggregate data for diagnosis; (ii) visualizing the aggregated data; and (iii) efficiently collecting, storing, and processing trace data. We present TraVista, a tool designed for debugging performance issues in a single trace that addresses these challenges. TraVista extends the popular single trace Gantt chart visualization with three types of aggregate data - metric, temporal, and structure data, to contextualize the performance of the offending trace across all traces.
AI Key Findings
Get AI-generated insights about this paper's methodology, results, significance, and more — seven facets brought into focus.
Impact
Paper Details
Authors
PDF Preview
Key Terms
Citation Network
Current paper (gray), citations (green), references (blue)
Display is limited for performance on very large graphs.
Discussion 0