Publication
Metrics
AI Quick Summary
This paper proposes a novel visualization technique to enhance the analysis of microservices performance by enabling aggregate performance analysis across multiple end-to-end requests, addressing the limitations of current distributed tracing tools. The approach builds on existing techniques for comparing request pairs and extends it for comprehensive system performance insights.
Paper Preview
Abstract
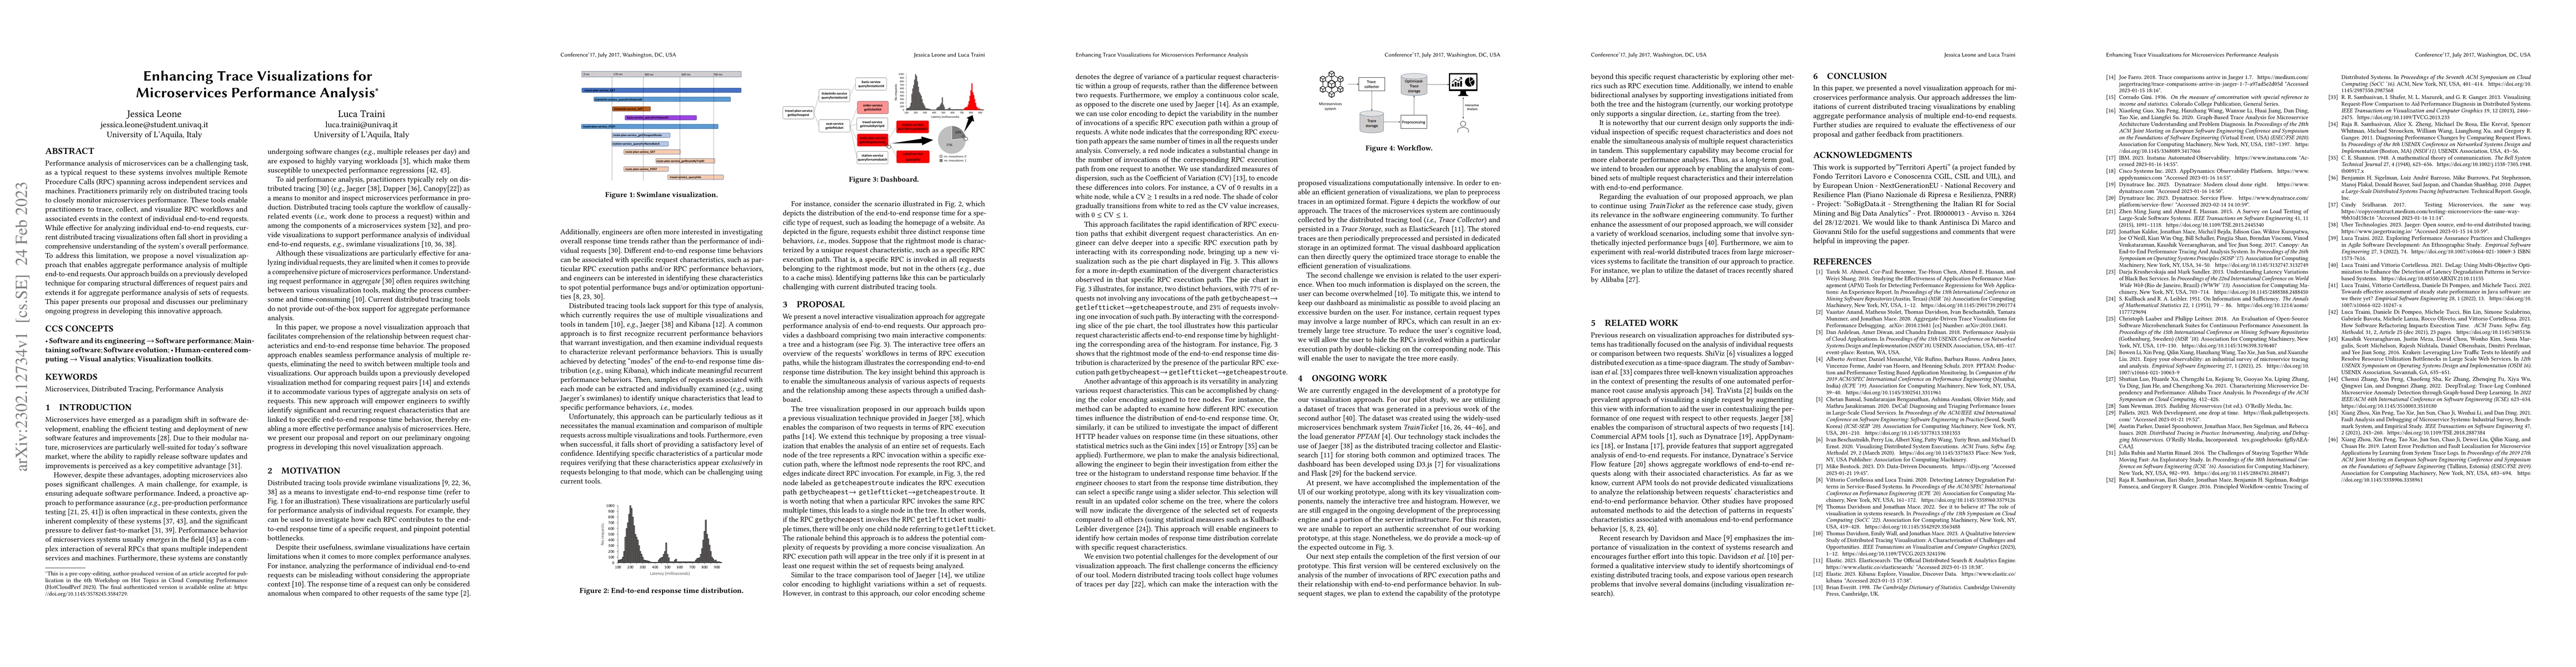
Performance analysis of microservices can be a challenging task, as a typical request to these systems involves multiple Remote Procedure Calls (RPC) spanning across independent services and machines. Practitioners primarily rely on distributed tracing tools to closely monitor microservices performance. These tools enable practitioners to trace, collect, and visualize RPC workflows and associated events in the context of individual end-to-end requests. While effective for analyzing individual end-to-end requests, current distributed tracing visualizations often fall short in providing a comprehensive understanding of the system's overall performance. To address this limitation, we propose a novel visualization approach that enables aggregate performance analysis of multiple end-to-end requests. Our approach builds on a previously developed technique for comparing structural differences of request pairs and extends it for aggregate performance analysis of sets of requests. This paper presents our proposal and discusses our preliminary ongoing progress in developing this innovative approach.
AI Key Findings
Get AI-generated insights about this paper's methodology, results, significance, and more — seven facets brought into focus.
Impact
Paper Details
Authors
PDF Preview
Key Terms
Citation Network
Current paper (gray), citations (green), references (blue)
Display is limited for performance on very large graphs.
Discussion 0