VAMP: Visual Analytics for Microservices Performance
Publication
Metrics
AI Quick Summary
Vamp is an innovative visual analytics tool designed to facilitate comprehensive performance analysis of microservices, particularly for identifying systemic performance trends and recurrent characteristics across multiple end-to-end requests. Through interactive visualizations, Vamp aids in pinpointing significant deviations in Remote Procedure Calls and structural patterns influencing overall performance.
Paper Preview
Abstract
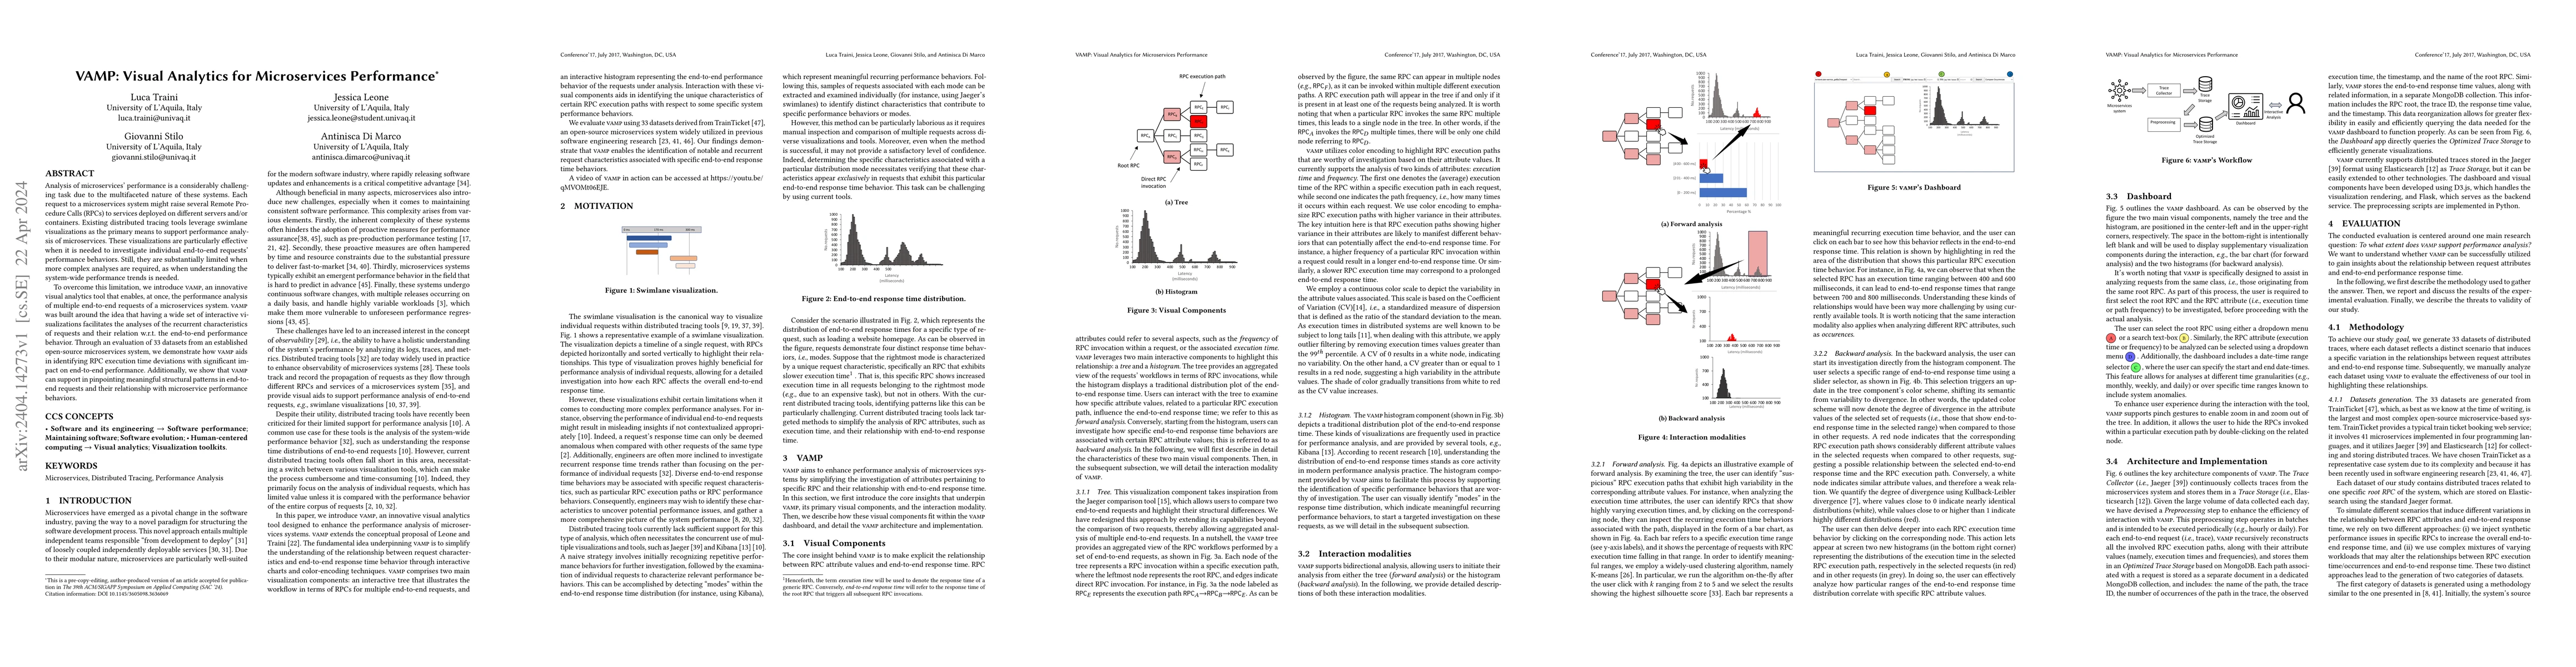
Analysis of microservices' performance is a considerably challenging task due to the multifaceted nature of these systems. Each request to a microservices system might raise several Remote Procedure Calls (RPCs) to services deployed on different servers and/or containers. Existing distributed tracing tools leverage swimlane visualizations as the primary means to support performance analysis of microservices. These visualizations are particularly effective when it is needed to investigate individual end-to-end requests' performance behaviors. Still, they are substantially limited when more complex analyses are required, as when understanding the system-wide performance trends is needed. To overcome this limitation, we introduce vamp, an innovative visual analytics tool that enables, at once, the performance analysis of multiple end-to-end requests of a microservices system. Vamp was built around the idea that having a wide set of interactive visualizations facilitates the analyses of the recurrent characteristics of requests and their relation w.r.t. the end-to-end performance behavior. Through an evaluation of 33 datasets from an established open-source microservices system, we demonstrate how vamp aids in identifying RPC execution time deviations with significant impact on end-to-end performance. Additionally, we show that vamp can support in pinpointing meaningful structural patterns in end-to-end requests and their relationship with microservice performance behaviors.
AI Key Findings
Get AI-generated insights about this paper's methodology, results, significance, and more — seven facets brought into focus.
Impact
Paper Details
Authors
PDF Preview
Key Terms
Citation Network
Current paper (gray), citations (green), references (blue)
Display is limited for performance on very large graphs.
Discussion 0