Database benchmarking is an essential method for evaluating and comparing the
performance characteristics of a database management system (DBMS). It helps
researchers and developers to evaluate the efficacy of their optimizations or
newly developed DBMS solutions. Also, companies can benefit by analyzing the
performance of DBMS under specific workloads and leveraging the result to
select the most suitable system for their needs. The proper interpretation of
raw benchmark results requires effective visualization, which helps users gain
meaningful insights. However, visualization of the results requires prior
knowledge, and existing approaches often involve time-consuming manual tasks.
This is due to the absence of a unified visual analytics system for benchmark
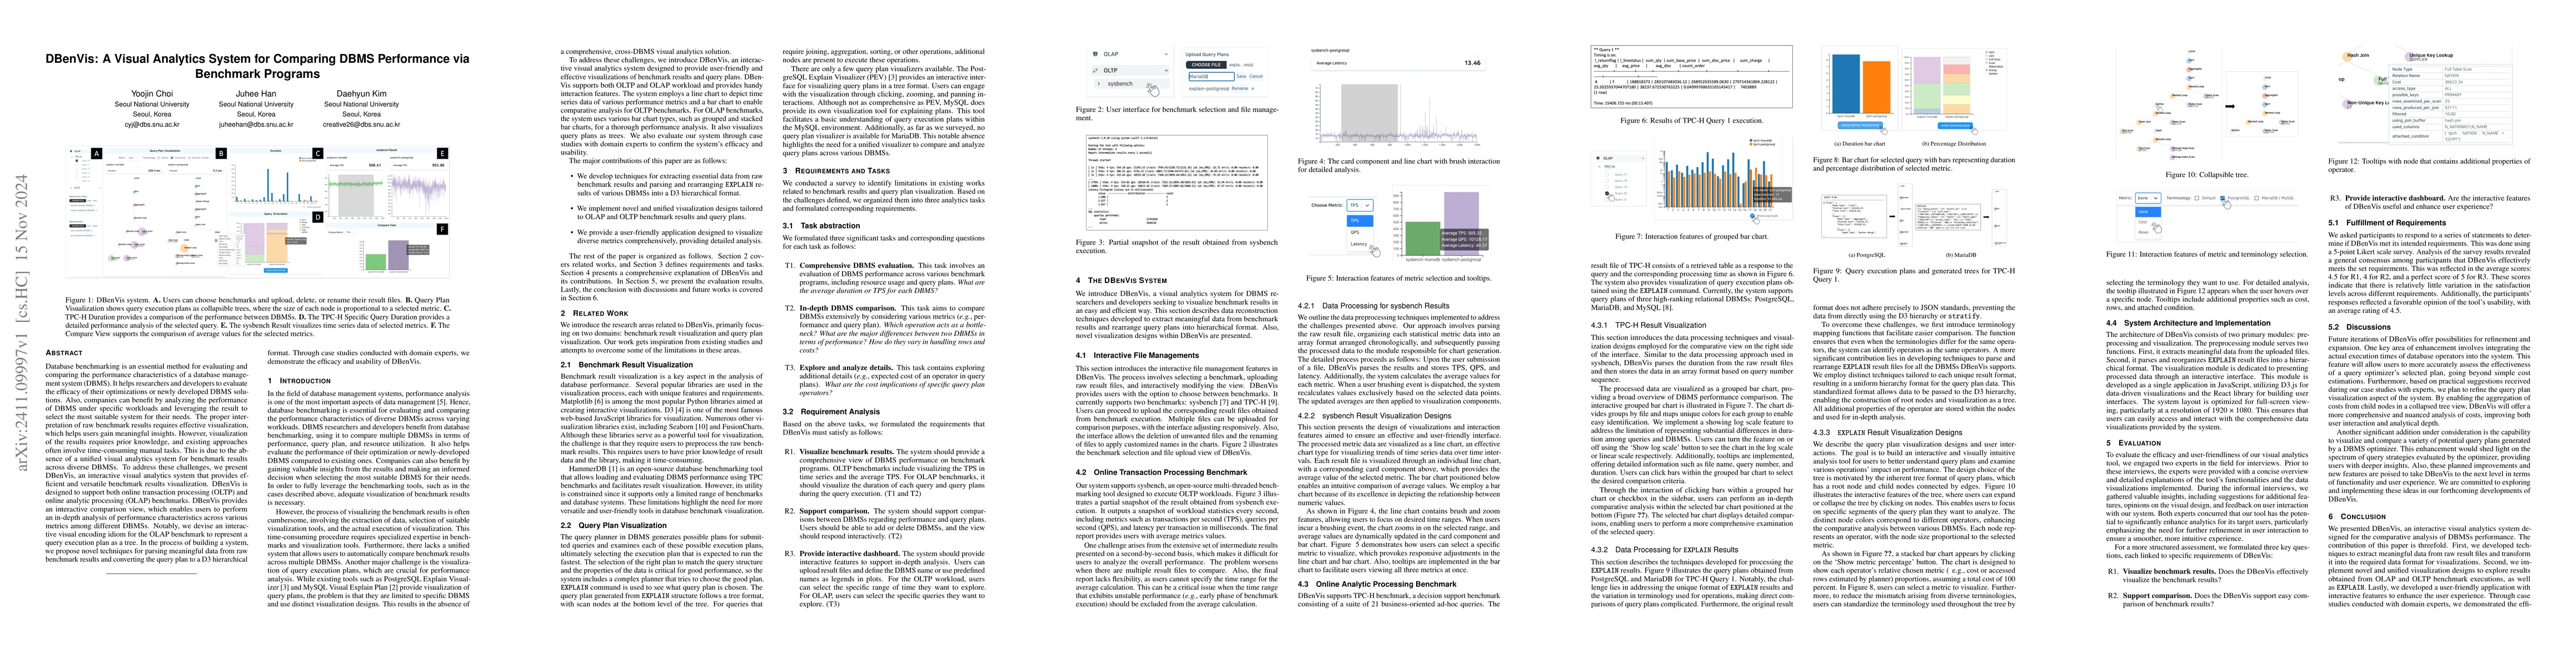
results across diverse DBMSs. To address these challenges, we present DBenVis,
an interactive visual analytics system that provides efficient and versatile
benchmark results visualization. DBenVis is designed to support both online
transaction processing (OLTP) and online analytic processing (OLAP) benchmarks.
DBenVis provides an interactive comparison view, which enables users to perform
an in-depth analysis of performance characteristics across various metrics
among different DBMSs. Notably, we devise an interactive visual encoding idiom
for the OLAP benchmark to represent a query execution plan as a tree. In the
process of building a system, we propose novel techniques for parsing
meaningful data from raw benchmark results and converting the query plan to a
D3 hierarchical format. Through case studies conducted with domain experts, we
demonstrate the efficacy and usability of DBenVis.
Discussion 0