Assessment of risk prediction models has primarily utilized measures of
discrimination, the ROC curve AUC and C-statistic. These derive from the risk
distributions of patients and nonpatients, which in turn are derived from a
population risk distribution. As greater dispersion of the population risk
distribution produces greater separation of patient and nonpatient risks
(discrimination), its parameters can be used as alternatives to the ROC curve
AUC and C-statistic. Here continuous probability distributions are employed to
develop insight into the relationship between their parameters and the ROC
curve AUC and C-statistic derived from them.
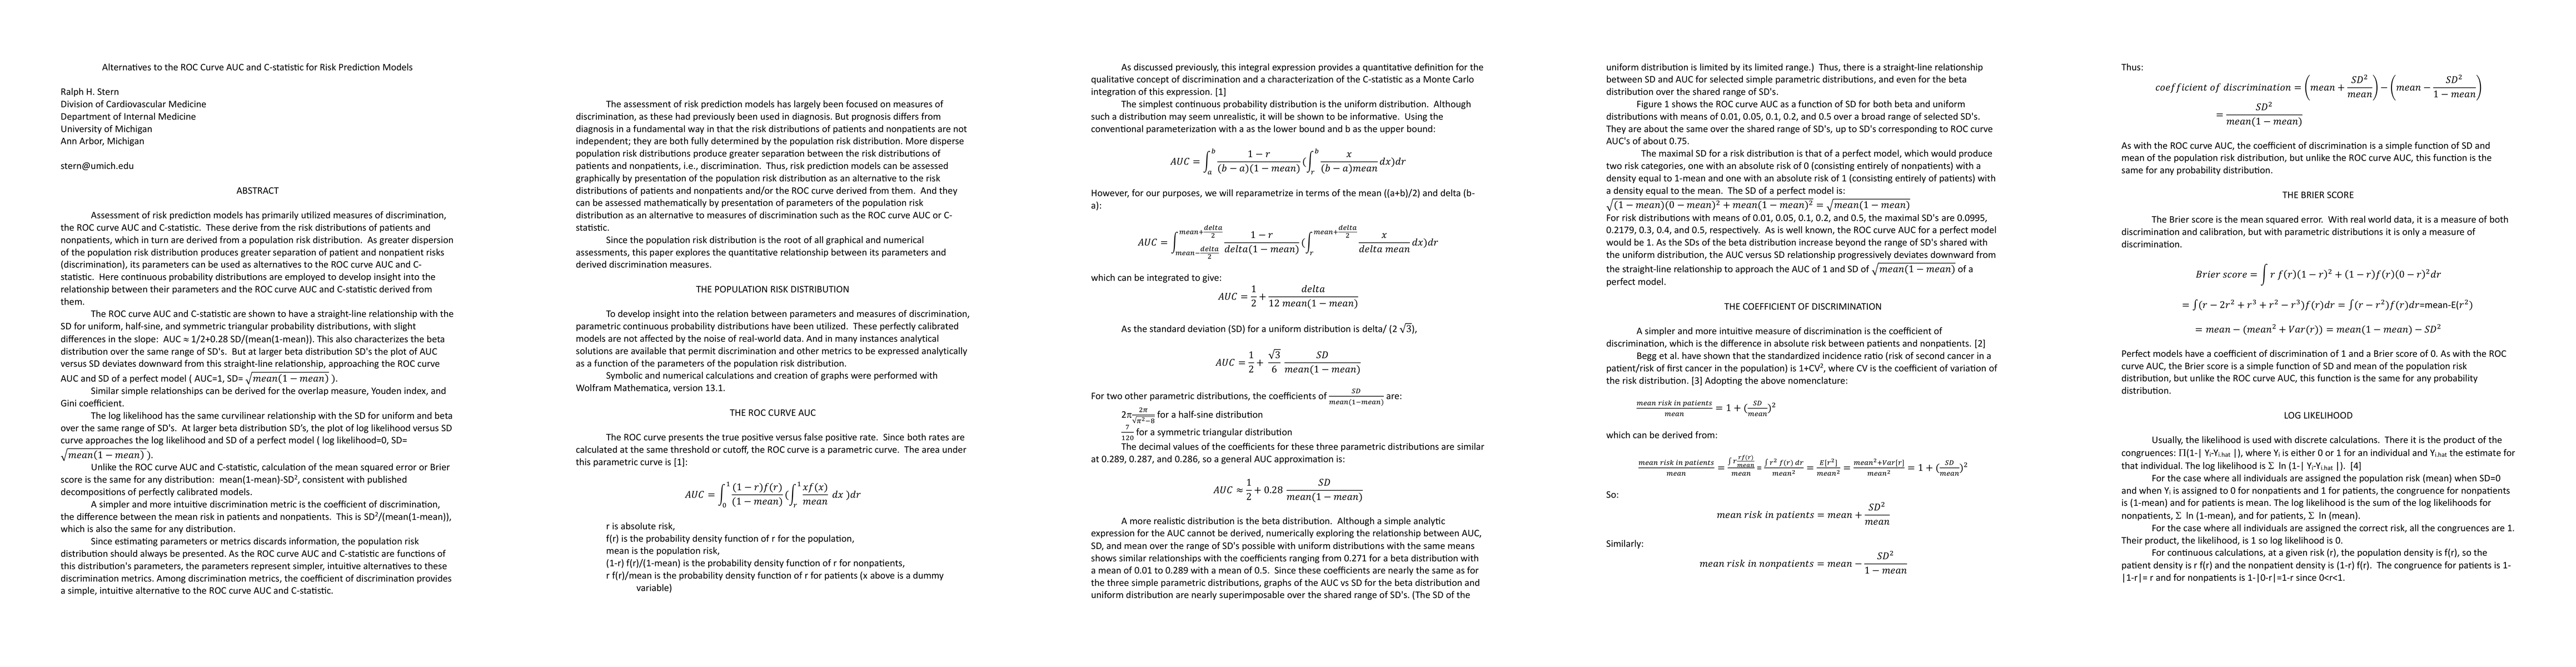
The ROC curve AUC and C-statistic are shown to have a straight-line
relationship with the SD for uniform, half-sine, and symmetric triangular
probability distributions, with slight differences in the slope: AUC approx
1/2+0.28 SD/(mean(1-mean)). This also characterizes the beta distribution over
the same range of SD's. But at larger beta distribution SD's the plot of AUC
versus SD deviates downward from this straight-line relationship, approaching
the ROC curve AUC and SD of a perfect model (AUC=1, SD= $\sqrt{\rm
mean(1-mean)}$).
A simpler and more intuitive discrimination metric is the coefficient of
discrimination, the difference between the mean risk in patients and
nonpatients. This is SD2/(mean(1-mean)), which is also the same for any
distribution. Since estimating parameters or metrics discards information, the
population risk distribution should always be presented. As the ROC curve AUC
and C-statistic are functions of this distribution's parameters, the parameters
represent simpler, intuitive alternatives to these discrimination metrics.
Among discrimination metrics, the coefficient of discrimination provides a
simple, intuitive alternative to the ROC curve AUC and C-statistic.
Discussion 0