Summary
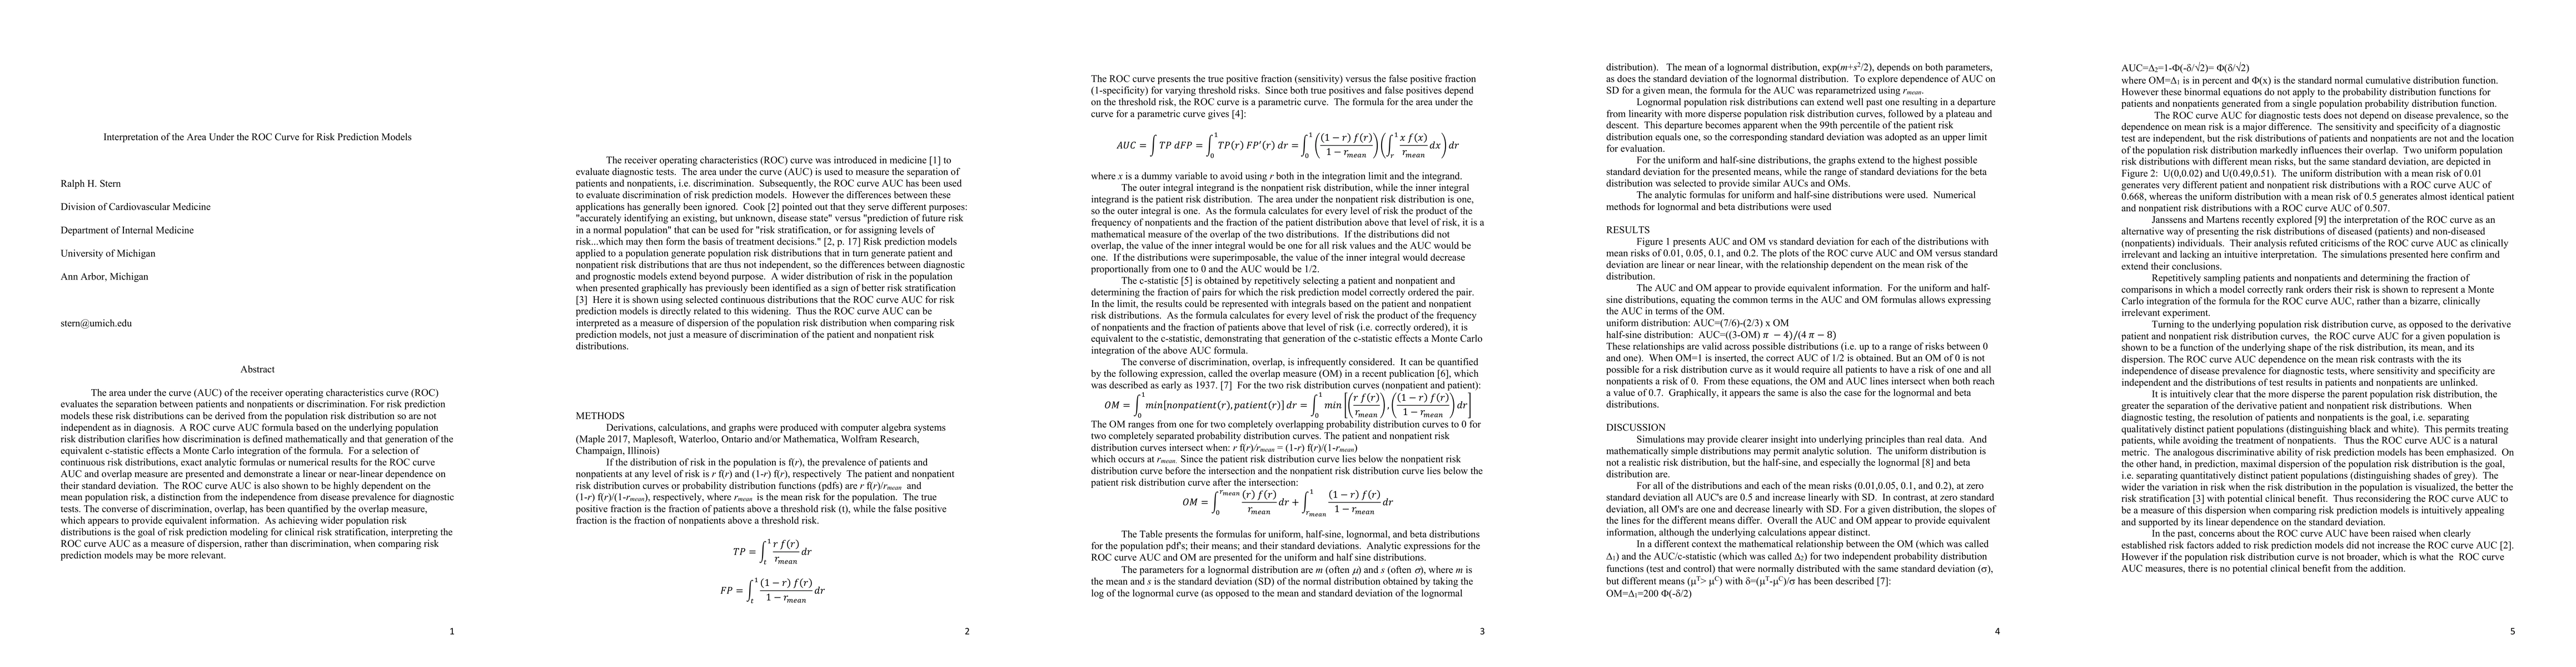
The area under the curve (AUC) of the receiver operating characteristics curve (ROC) evaluates the separation between patients and nonpatients or discrimination. For risk prediction models these risk distributions can be derived from the population risk distribution so are not independent as in diagnosis. A ROC curve AUC formula based on the underlying population risk distribution clarifies how discrimination is defined mathematically and that generation of the equivalent c-statistic effects a Monte Carlo integration of the formula. For a selection of continuous risk distributions, exact analytic formulas or numerical results for the ROC curve AUC and overlap measure are presented and demonstrate a linear or near-linear dependence on their standard deviation. The ROC curve AUC is also shown to be highly dependent on the mean population risk, a distinction from the independence from disease prevalence for diagnostic tests. The converse of discrimination, overlap, has been quantified by the overlap measure, which appears to provide equivalent information. As achieving wider population risk distributions is the goal of risk prediction modeling for clinical risk stratification, interpreting the ROC curve AUC as a measure of dispersion, rather than discrimination, when comparing risk prediction models may be more relevant.
AI Key Findings
Get AI-generated insights about this paper's methodology, results, and significance.
Paper Details
PDF Preview
Key Terms
Citation Network
Current paper (gray), citations (green), references (blue)
Display is limited for performance on very large graphs.
Similar Papers
Found 4 papers| Title | Authors | Year | Actions |
|---|
Comments (0)