Publication
Metrics
AI Quick Summary
This paper explores the tidyverse from an educator's viewpoint, emphasizing its role in teaching data science and statistics. It highlights the tidyverse's comprehensive design and functionality, which facilitates the learning process and supports the entire data science cycle, making it an effective tool for undergraduate students.
Paper Preview
Abstract
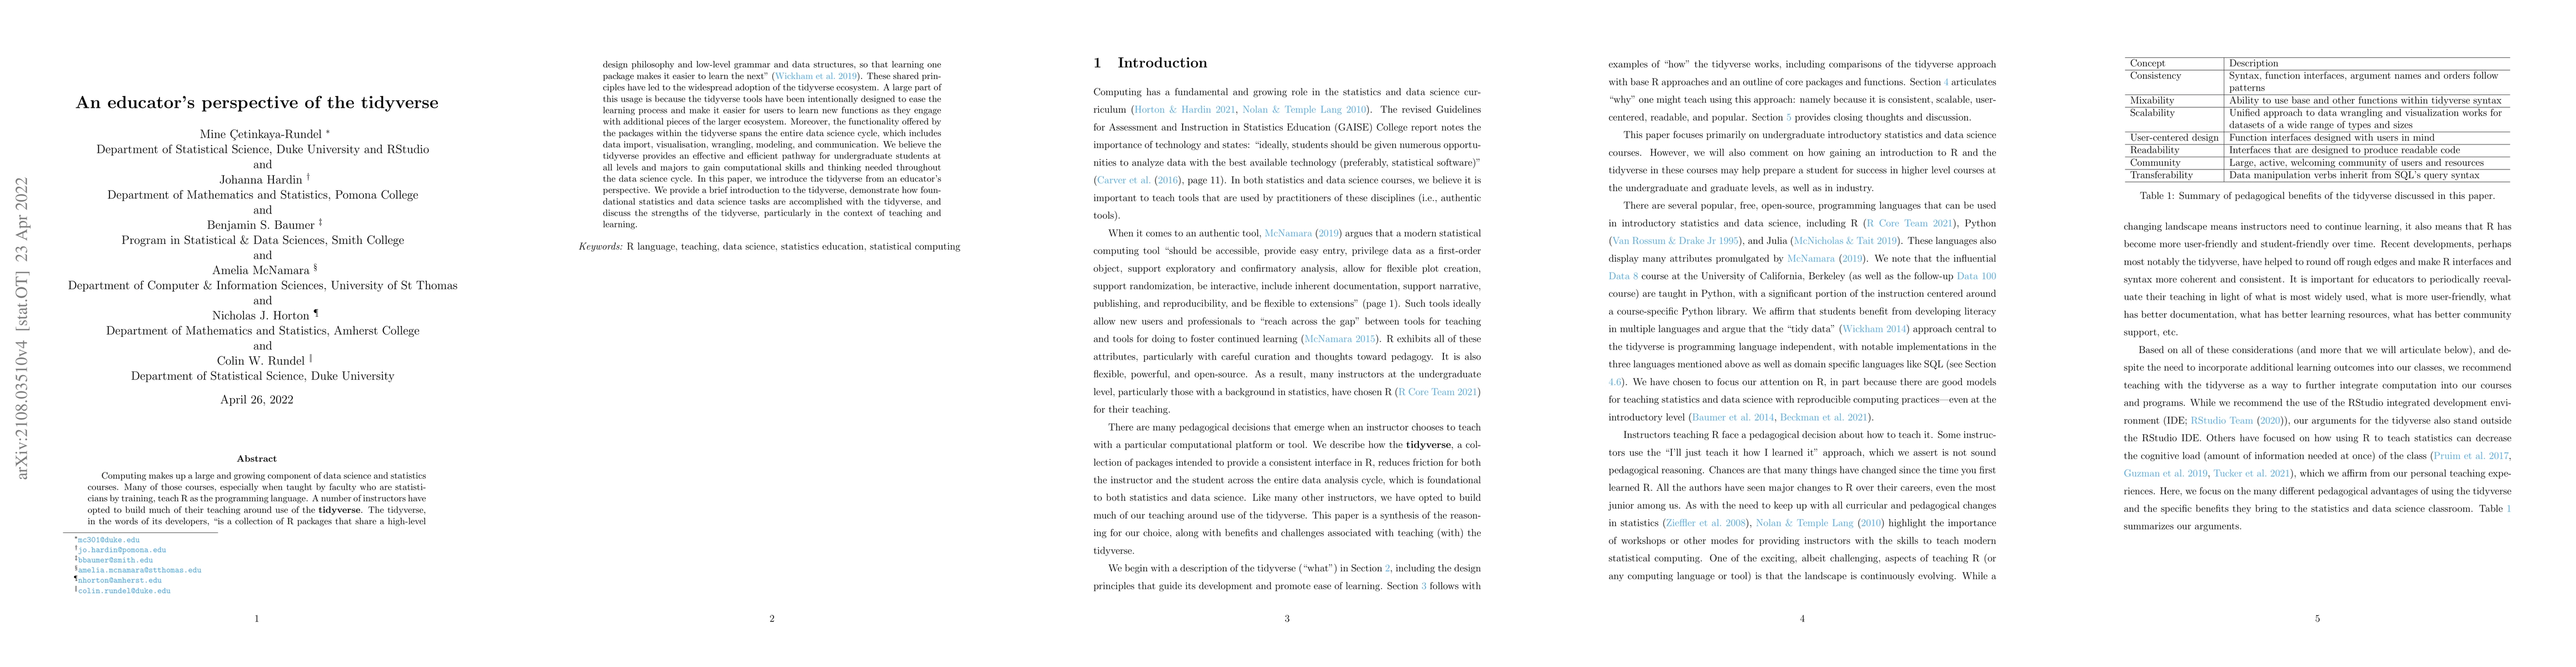
Computing makes up a large and growing component of data science and statistics courses. Many of those courses, especially when taught by faculty who are statisticians by training, teach R as the programming language. A number of instructors have opted to build much of their teaching around use of the tidyverse. The tidyverse, in the words of its developers, "is a collection of R packages that share a high-level design philosophy and low-level grammar and data structures, so that learning one package makes it easier to learn the next". These shared principles have led to the widespread adoption of the tidyverse ecosystem. A large part of this usage is because the tidyverse tools have been intentionally designed to ease the learning process and make it easier for users to learn new functions as they engage with additional pieces of the larger ecosystem. Moreover, the functionality offered by the packages within the tidyverse spans the entire data science cycle, which includes data import, visualisation, wrangling, modeling, and communication. We believe the tidyverse provides an effective and efficient pathway for undergraduate students at all levels and majors to gain computational skills and thinking needed throughout the data science cycle. In this paper, we introduce the tidyverse from an educator's perspective. We provide a brief introduction to the tidyverse, demonstrate how foundational statistics and data science tasks are accomplished with the tidyverse, and discuss the strengths of the tidyverse, particularly in the context of teaching and learning.
AI Key Findings
Get AI-generated insights about this paper's methodology, results, significance, and more — seven facets brought into focus.
Impact
Paper Details
Authors
PDF Preview
Key Terms
Citation Network
Current paper (gray), citations (green), references (blue)
Display is limited for performance on very large graphs.
Discussion 0