Teaching modeling in introductory statistics: A comparison of formula and tidyverse syntaxes
Publication
Metrics
AI Quick Summary
This study compares teaching modeling in introductory statistics using formula vs. tidyverse syntaxes, finding minimal differences in student experiences, but noting tidyverse students spent more time computing and used a broader range of R functions. Both sections used a consistent set of core functions.
Paper Preview
Abstract
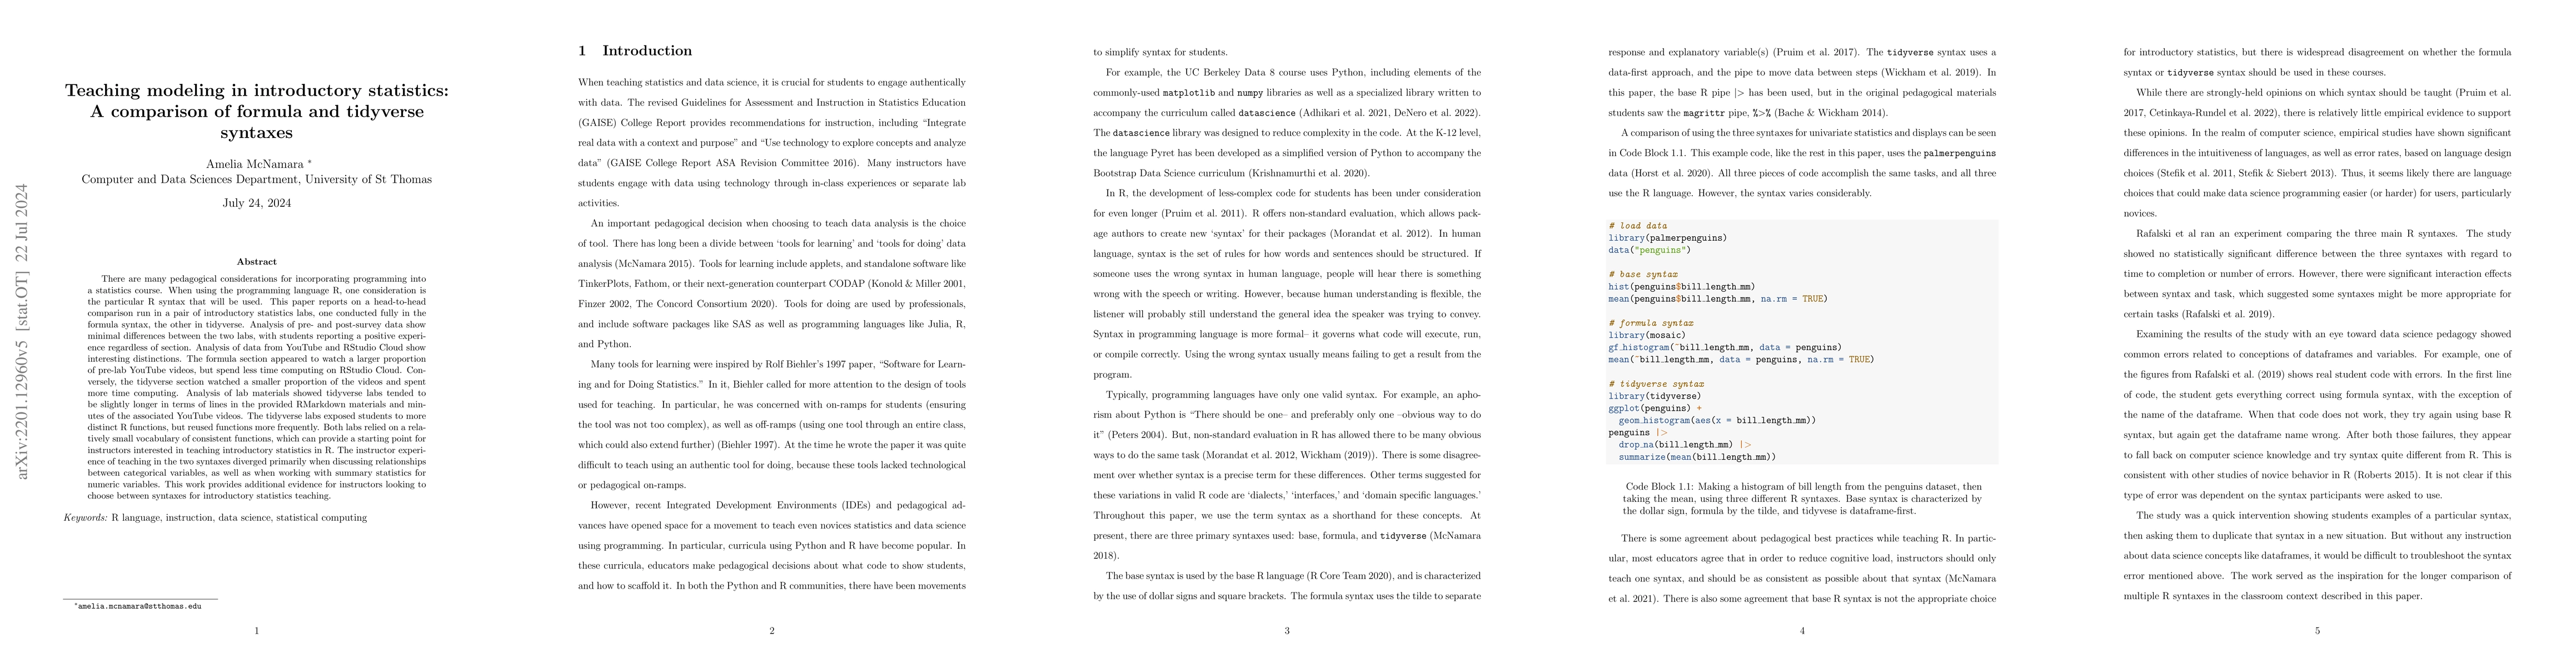
This paper reports on a head-to-head comparison run in a pair of introductory statistics labs, one conducted fully in the formula syntax, the other in tidyverse. Analysis of pre- and post-survey data show minimal differences between the two labs, with students reporting a positive experience regardless of section. Analysis of data from YouTube and RStudio Cloud show interesting distinctions. The formula section appeared to watch a larger proportion of pre-lab YouTube videos, but spend less time computing on RStudio Cloud. Conversely, the tidyverse section watched a smaller proportion of the videos and spent more time computing. Analysis of lab materials showed that tidyverse labs tended to be slightly longer in terms of lines in the provided RMarkdown materials and minutes of the associated YouTube videos. Both labs relied on a relatively small vocabulary of consistent functions, which can provide a starting point for instructors interested in teaching introductory statistics in R. The tidyverse labs exposed students to more distinct R functions, but reused functions more frequently. This work provides additional evidence for instructors looking to choose between syntaxes for introductory statistics teaching.
AI Key Findings
Get AI-generated insights about this paper's methodology, results, significance, and more — seven facets brought into focus.
Impact
Paper Details
Authors
PDF Preview
Key Terms
Citation Network
Current paper (gray), citations (green), references (blue)
Display is limited for performance on very large graphs.
Discussion 0