Summary
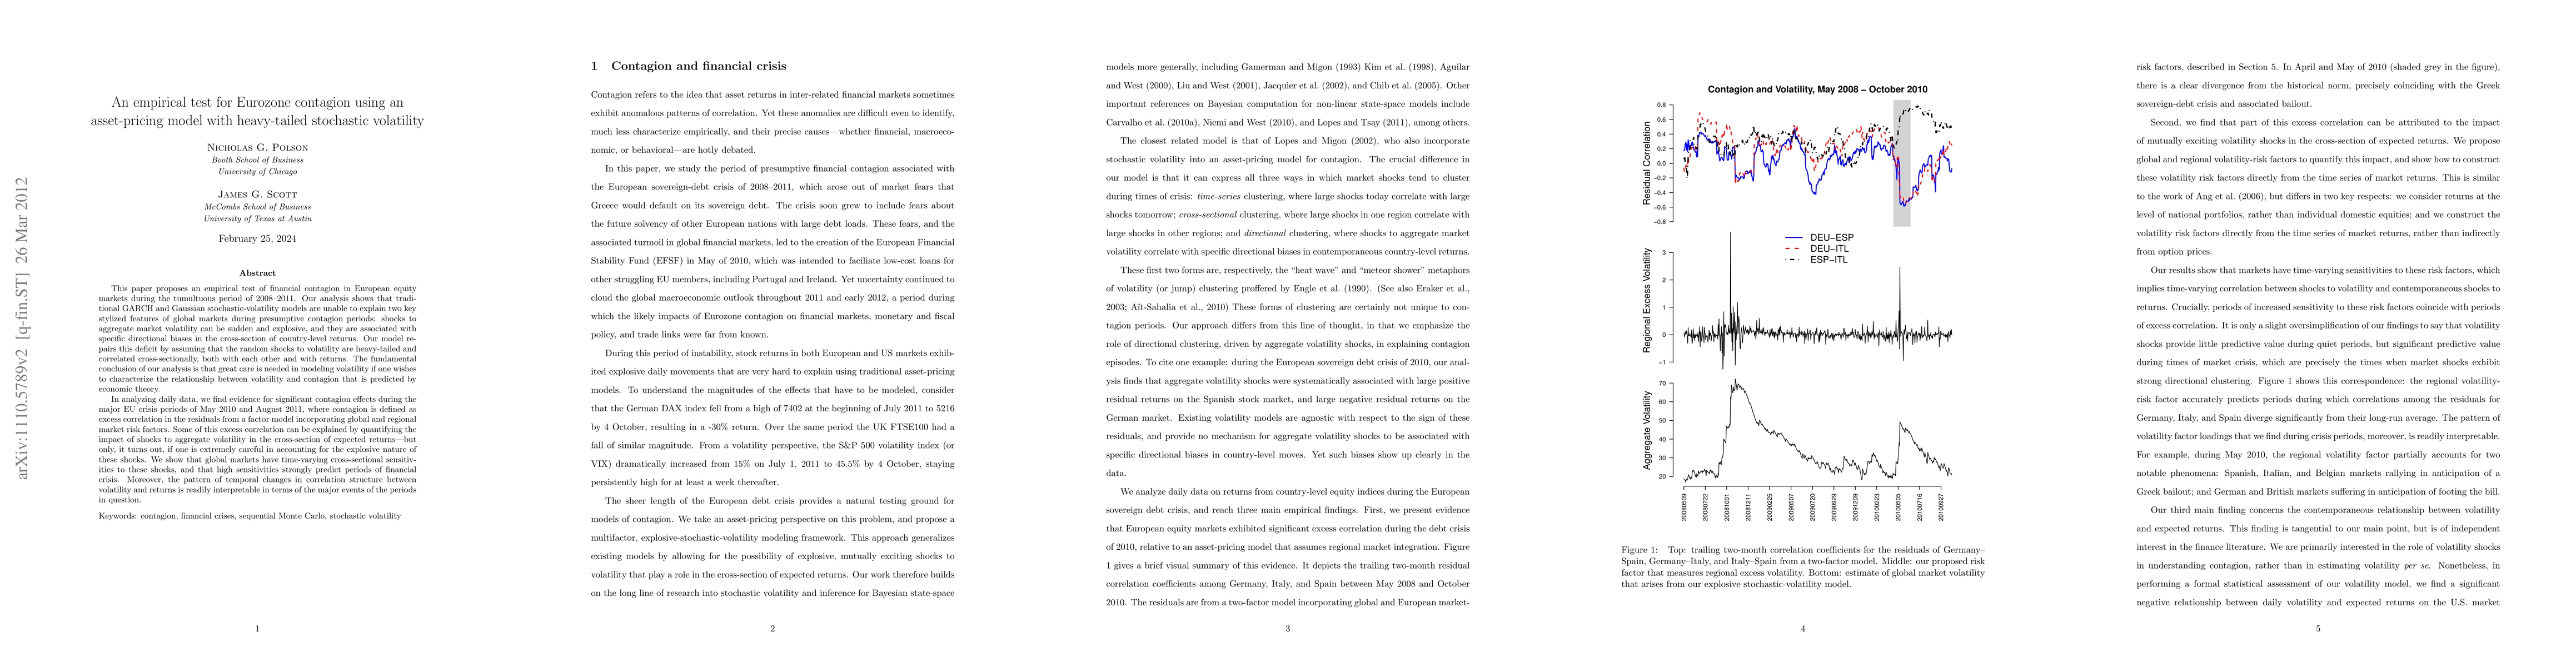
This paper proposes an empirical test of financial contagion in European equity markets during the tumultuous period of 2008-2011. Our analysis shows that traditional GARCH and Gaussian stochastic-volatility models are unable to explain two key stylized features of global markets during presumptive contagion periods: shocks to aggregate market volatility can be sudden and explosive, and they are associated with specific directional biases in the cross-section of country-level returns. Our model repairs this deficit by assuming that the random shocks to volatility are heavy-tailed and correlated cross-sectionally, both with each other and with returns. The fundamental conclusion of our analysis is that great care is needed in modeling volatility if one wishes to characterize the relationship between volatility and contagion that is predicted by economic theory. In analyzing daily data, we find evidence for significant contagion effects during the major EU crisis periods of May 2010 and August 2011, where contagion is defined as excess correlation in the residuals from a factor model incorporating global and regional market risk factors. Some of this excess correlation can be explained by quantifying the impact of shocks to aggregate volatility in the cross-section of expected returns - but only, it turns out, if one is extremely careful in accounting for the explosive nature of these shocks. We show that global markets have time-varying cross-sectional sensitivities to these shocks, and that high sensitivities strongly predict periods of financial crisis. Moreover, the pattern of temporal changes in correlation structure between volatility and returns is readily interpretable in terms of the major events of the periods in question.
AI Key Findings
Get AI-generated insights about this paper's methodology, results, and significance.
Paper Details
PDF Preview
Key Terms
Citation Network
Current paper (gray), citations (green), references (blue)
Display is limited for performance on very large graphs.
Similar Papers
Found 4 papersNo citations found for this paper.
Comments (0)