Publication
Metrics
AI Quick Summary
This paper proposes an incremental dimensionality reduction method for visualizing streaming multidimensional data, enhancing an existing incremental PCA method to handle varying data dimensions and preserve data positions over time using geometric transformations and animation. The method also estimates projected data positions and conveys uncertainty, demonstrated effectively through real-world datasets.
Paper Preview
Abstract
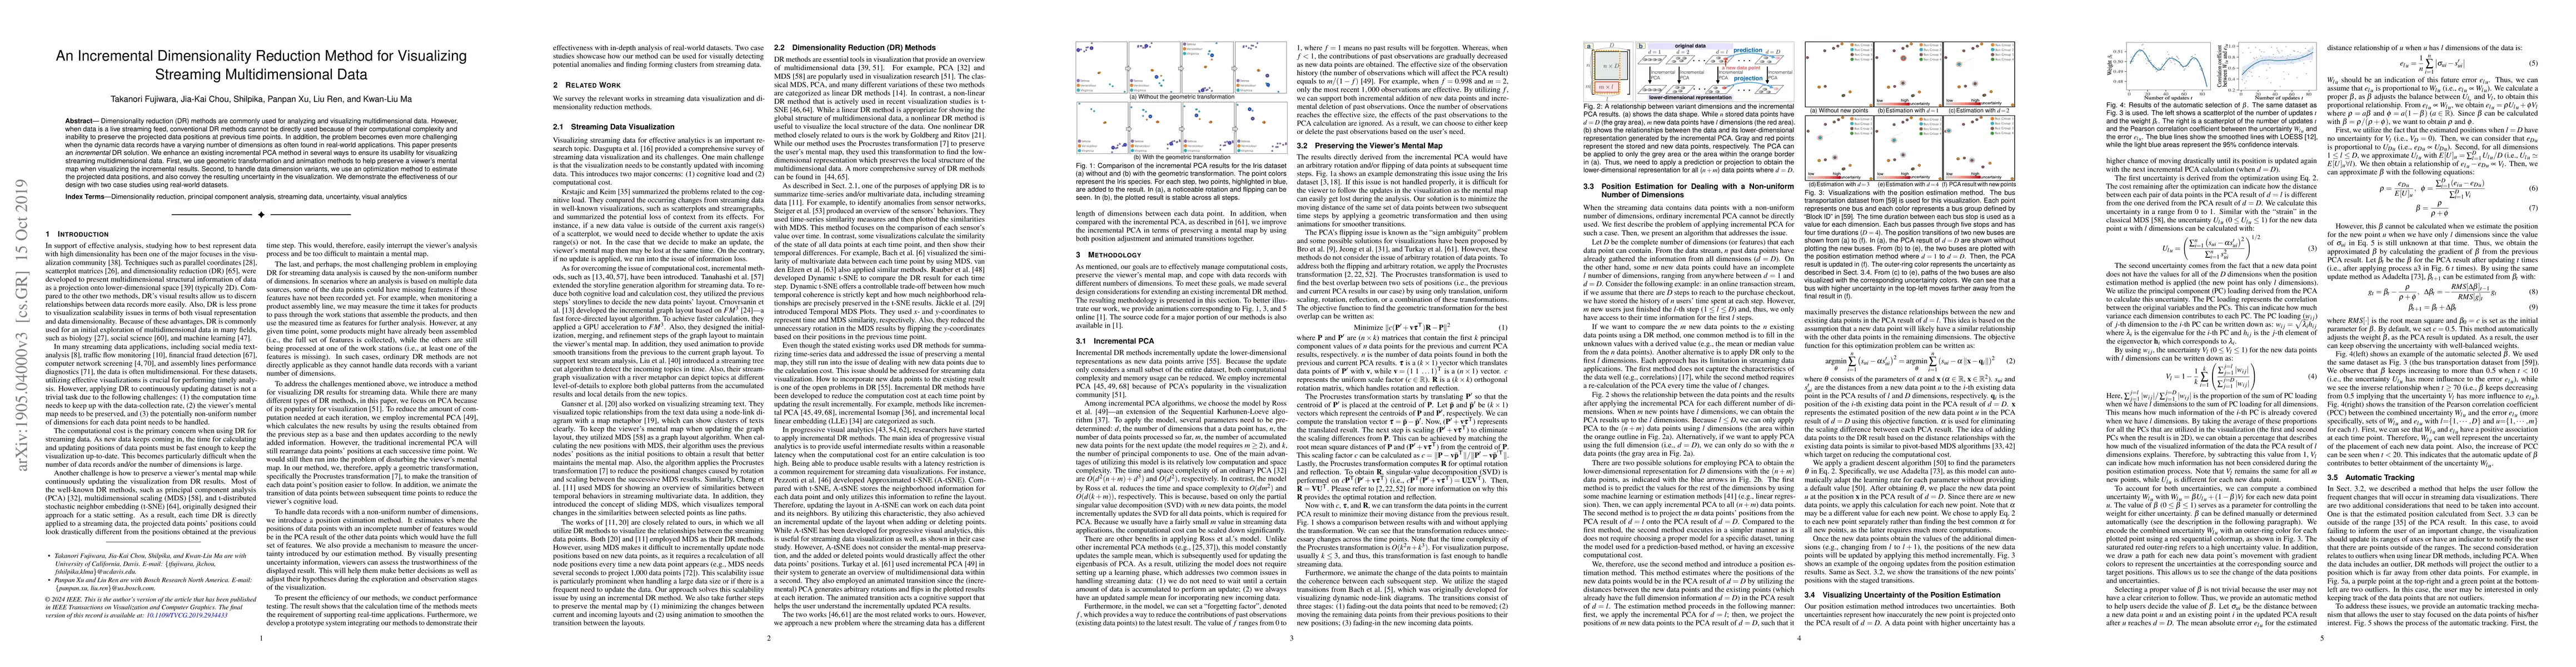
Dimensionality reduction (DR) methods are commonly used for analyzing and visualizing multidimensional data. However, when data is a live streaming feed, conventional DR methods cannot be directly used because of their computational complexity and inability to preserve the projected data positions at previous time points. In addition, the problem becomes even more challenging when the dynamic data records have a varying number of dimensions as often found in real-world applications. This paper presents an incremental DR solution. We enhance an existing incremental PCA method in several ways to ensure its usability for visualizing streaming multidimensional data. First, we use geometric transformation and animation methods to help preserve a viewer's mental map when visualizing the incremental results. Second, to handle data dimension variants, we use an optimization method to estimate the projected data positions, and also convey the resulting uncertainty in the visualization. We demonstrate the effectiveness of our design with two case studies using real-world datasets.
AI Key Findings
Get AI-generated insights about this paper's methodology, results, significance, and more — seven facets brought into focus.
Impact
Paper Details
PDF Preview
Key Terms
Citation Network
Current paper (gray), citations (green), references (blue)
Display is limited for performance on very large graphs.
Discussion 0