Visualizing Dimensionality Reduction Artifacts: An Evaluation
Publication
Metrics
AI Quick Summary
An interactive technique that color-codes dimensionality reduction artifacts helps with local analysis tasks, but not visual clustering tasks.
Paper Preview
Abstract
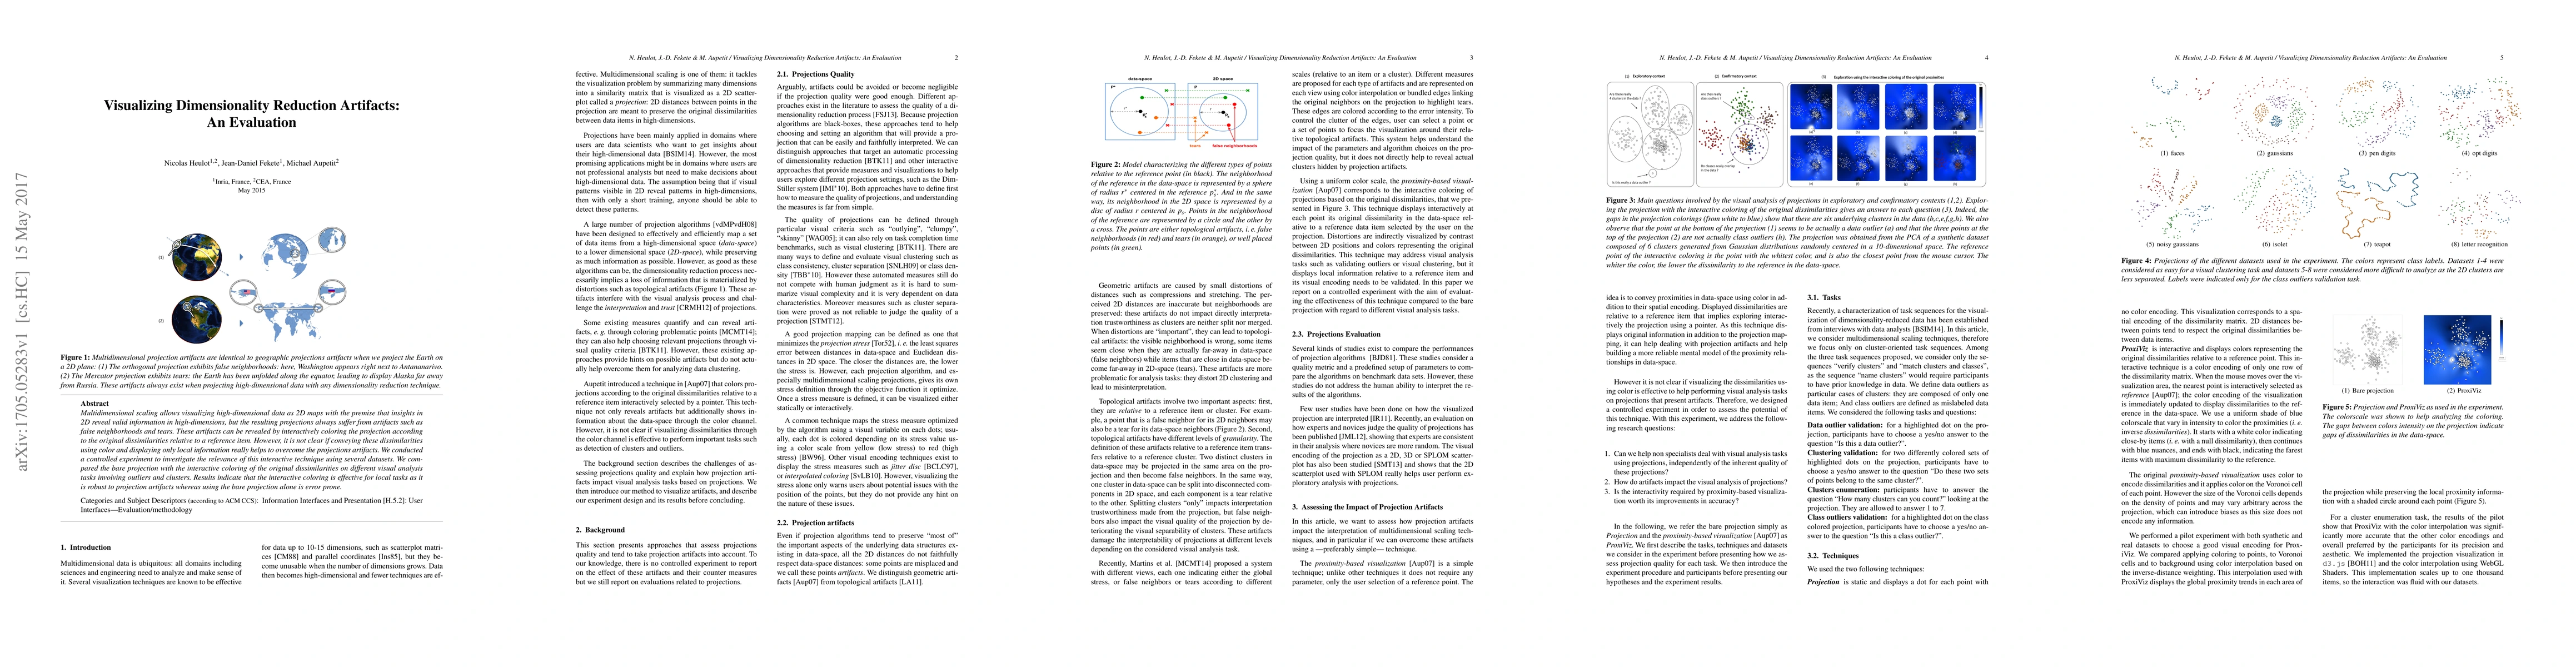
Multidimensional scaling allows visualizing high-dimensional data as 2D maps with the premise that insights in 2D reveal valid information in high-dimensions. However, the resulting projections suffer from artifacts such as bad local neighborhood preservation and clusters tearing. Interactively coloring the projection according to the discrepancy between original proximities relative to a reference item reveals these artifacts, but it is not clear if conveying these proximities using color and displaying only local information really helps the visual analysis of projections. We conducted a controlled experiment to investigate the relevance of this interactive technique to help the visual analysis of any projection regardless its quality. We compared the bare projection to the interactive coloring of the original proximities on different visual analysis tasks involving outliers and clusters. Results indicate that the interactive coloring is worthwhile for local tasks as it is significantly robust to projection artifacts whereas the projection is not. However this interactive technique does not help significantly for visual clustering tasks for that projections already give a suitable overview.
AI Key Findings
Get AI-generated insights about this paper's methodology, results, significance, and more — seven facets brought into focus.
Impact
Paper Details
PDF Preview
Key Terms
Citation Network
Current paper (gray), citations (green), references (blue)
Display is limited for performance on very large graphs.
Discussion 0