An Interactive Data Visualization and Analytics Tool to Evaluate Mobility and Sociability Trends During COVID-19
Publication
Metrics
AI Quick Summary
This paper introduces an interactive data visualization tool for evaluating mobility and sociability trends in NYC and Seattle during COVID-19, developed by the C2SMART team. The dashboard leverages data mining and cloud computing to analyze the impact of the pandemic on travel behavior and informs decision-makers with updated metrics and visualizations.
Paper Preview
Abstract
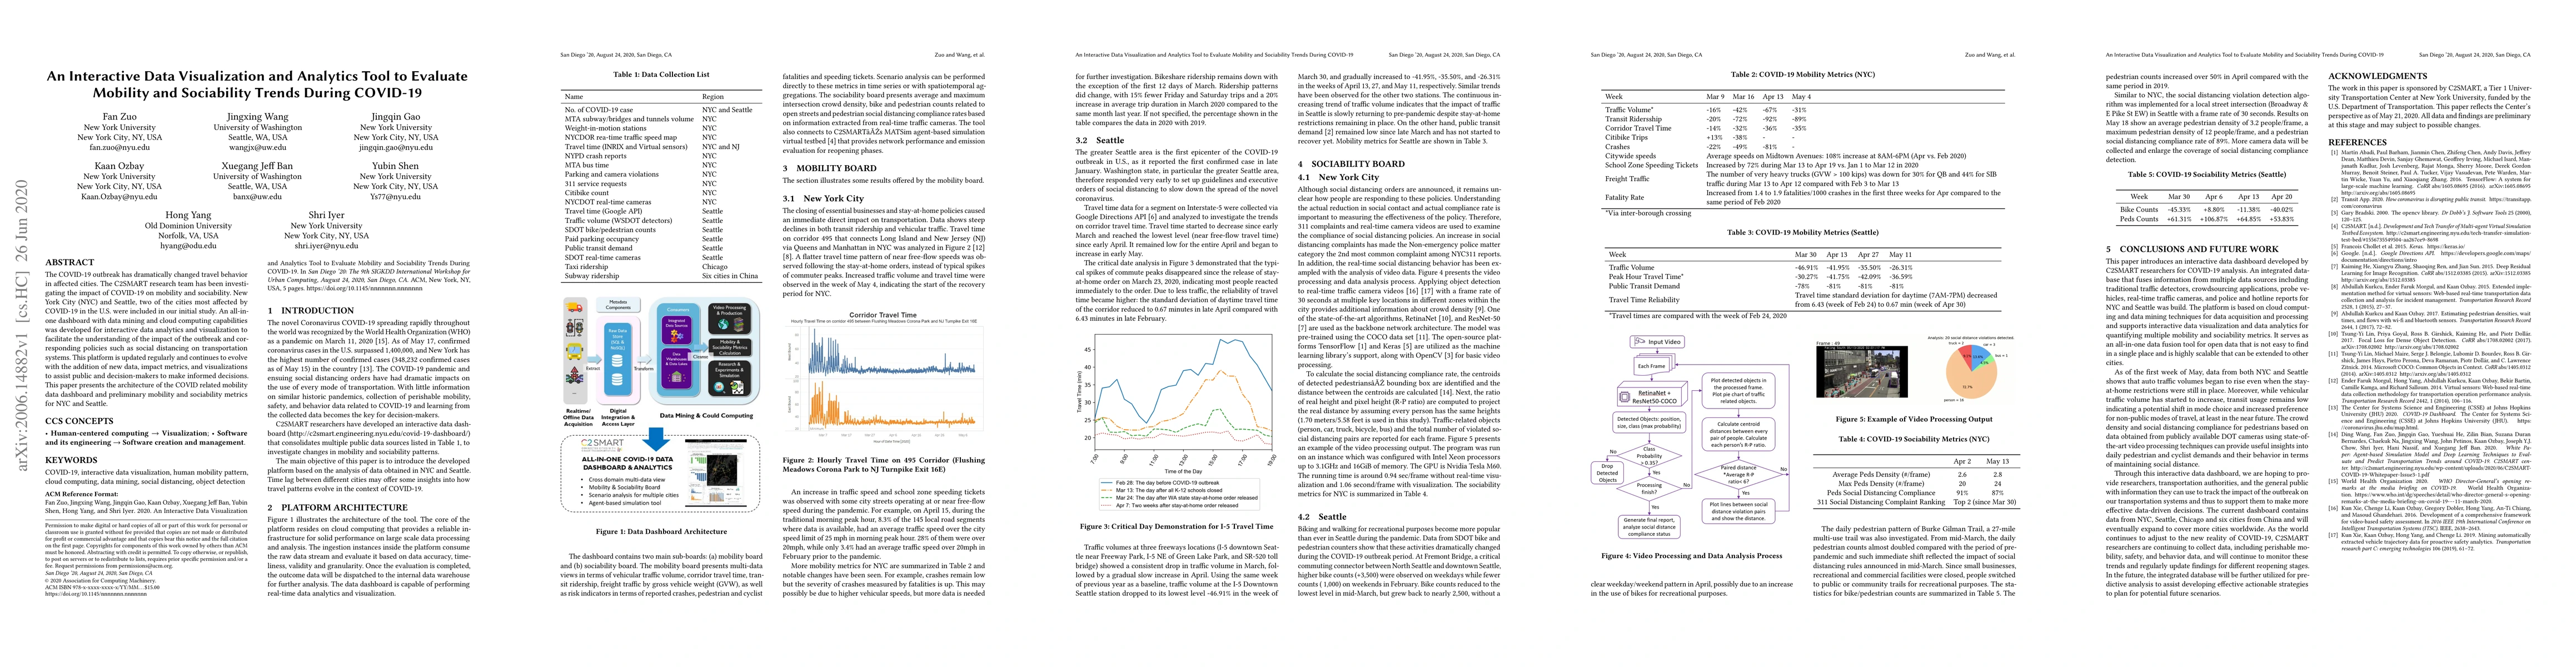
The COVID-19 outbreak has dramatically changed travel behavior in affected cities. The C2SMART research team has been investigating the impact of COVID-19 on mobility and sociability. New York City (NYC) and Seattle, two of the cities most affected by COVID-19 in the U.S. were included in our initial study. An all-in-one dashboard with data mining and cloud computing capabilities was developed for interactive data analytics and visualization to facilitate the understanding of the impact of the outbreak and corresponding policies such as social distancing on transportation systems. This platform is updated regularly and continues to evolve with the addition of new data, impact metrics, and visualizations to assist public and decision-makers to make informed decisions. This paper presents the architecture of the COVID related mobility data dashboard and preliminary mobility and sociability metrics for NYC and Seattle.
AI Key Findings
Get AI-generated insights about this paper's methodology, results, significance, and more — seven facets brought into focus.
Impact
Paper Details
Authors
PDF Preview
Key Terms
Citation Network
Current paper (gray), citations (green), references (blue)
Display is limited for performance on very large graphs.
Discussion 0