An Interactive Tool for Analyzing High-Dimensional Clusterings
Publication
Metrics
Paper Preview
Abstract
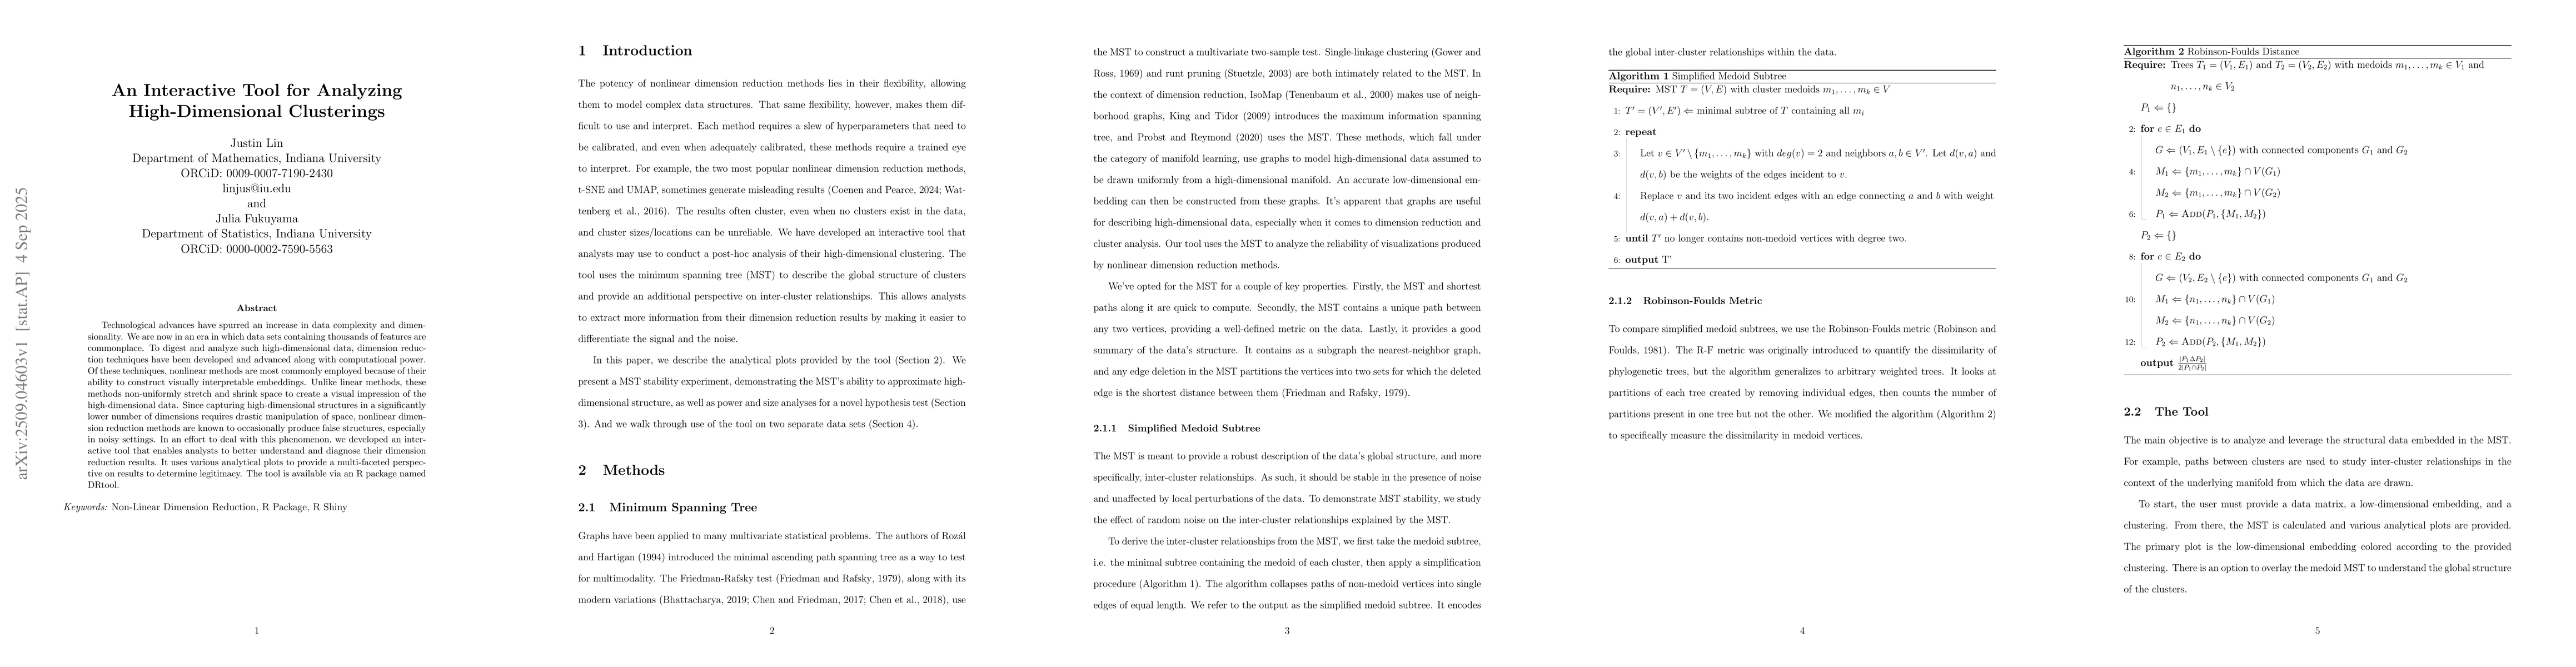
Technological advances have spurred an increase in data complexity and dimensionality. We are now in an era in which data sets containing thousands of features are commonplace. To digest and analyze such high-dimensional data, dimension reduction techniques have been developed and advanced along with computational power. Of these techniques, nonlinear methods are most commonly employed because of their ability to construct visually interpretable embeddings. Unlike linear methods, these methods non-uniformly stretch and shrink space to create a visual impression of the high-dimensional data. Since capturing high-dimensional structures in a significantly lower number of dimensions requires drastic manipulation of space, nonlinear dimension reduction methods are known to occasionally produce false structures, especially in noisy settings. In an effort to deal with this phenomenon, we developed an interactive tool that enables analysts to better understand and diagnose their dimension reduction results. It uses various analytical plots to provide a multi-faceted perspective on results to determine legitimacy. The tool is available via an R package named DRtool.
AI Key Findings
Get AI-generated insights about this paper's methodology, results, significance, and more — seven facets brought into focus.
Discussion 0