Plexus: An Interactive Visualization Tool for Analyzing Public Emotions from Twitter Data
Publication
Metrics
AI Quick Summary
This paper introduces Plexus, an interactive visualization tool for analyzing public emotions from Twitter data, enabling real-time identification and visualization of sentiments on related topics. A feasibility study with 14 participants demonstrated its effectiveness.
Paper Preview
Abstract
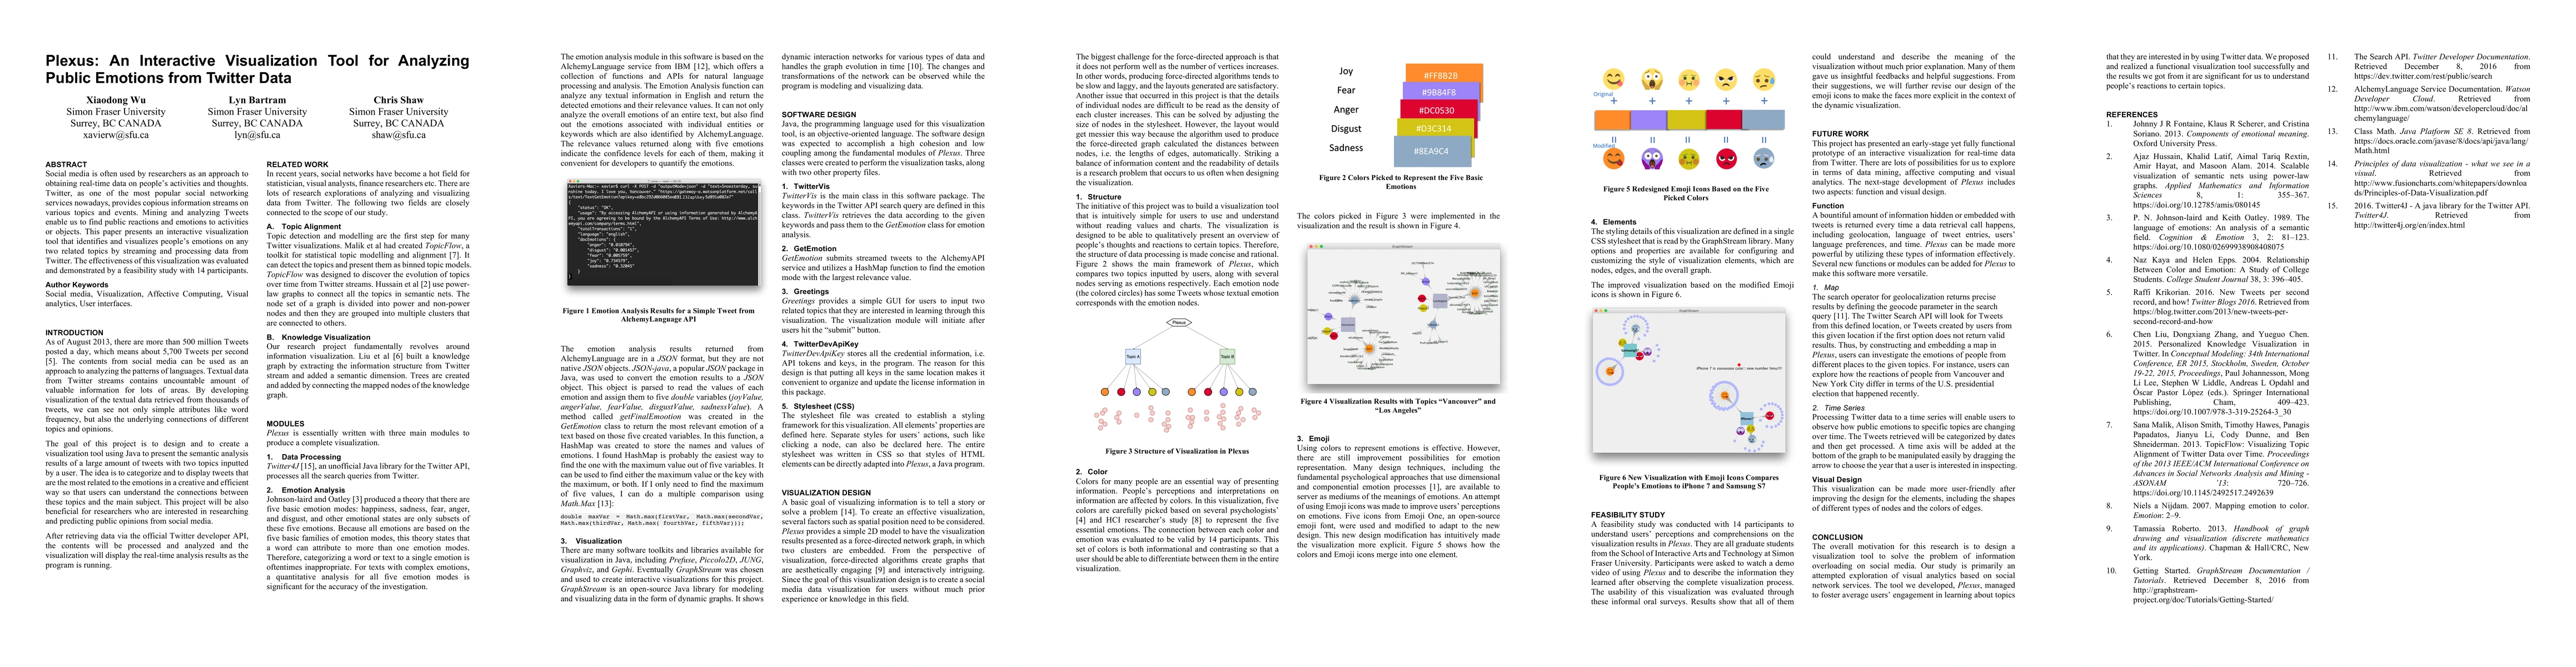
Social media is often used by researchers as an approach to obtaining real-time data on people's activities and thoughts. Twitter, as one of the most popular social networking services nowadays, provides copious information streams on various topics and events. Mining and analyzing Tweets enable us to find public reactions and emotions to activities or objects. This paper presents an interactive visualization tool that identifies and visualizes people's emotions on any two related topics by streaming and processing data from Twitter. The effectiveness of this visualization was evaluated and demonstrated by a feasibility study with 14 participants.
AI Key Findings
Get AI-generated insights about this paper's methodology, results, significance, and more — seven facets brought into focus.
Impact
Paper Details
PDF Preview
Key Terms
Citation Network
Current paper (gray), citations (green), references (blue)
Display is limited for performance on very large graphs.
Discussion 0