VINE: An Open Source Interactive Data Visualization Tool for Neuroevolution
Publication
Metrics
AI Quick Summary
This paper introduces VINE, an open-source interactive data visualization tool designed to help researchers and users better understand neuroevolution processes. VINE provides insights into the dynamics of evolutionary algorithms like ES and GA by visualizing the evolving agent's behavior over generations, thus facilitating the analysis of complex neural networks.
Paper Preview
Abstract
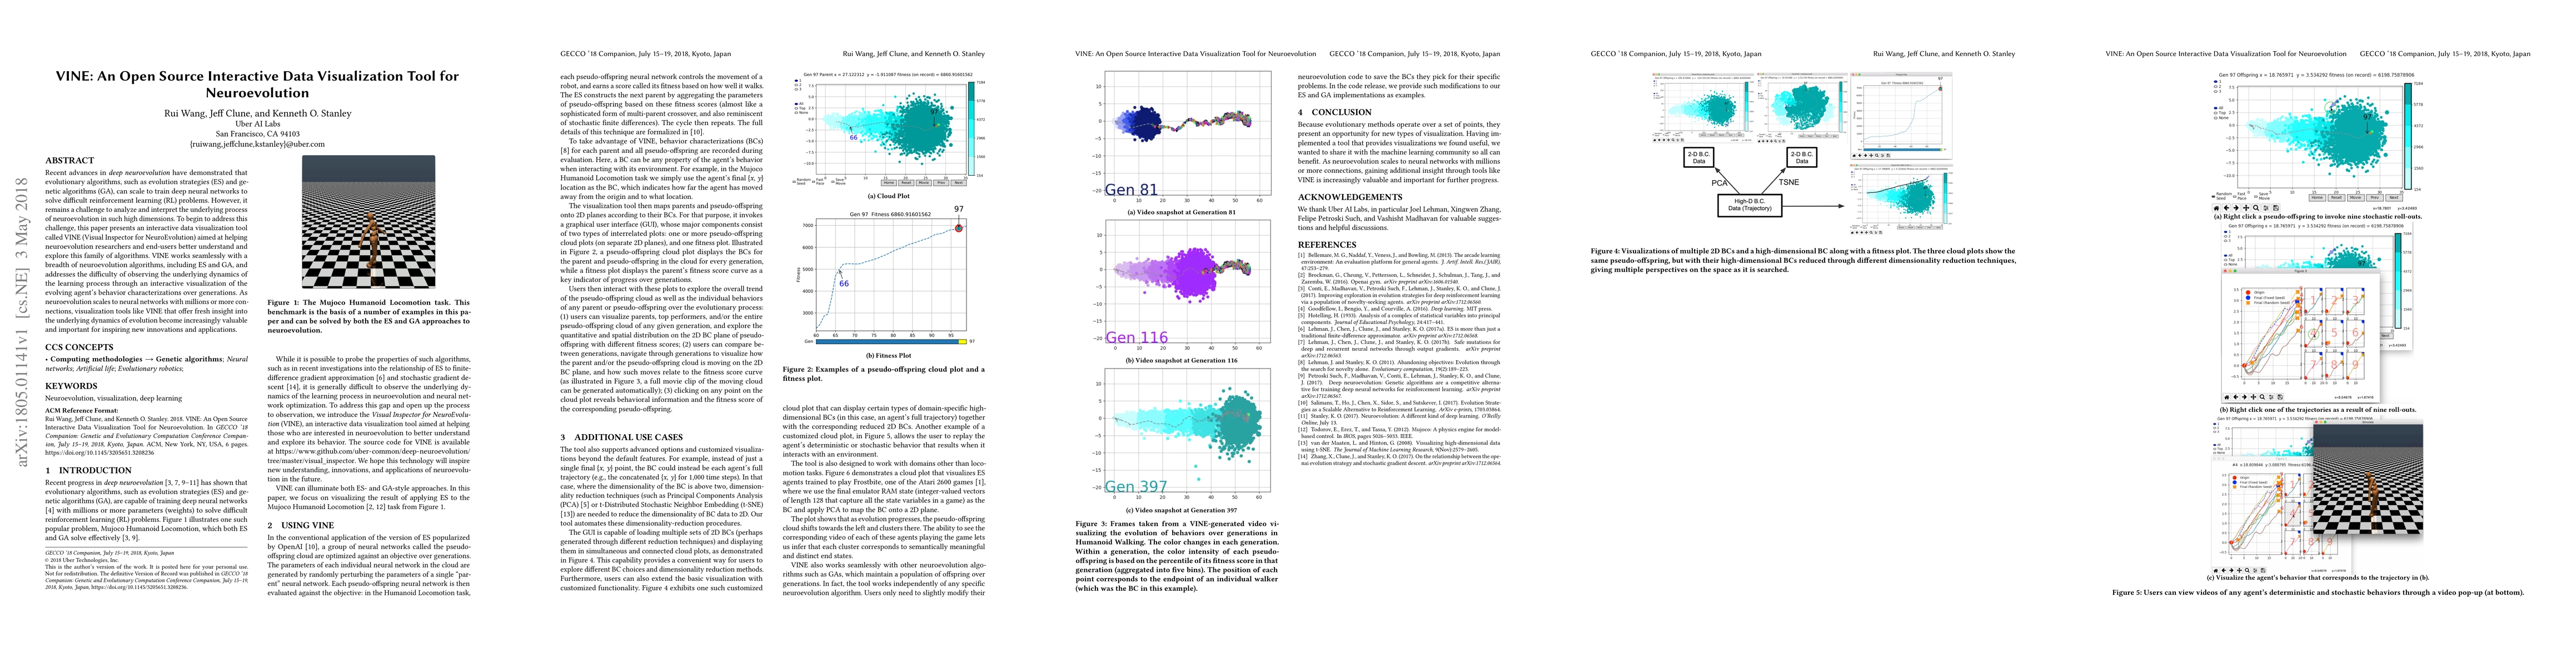
Recent advances in deep neuroevolution have demonstrated that evolutionary algorithms, such as evolution strategies (ES) and genetic algorithms (GA), can scale to train deep neural networks to solve difficult reinforcement learning (RL) problems. However, it remains a challenge to analyze and interpret the underlying process of neuroevolution in such high dimensions. To begin to address this challenge, this paper presents an interactive data visualization tool called VINE (Visual Inspector for NeuroEvolution) aimed at helping neuroevolution researchers and end-users better understand and explore this family of algorithms. VINE works seamlessly with a breadth of neuroevolution algorithms, including ES and GA, and addresses the difficulty of observing the underlying dynamics of the learning process through an interactive visualization of the evolving agent's behavior characterizations over generations. As neuroevolution scales to neural networks with millions or more connections, visualization tools like VINE that offer fresh insight into the underlying dynamics of evolution become increasingly valuable and important for inspiring new innovations and applications.
AI Key Findings
Get AI-generated insights about this paper's methodology, results, significance, and more — seven facets brought into focus.
Impact
Paper Details
PDF Preview
Key Terms
Citation Network
Current paper (gray), citations (green), references (blue)
Display is limited for performance on very large graphs.
Discussion 0