Application of Equal Local Levels to Improve Q-Q Plot Testing Bands with R Package qqconf
Publication
Metrics
AI Quick Summary
This paper introduces the R package qqconf, which applies the equal local levels method to improve Q-Q plot testing bands, addressing issues like incorrect error rates and slow computation. The package provides accurate, fast, and universally applicable testing bands for various distributions.
Paper Preview
Abstract
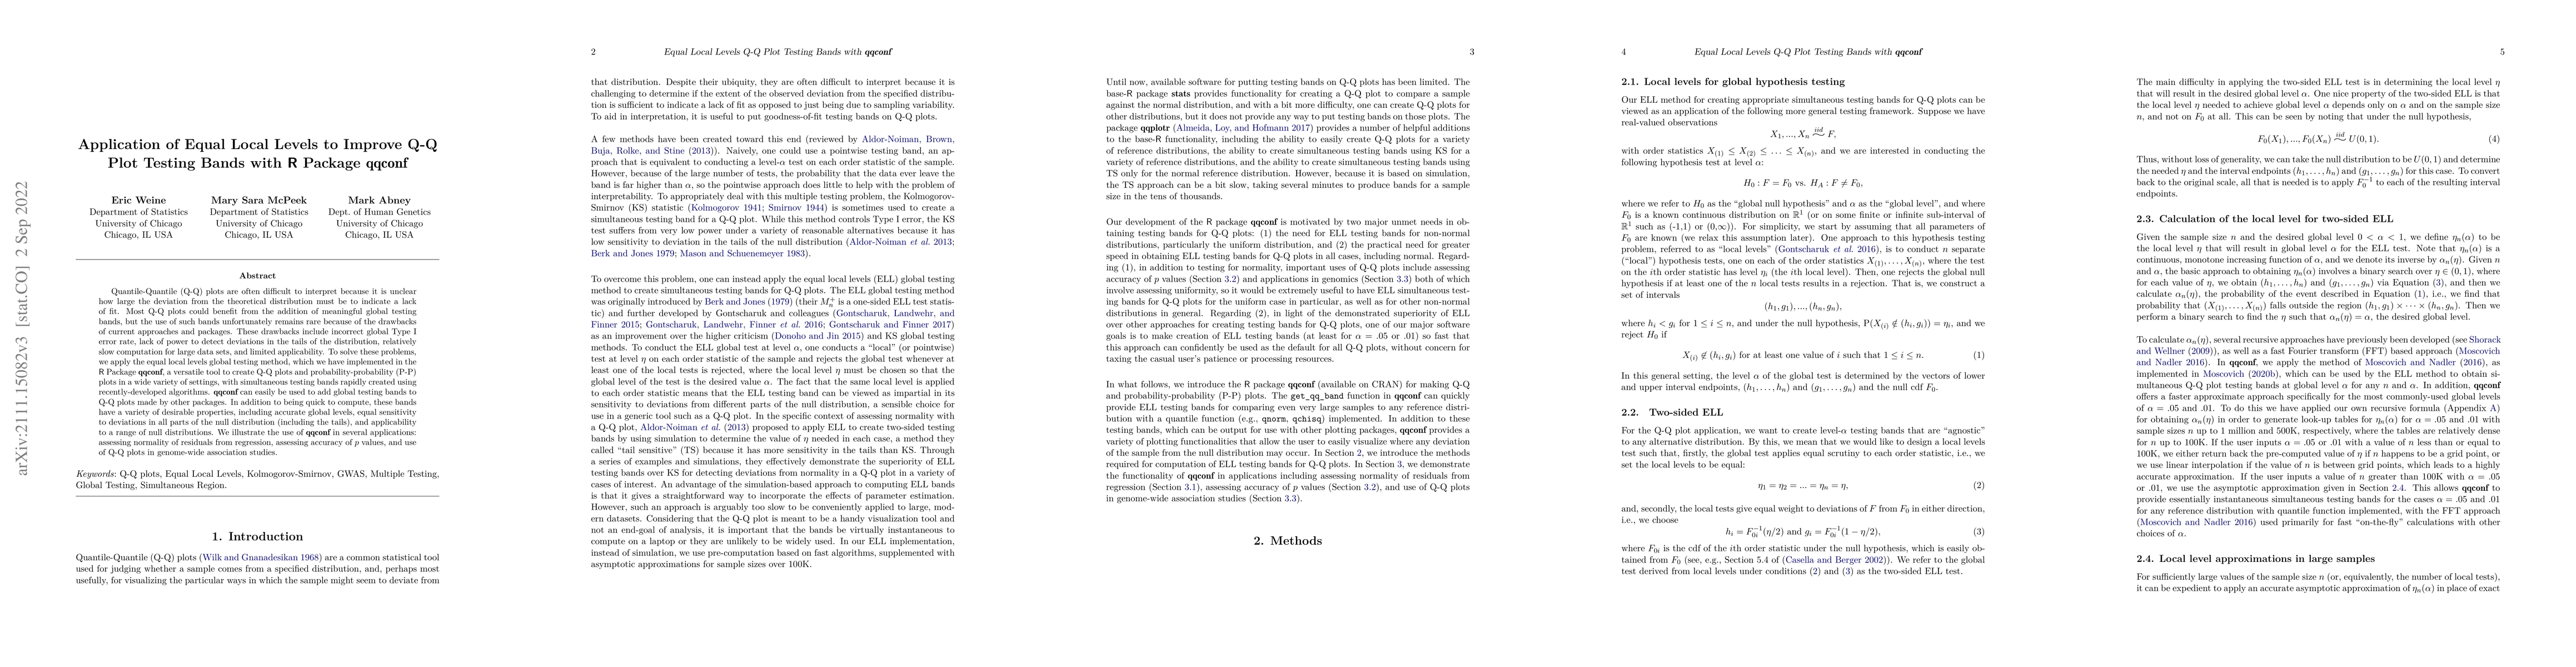
Quantile-Quantile (Q-Q) plots are often difficult to interpret because it is unclear how large the deviation from the theoretical distribution must be to indicate a lack of fit. Most Q-Q plots could benefit from the addition of meaningful global testing bands, but the use of such bands unfortunately remains rare because of the drawbacks of current approaches and packages. These drawbacks include incorrect global Type I error rate, lack of power to detect deviations in the tails of the distribution, relatively slow computation for large data sets, and limited applicability. To solve these problems, we apply the equal local levels global testing method, which we have implemented in the R Package qqconf, a versatile tool to create Q-Q plots and probability-probability (P-P) plots in a wide variety of settings, with simultaneous testing bands rapidly created using recently-developed algorithms. qqconf can easily be used to add global testing bands to Q-Q plots made by other packages. In addition to being quick to compute, these bands have a variety of desirable properties, including accurate global levels, equal sensitivity to deviations in all parts of the null distribution (including the tails), and applicability to a range of null distributions. We illustrate the use of qqconf in several applications: assessing normality of residuals from regression, assessing accuracy of p values, and use of Q-Q plots in genome-wide association studies.
AI Key Findings
Get AI-generated insights about this paper's methodology, results, significance, and more — seven facets brought into focus.
Impact
Paper Details
Authors
PDF Preview
Key Terms
Citation Network
Current paper (gray), citations (green), references (blue)
Display is limited for performance on very large graphs.
Discussion 0