Assessing Visualization Techniques for the Search Process in Digital Libraries
Publication
Metrics
AI Quick Summary
This paper assesses visualization techniques for digital libraries to support user search processes, finding that many systems fail to address current users' information needs. It suggests a need for more intense evaluation of real-life scenarios and comparable results.
Paper Preview
Abstract
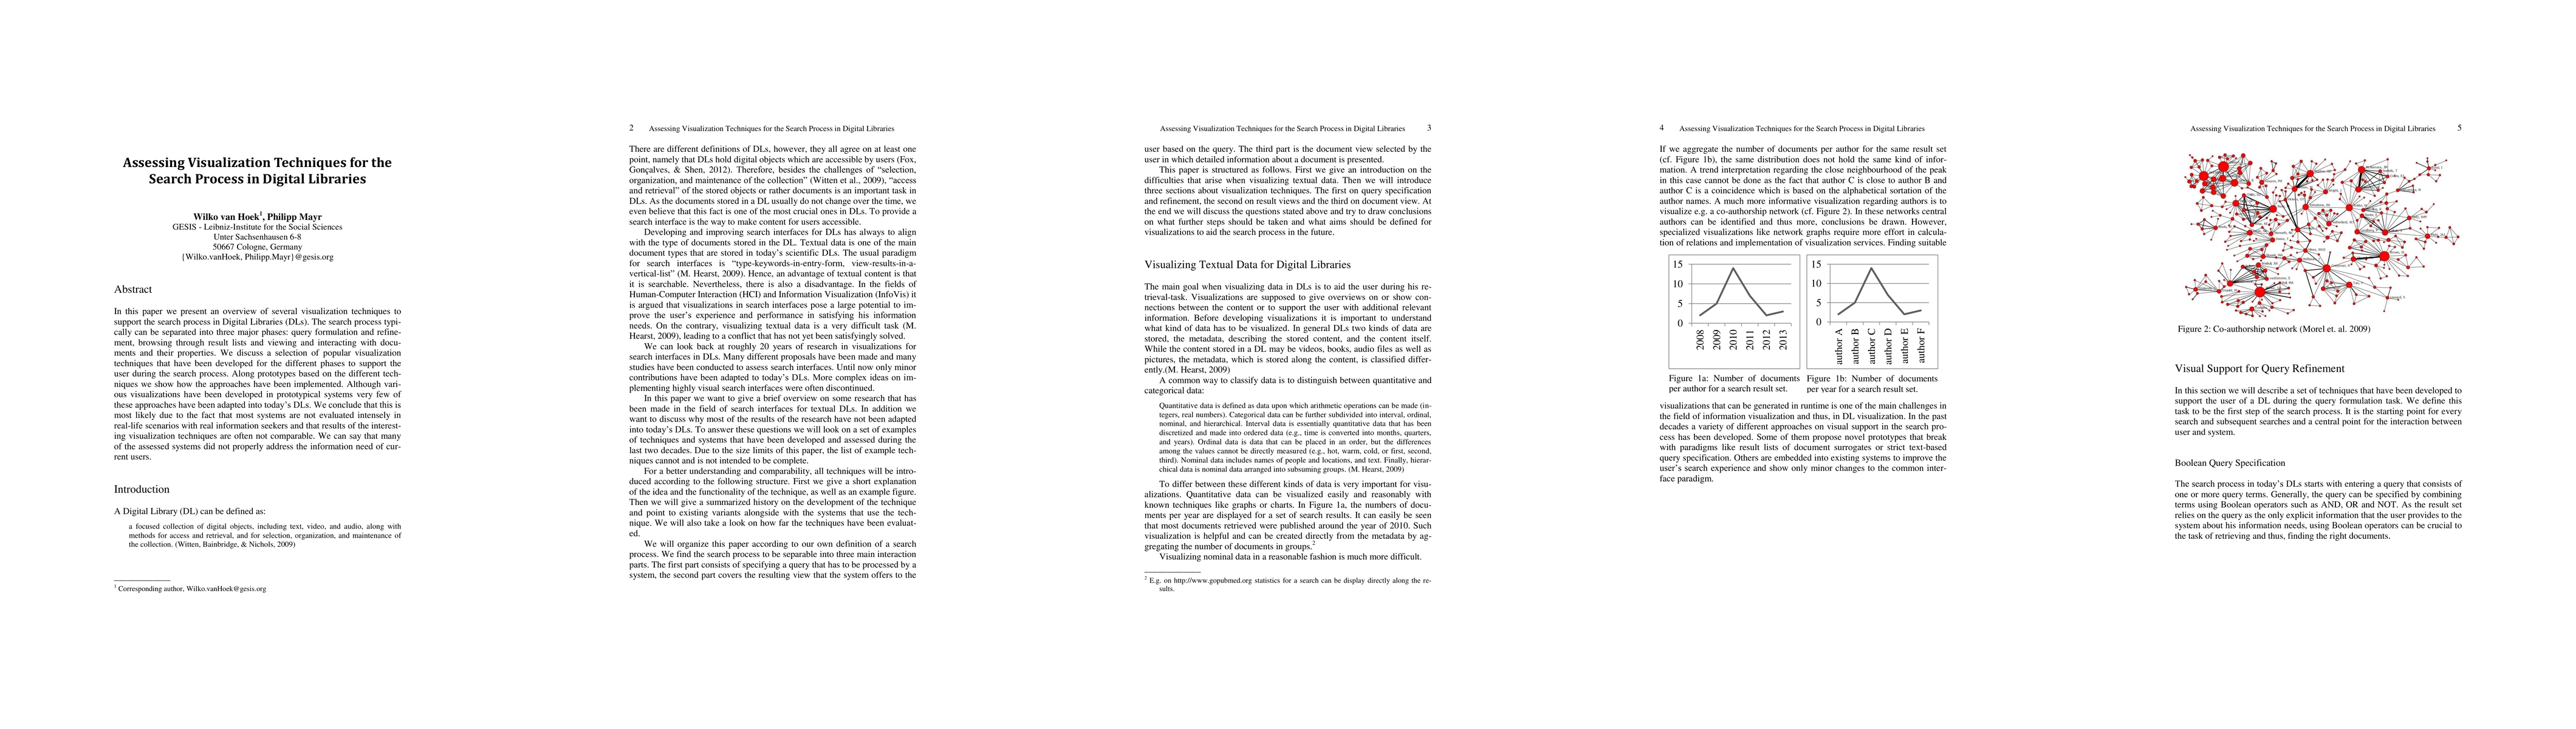
In this paper we present an overview of several visualization techniques to support the search process in Digital Libraries (DLs). The search process typically can be separated into three major phases: query formulation and refinement, browsing through result lists and viewing and interacting with documents and their properties. We discuss a selection of popular visualization techniques that have been developed for the different phases to support the user during the search process. Along prototypes based on the different techniques we show how the approaches have been implemented. Although various visualizations have been developed in prototypical systems very few of these approaches have been adapted into today's DLs. We conclude that this is most likely due to the fact that most systems are not evaluated intensely in real-life scenarios with real information seekers and that results of the interesting visualization techniques are often not comparable. We can say that many of the assessed systems did not properly address the information need of cur-rent users.
AI Key Findings
Get AI-generated insights about this paper's methodology, results, significance, and more — seven facets brought into focus.
Impact
Paper Details
PDF Preview
Key Terms
Citation Network
Current paper (gray), citations (green), references (blue)
Display is limited for performance on very large graphs.
Discussion 0