Integrating Interactive Visualizations in the Search Process of Digital Libraries and IR Systems
Publication
Metrics
Paper Preview
Abstract
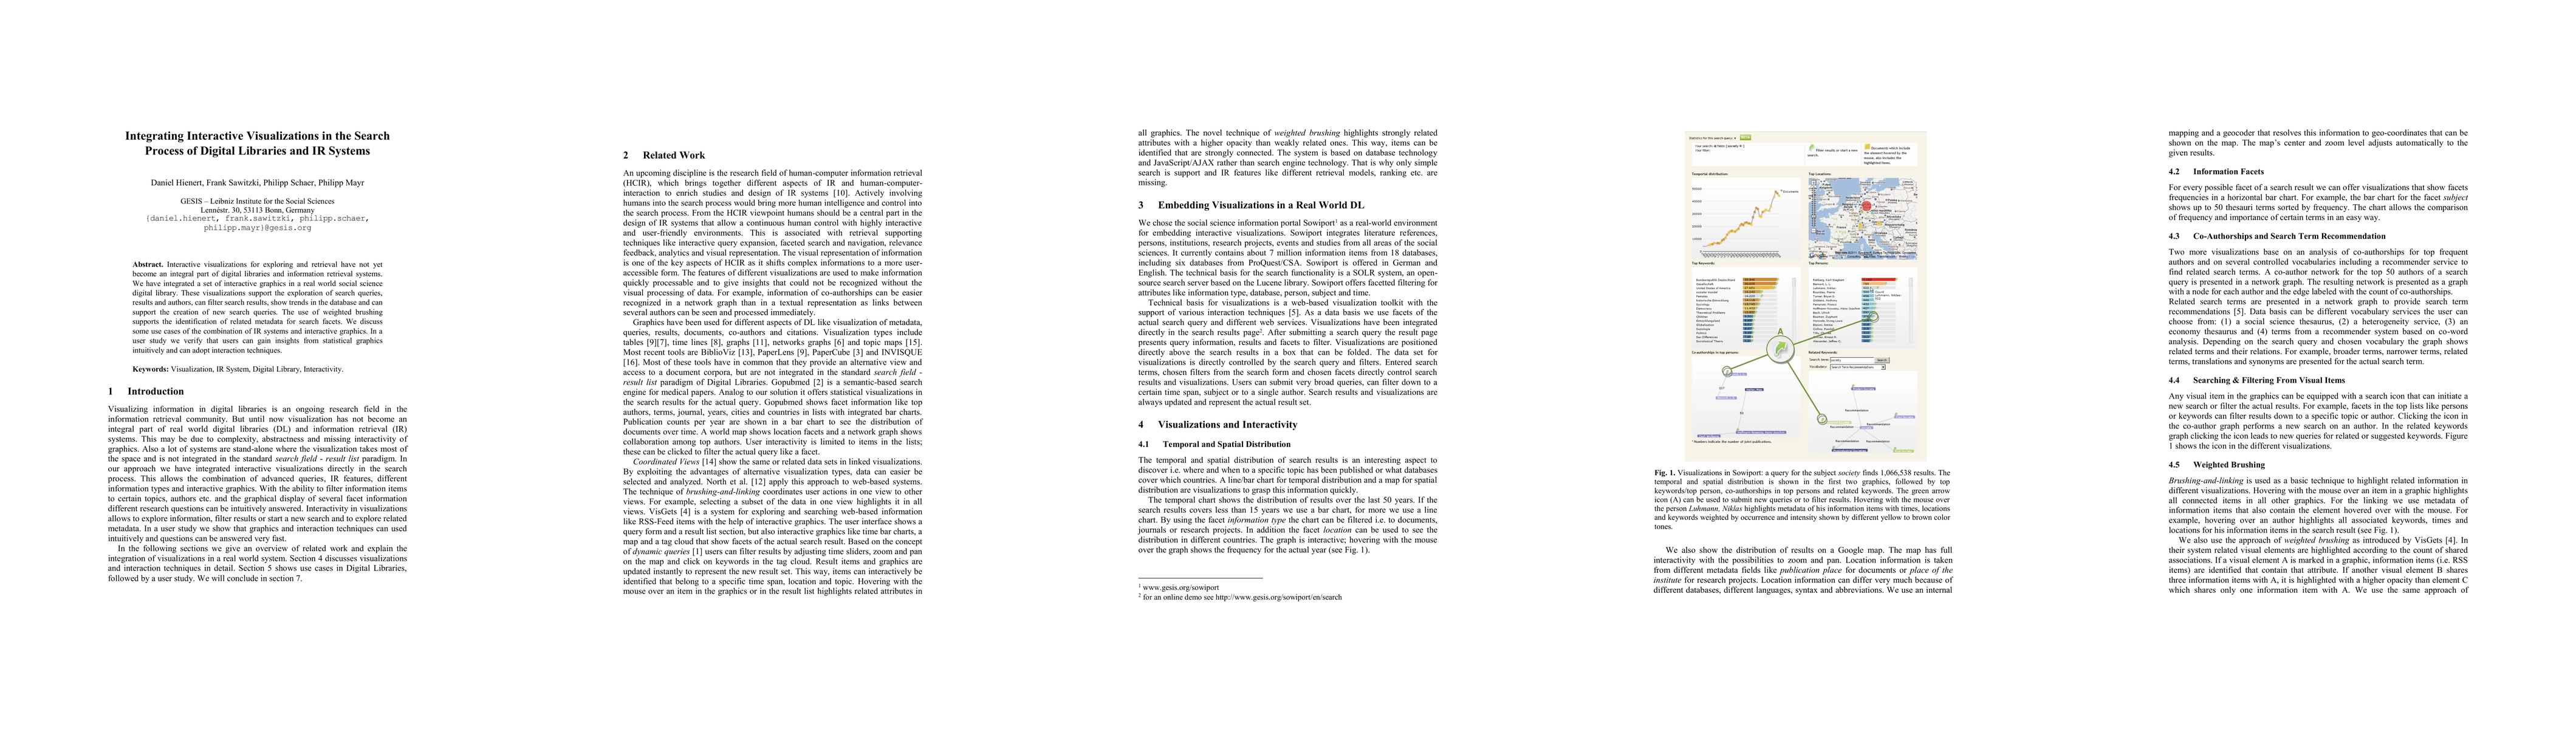
Interactive visualizations for exploring and retrieval have not yet become an integral part of digital libraries and information retrieval systems. We have integrated a set of interactive graphics in a real world social science digital library. These visualizations support the exploration of search queries, results and authors, can filter search results, show trends in the database and can support the creation of new search queries. The use of weighted brushing supports the identification of related metadata for search facets. We discuss some use cases of the combination of IR systems and interactive graphics. In a user study we verify that users can gain insights from statistical graphics intuitively and can adopt interaction techniques.
AI Key Findings
Get AI-generated insights about this paper's methodology, results, significance, and more — seven facets brought into focus.
Impact
Paper Details
PDF Preview
Key Terms
Citation Network
Current paper (gray), citations (green), references (blue)
Display is limited for performance on very large graphs.
Discussion 0