Autocorrelation of returns in major cryptocurrency markets
Publication
Metrics
AI Quick Summary
This paper investigates the autocorrelation of returns in major cryptocurrency markets using various statistical tests, finding persistent significant autocorrelation on short time frames (5m and 1H) across BTC/USD, ETH/USD, ETH/BTC, and XBT/USD markets. Longer time frames (1D and 1W) show mixed results, and all datasets and analysis code are available on GitHub.
Paper Preview
Abstract
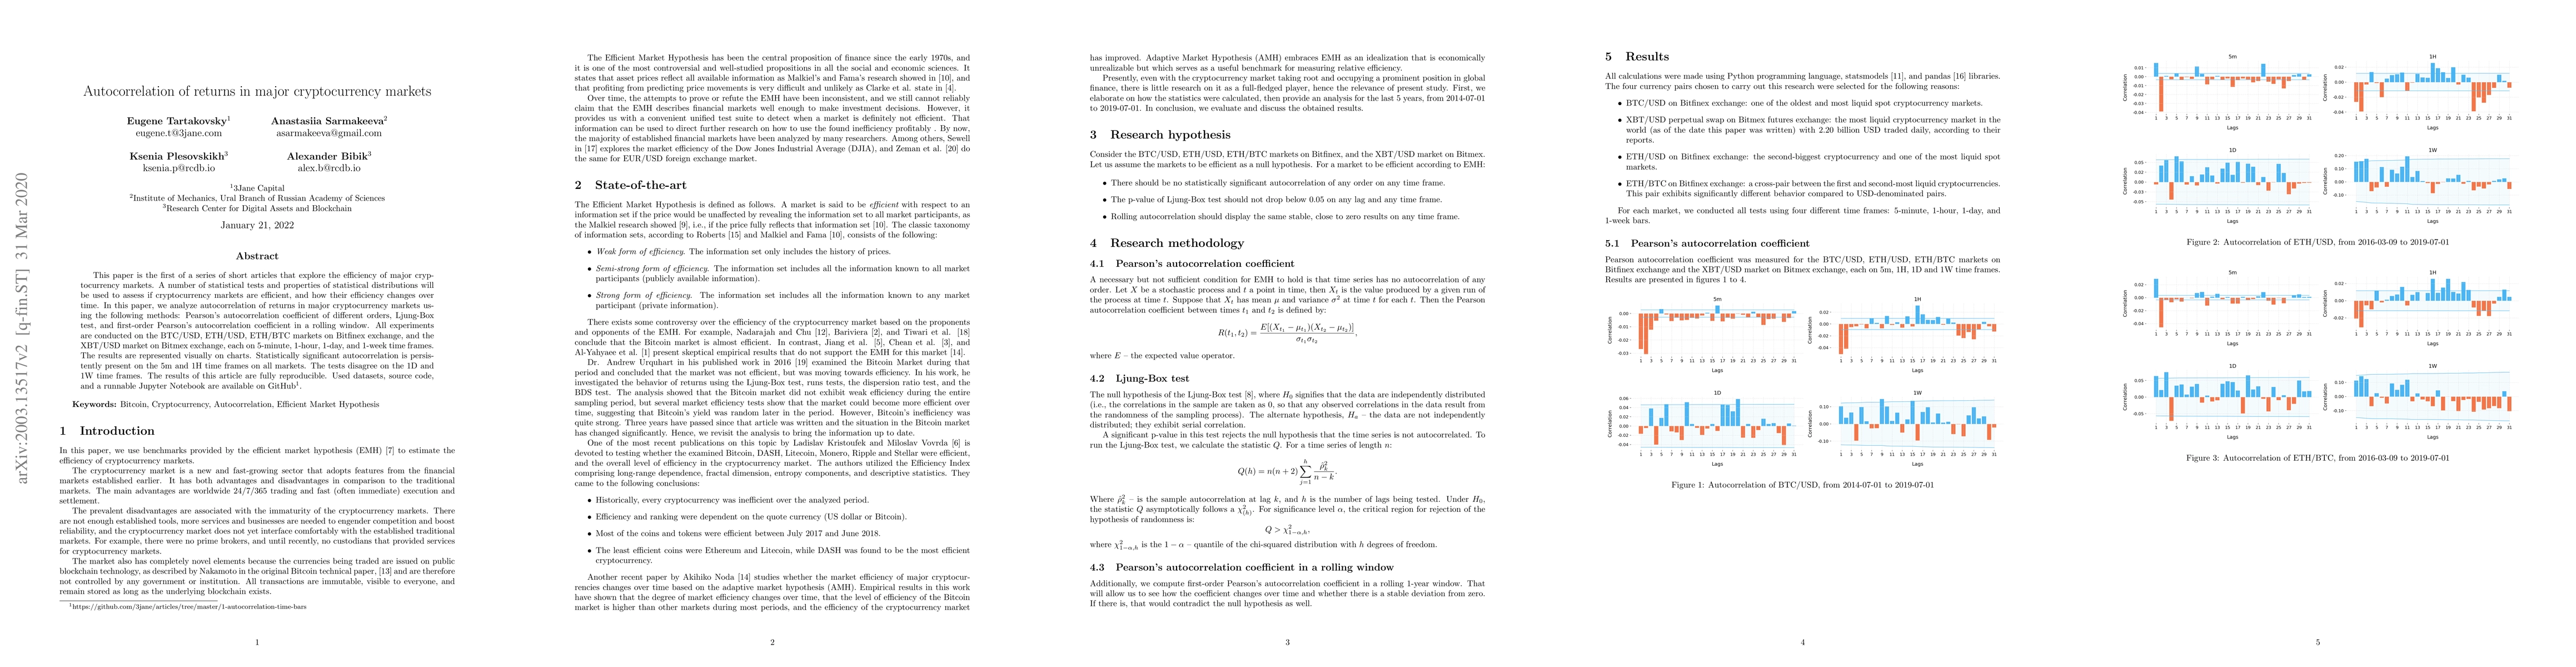
This paper is the first of a series of short articles that explore the efficiency of major cryptocurrency markets. A number of statistical tests and properties of statistical distributions will be used to assess if cryptocurrency markets are efficient, and how their efficiency changes over time. In this paper, we analyze autocorrelation of returns in major cryptocurrency markets using the following methods: Pearson's autocorrelation coefficient of different orders, Ljung-Box test, and first-order Pearson's autocorrelation coefficient in a rolling window. All experiments are conducted on the BTC/USD, ETH/USD, ETH/BTC markets on Bitfinex exchange, and the XBT/USD market on Bitmex exchange, each on 5-minute, 1-hour, 1-day, and 1-week time frames. The results are represented visually on charts. Statistically significant autocorrelation is persistently present on the 5m and 1H time frames on all markets. The tests disagree on the 1D and 1W time frames. The results of this article are fully reproducible. Used datasets, source code, and a runnable Jupyter Notebook are available on GitHub.
AI Key Findings
Get AI-generated insights about this paper's methodology, results, significance, and more — seven facets brought into focus.
Impact
Paper Details
Authors
PDF Preview
Key Terms
Citation Network
Current paper (gray), citations (green), references (blue)
Display is limited for performance on very large graphs.
Discussion 0