AI Quick Summary
This paper presents an automatic algorithm for generating high-quality polygon layouts to visualize N-ary relationships, optimizing based on identified design principles. It also introduces a dual visualization approach and a joint optimization framework for complementary data inspection.
Paper Preview
Abstract
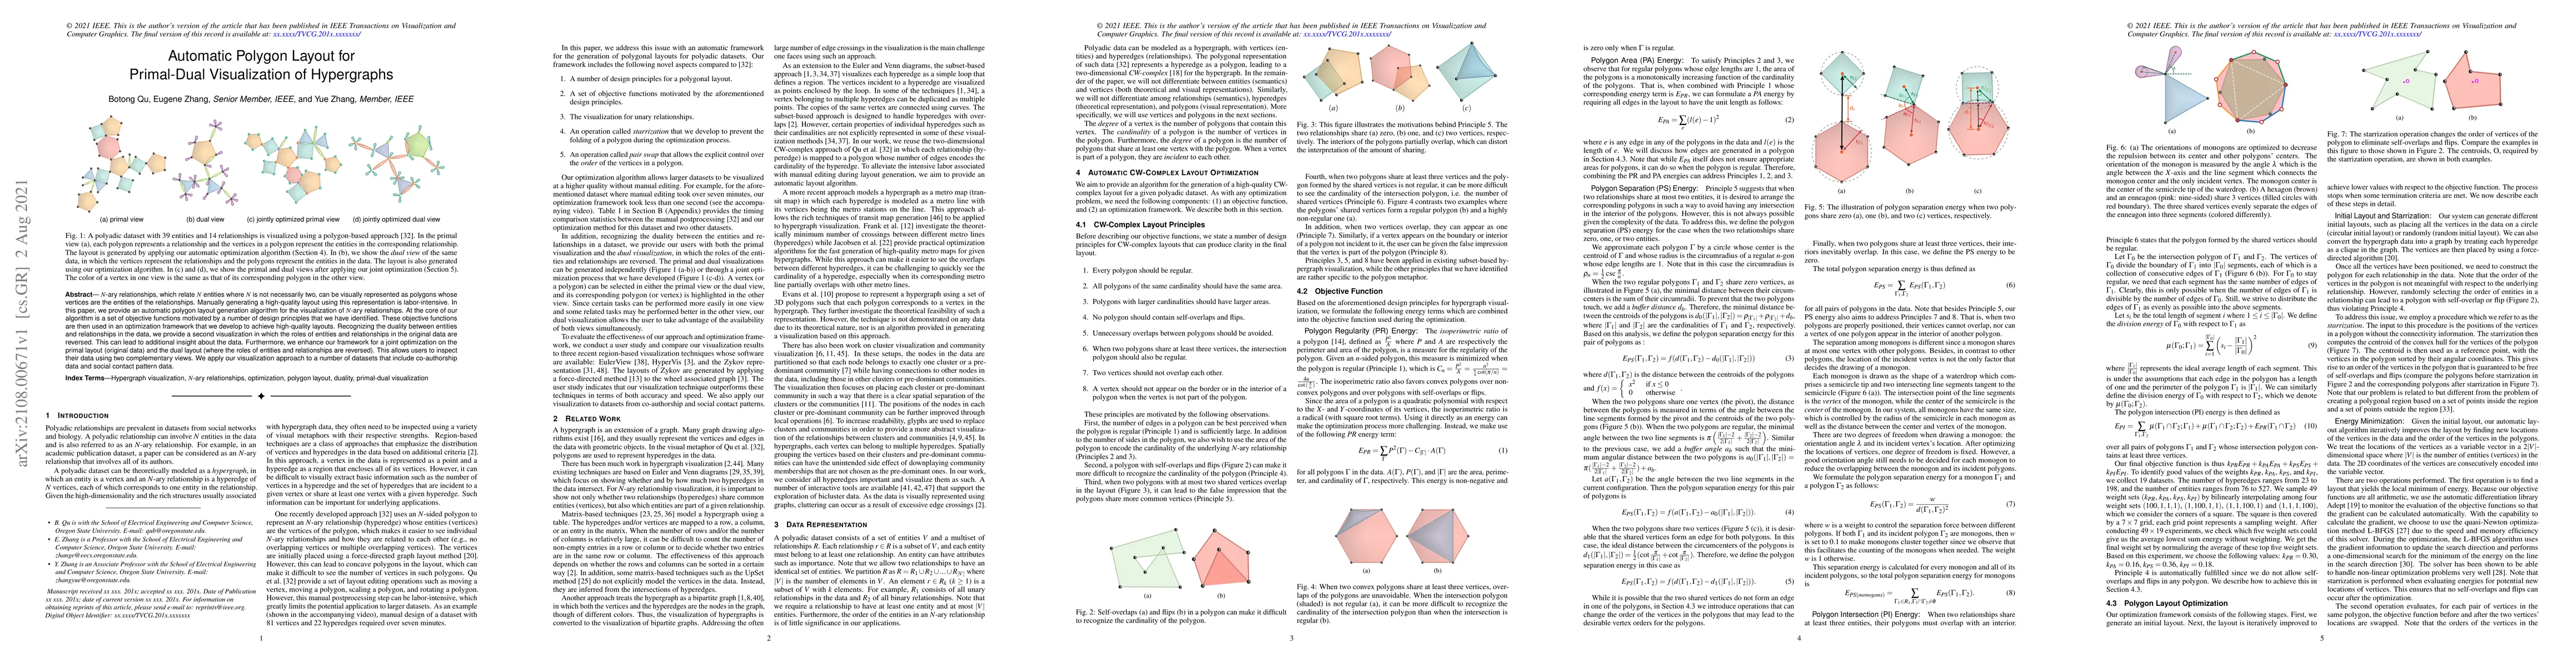
N-ary relationships, which relate N entities where N is not necessarily two, can be visually represented as polygons whose vertices are the entities of the relationships. Manually generating a high-quality layout using this representation is labor-intensive. In this paper, we provide an automatic polygon layout generation algorithm for the visualization of N-ary relationships. At the core of our algorithm is a set of objective functions motivated by a number of design principles that we have identified. These objective functions are then used in an optimization framework that we develop to achieve high-quality layouts. Recognizing the duality between entities and relationships in the data, we provide a second visualization in which the roles of entities and relationships in the original data are reversed. This can lead to additional insight about the data. Furthermore, we enhance our framework for a joint optimization on the primal layout (original data) and the dual layout (where the roles of entities and relationships are reversed). This allows users to inspect their data using two complementary views. We apply our visualization approach to a number of datasets that include co-authorship data and social contact pattern data.
AI Key Findings
Get AI-generated insights about this paper's methodology, results, and significance.
Paper Details
How to Cite This Paper
@article{qu2021automatic,
  title         = {Automatic Polygon Layout for Primal-Dual Visualization of Hypergraphs},
  author        = {Qu, Botong and Zhang, Eugene and Zhang, Yue},
  year          = {2021},
  eprint        = {2108.00671},
  archivePrefix = {arXiv},
  primaryClass  = {cs.GR},
}Qu, B., Zhang, E., & Zhang, Y. (2021). Automatic Polygon Layout for Primal-Dual Visualization of Hypergraphs. arXiv. https://arxiv.org/abs/2108.00671Qu, Botong, et al. "Automatic Polygon Layout for Primal-Dual Visualization of Hypergraphs." arXiv, 2021, arxiv.org/abs/2108.00671.PDF Preview
Key Terms
Citation Network
Current paper (gray), citations (green), references (blue)
Display is limited for performance on very large graphs.
Similar Papers
Found 4 papers| Title | Authors | Year | Actions |
|---|
Comments (0)