Autoplotly - Automatic Generation of Interactive Visualizations for Popular Statistical Results
Publication
Metrics
AI Quick Summary
Summary: The autoplotly package automates the creation of interactive visualizations for popular statistical results, leveraging ggfortify, plotly, and ggplot2, and allows for easy customization using ggplot2 and plotly syntax.
Paper Preview
Abstract
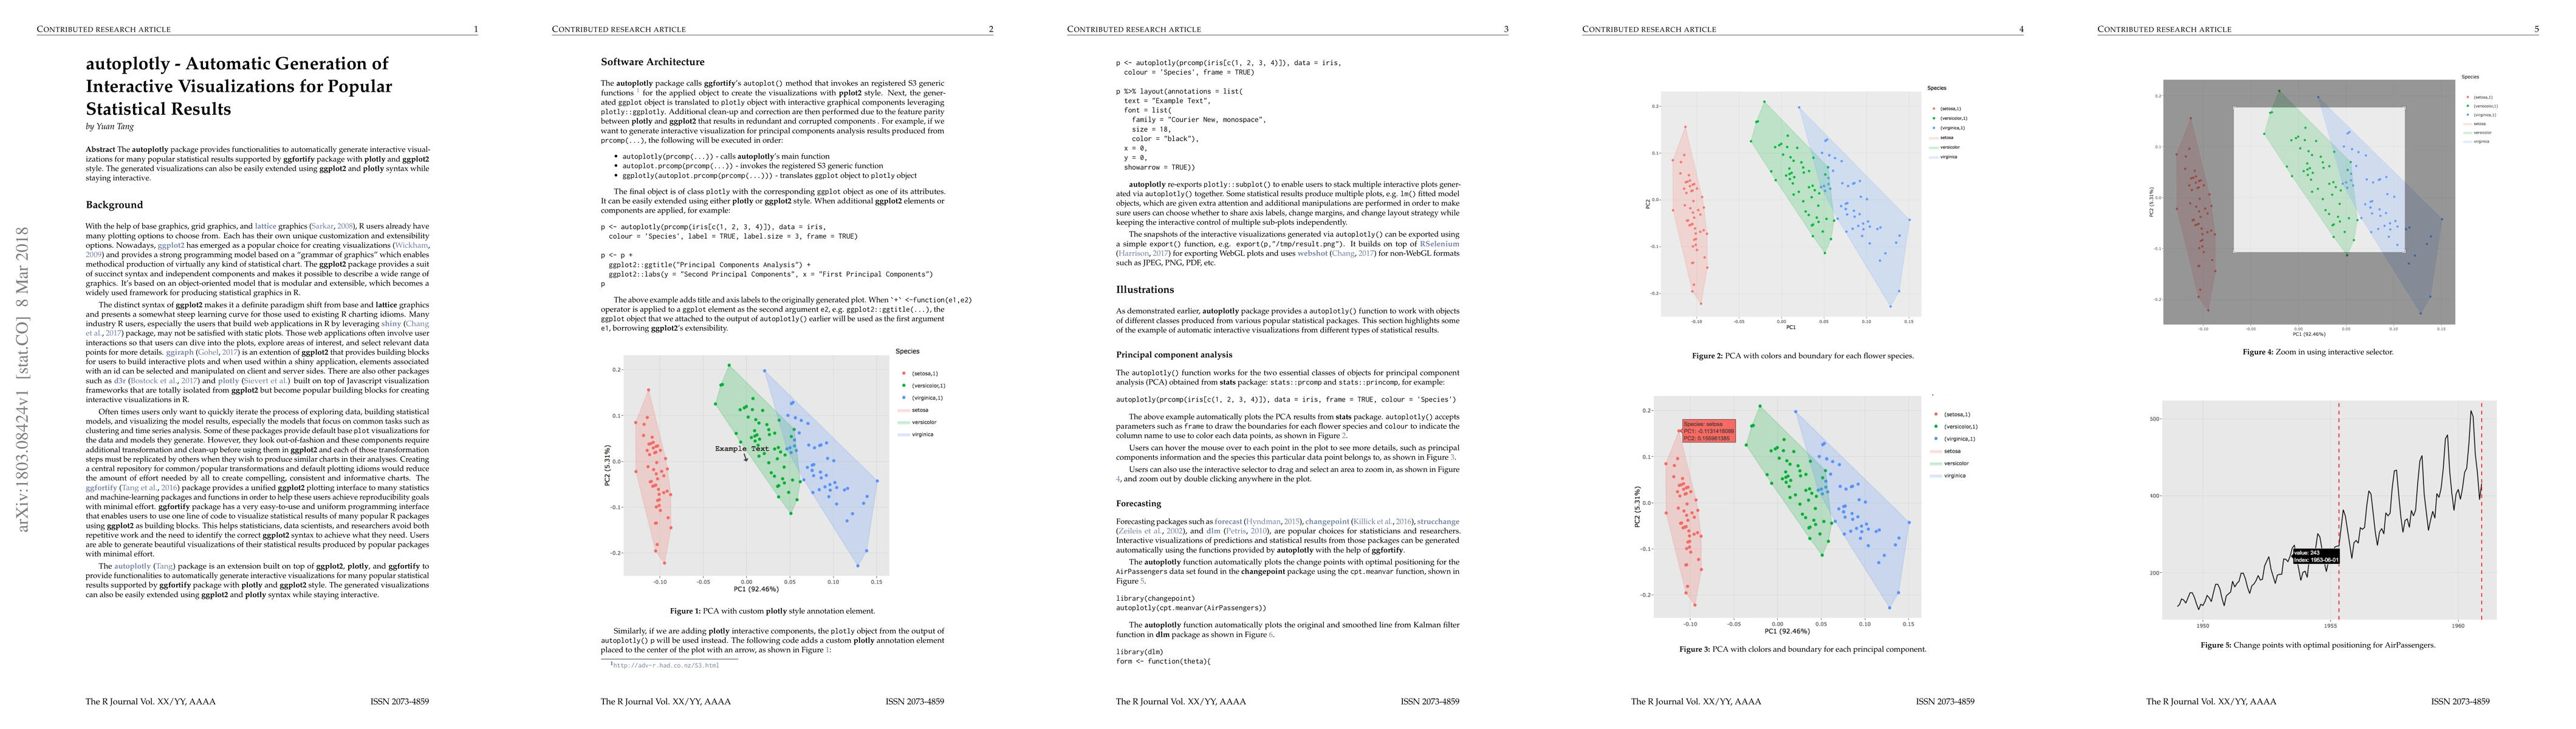
The autoplotly package provides functionalities to automatically generate interactive visualizations for many popular statistical results supported by ggfortify package with plotly and ggplot2 style. The generated visualizations can also be easily extended using ggplot2 and plotly syntax while staying interactive.
AI Key Findings
Get AI-generated insights about this paper's methodology, results, significance, and more — seven facets brought into focus.
Impact
Paper Details
PDF Preview
Key Terms
Citation Network
Current paper (gray), citations (green), references (blue)
Display is limited for performance on very large graphs.
Discussion 0