Average Estimates in Line Graphs Are Biased Toward Areas of Higher Variability
Publication
Metrics
AI Quick Summary
This study reveals a bias in line graph interpretations where average estimates are skewed toward areas of higher variability, termed variability overweighting. Experiments with 560 participants show this bias can be mitigated using dot encodings instead of lines. The bias likely stems from the visual salience of more variable segments.
Paper Preview
Abstract
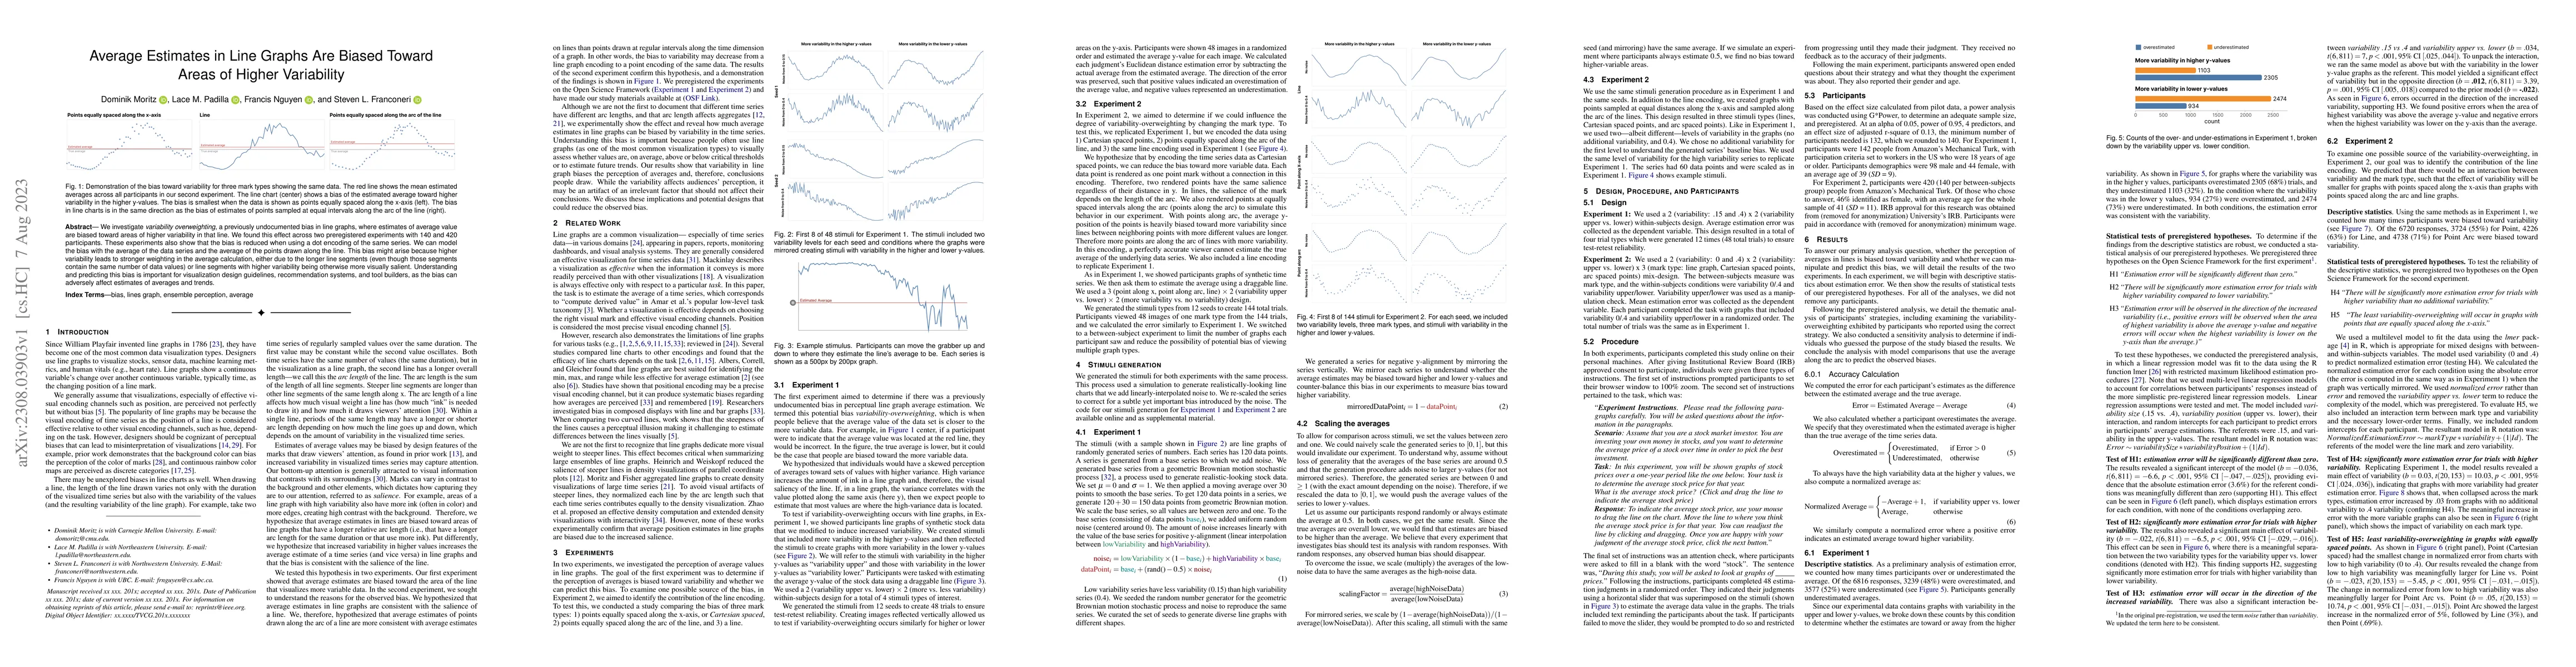
We investigate variability overweighting, a previously undocumented bias in line graphs, where estimates of average value are biased toward areas of higher variability in that line. We found this effect across two preregistered experiments with 140 and 420 participants. These experiments also show that the bias is reduced when using a dot encoding of the same series. We can model the bias with the average of the data series and the average of the points drawn along the line. This bias might arise because higher variability leads to stronger weighting in the average calculation, either due to the longer line segments (even though those segments contain the same number of data values) or line segments with higher variability being otherwise more visually salient. Understanding and predicting this bias is important for visualization design guidelines, recommendation systems, and tool builders, as the bias can adversely affect estimates of averages and trends.
AI Key Findings
Get AI-generated insights about this paper's methodology, results, significance, and more — seven facets brought into focus.
Impact
Paper Details
Authors
PDF Preview
Key Terms
Citation Network
Current paper (gray), citations (green), references (blue)
Display is limited for performance on very large graphs.
Discussion 0