Academic Profile
Statistics
Similar Authors
Papers on arXiv
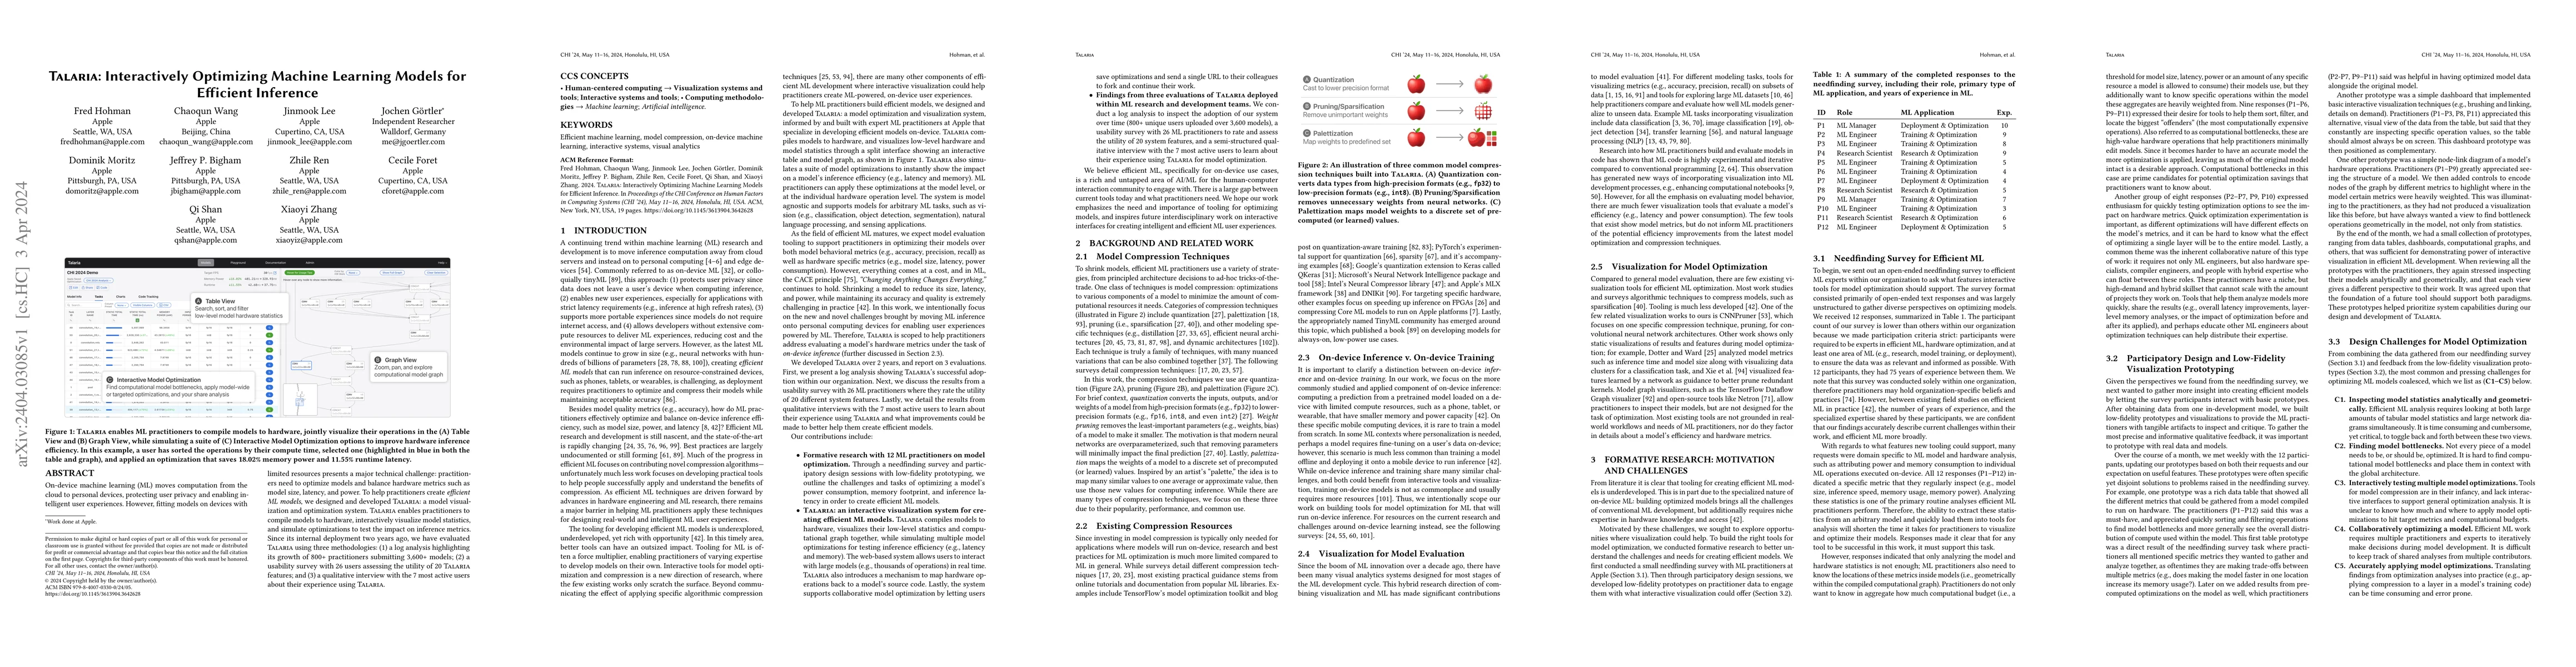
On-device machine learning (ML) moves computation from the cloud to personal devices, protecting user privacy and enabling intelligent user experiences. However, fitting models on devices with limit...
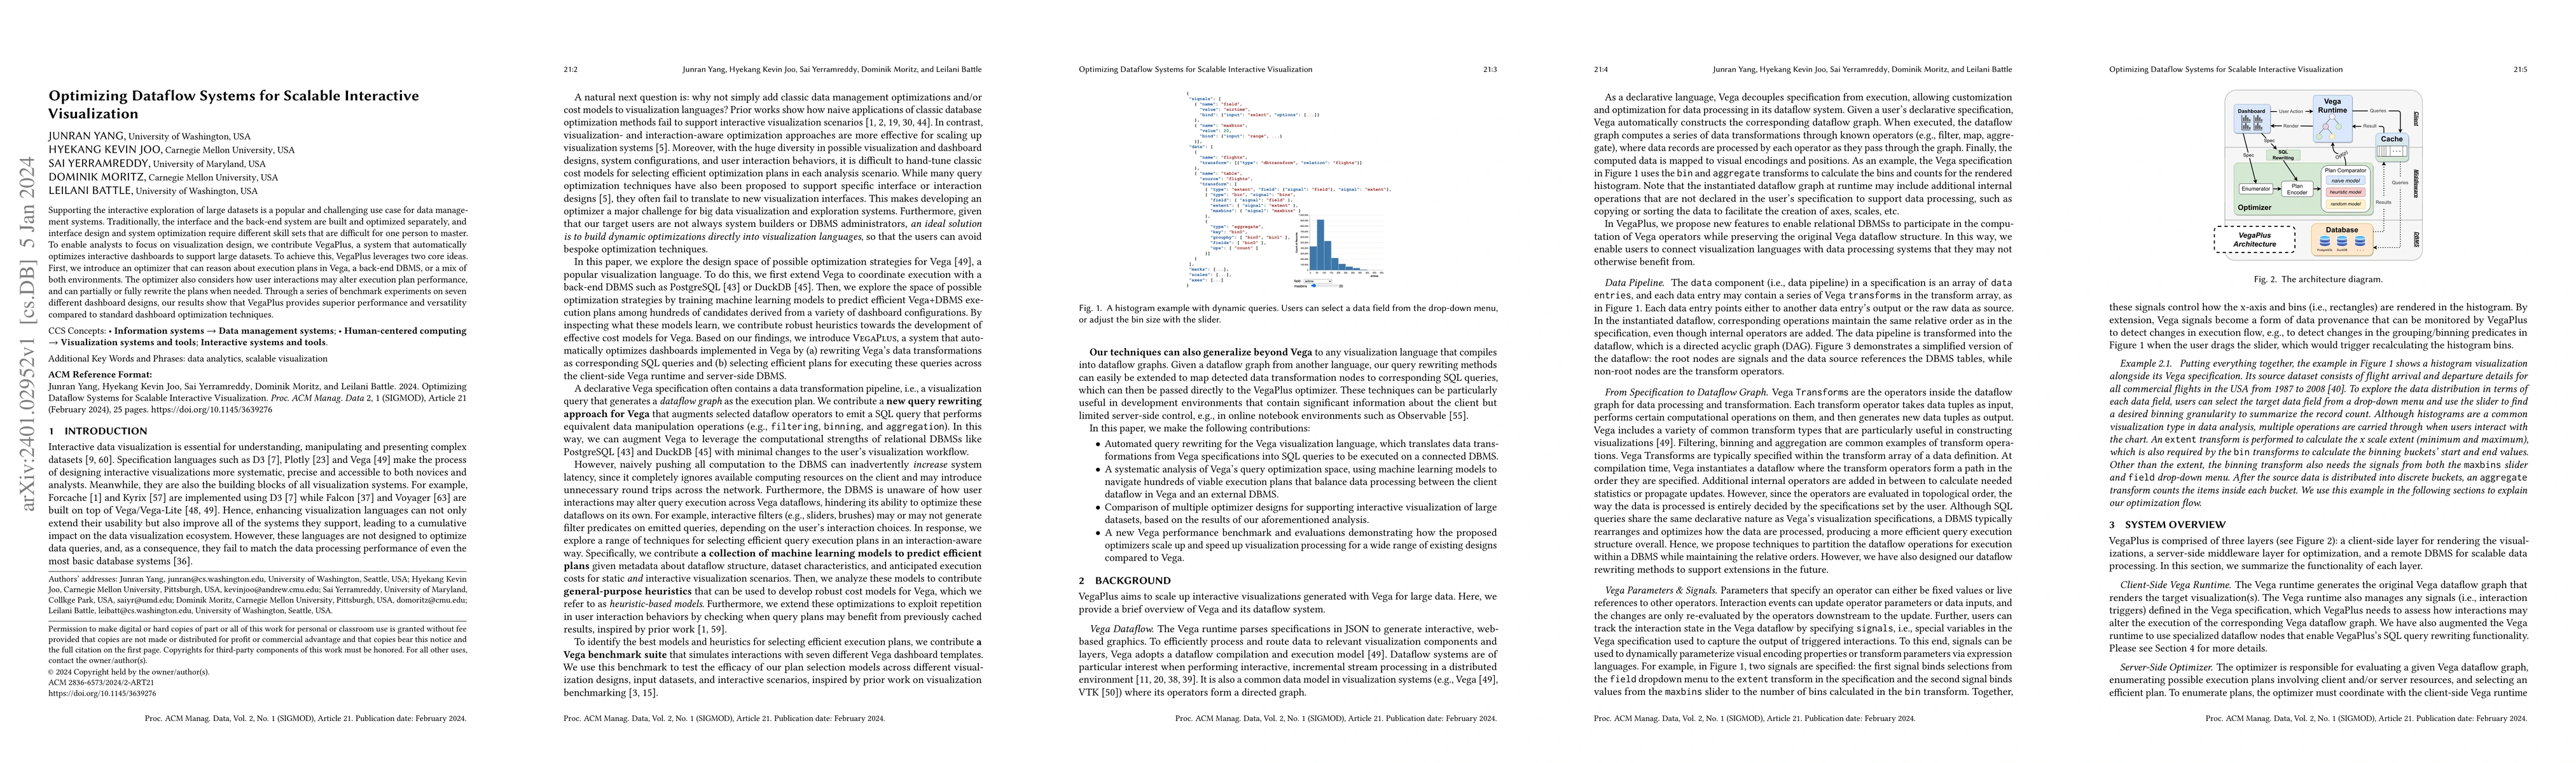
Supporting the interactive exploration of large datasets is a popular and challenging use case for data management systems. Traditionally, the interface and the back-end system are built and optimiz...
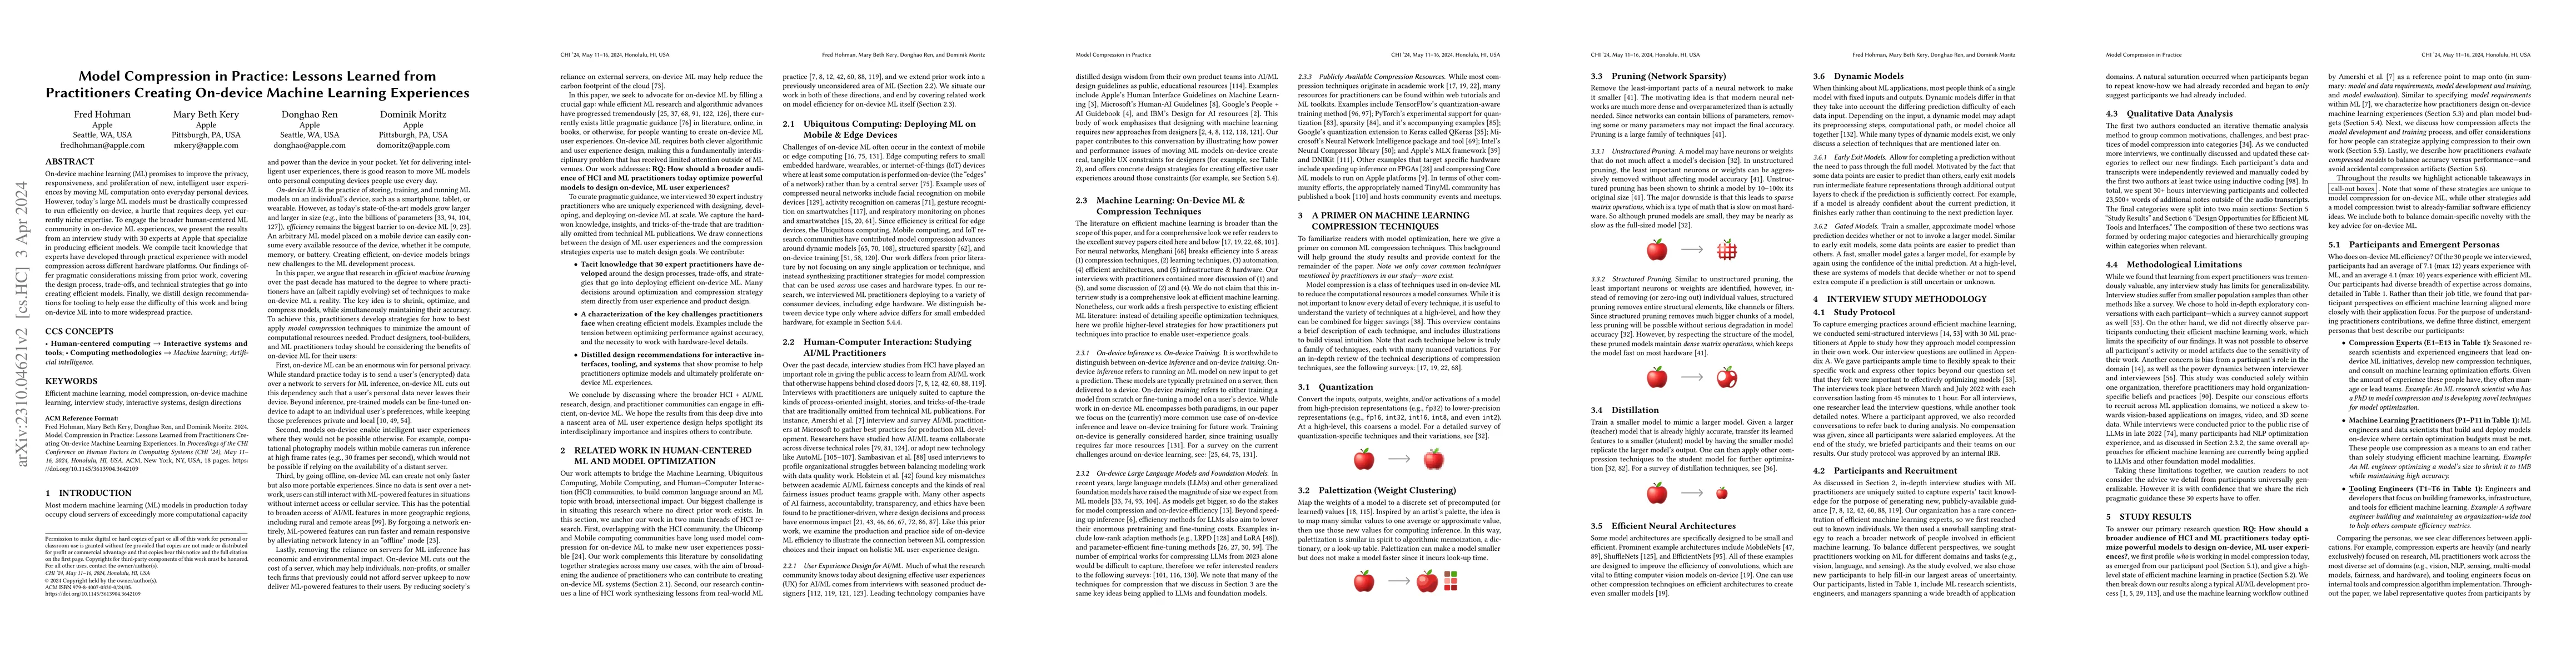
On-device machine learning (ML) promises to improve the privacy, responsiveness, and proliferation of new, intelligent user experiences by moving ML computation onto everyday personal devices. Howev...
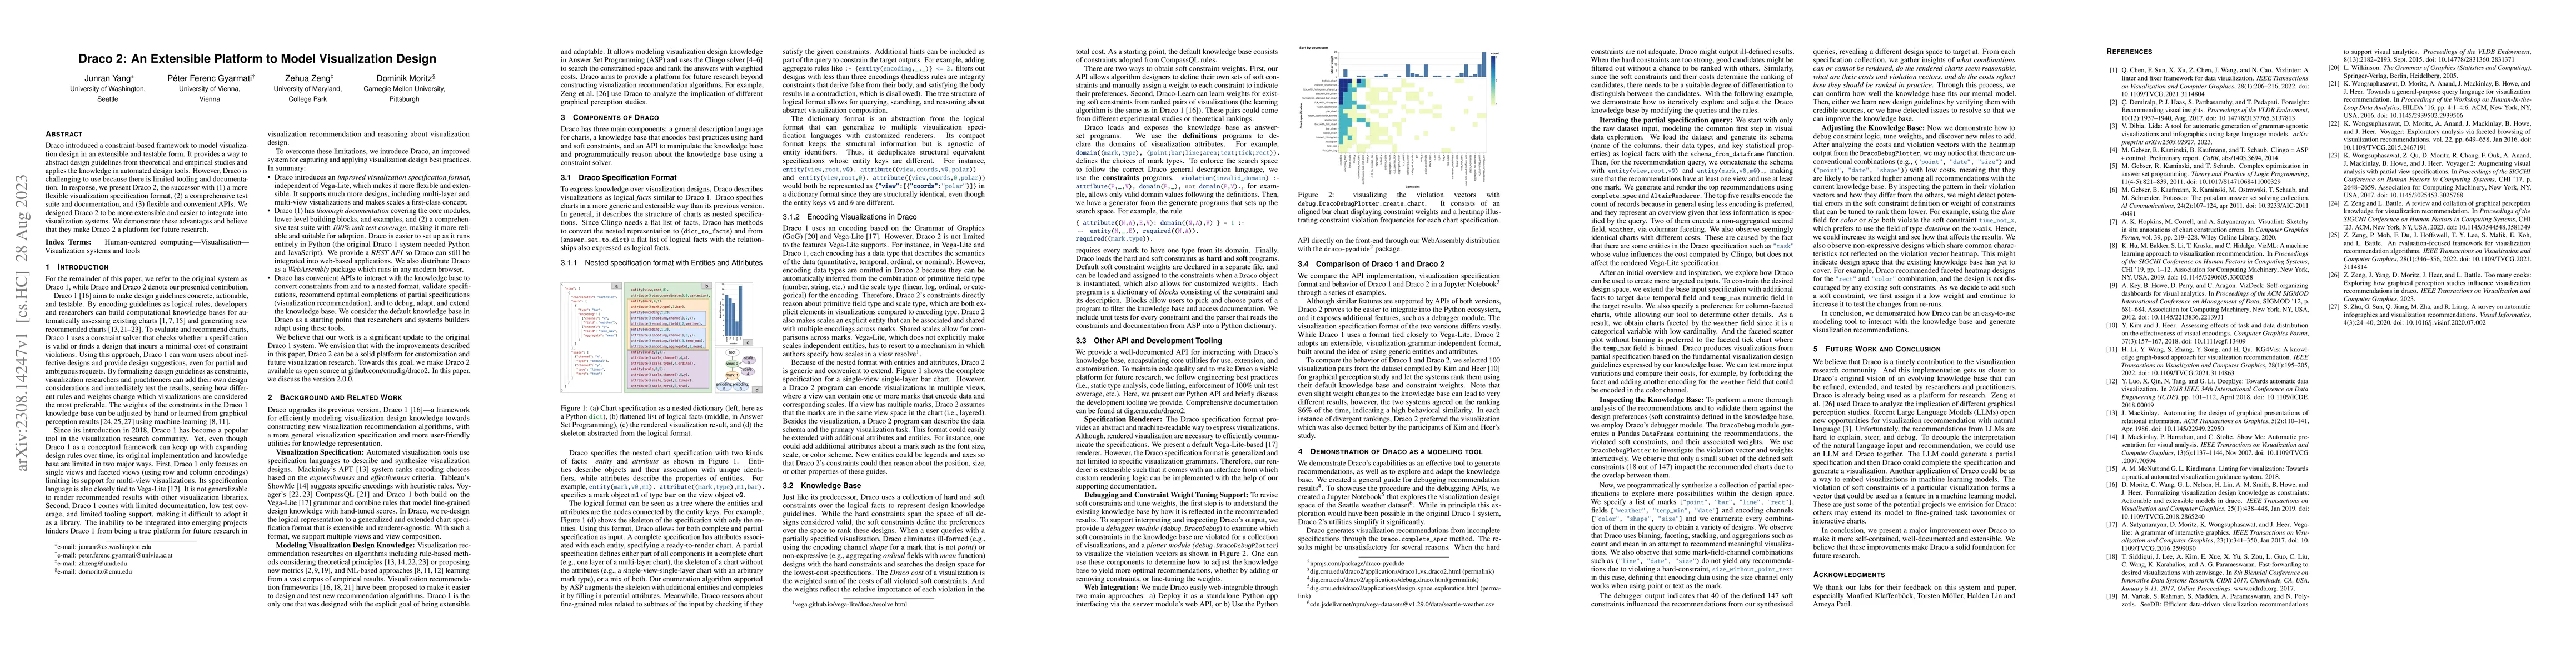
Draco introduced a constraint-based framework to model visualization design in an extensible and testable form. It provides a way to abstract design guidelines from theoretical and empirical studies...
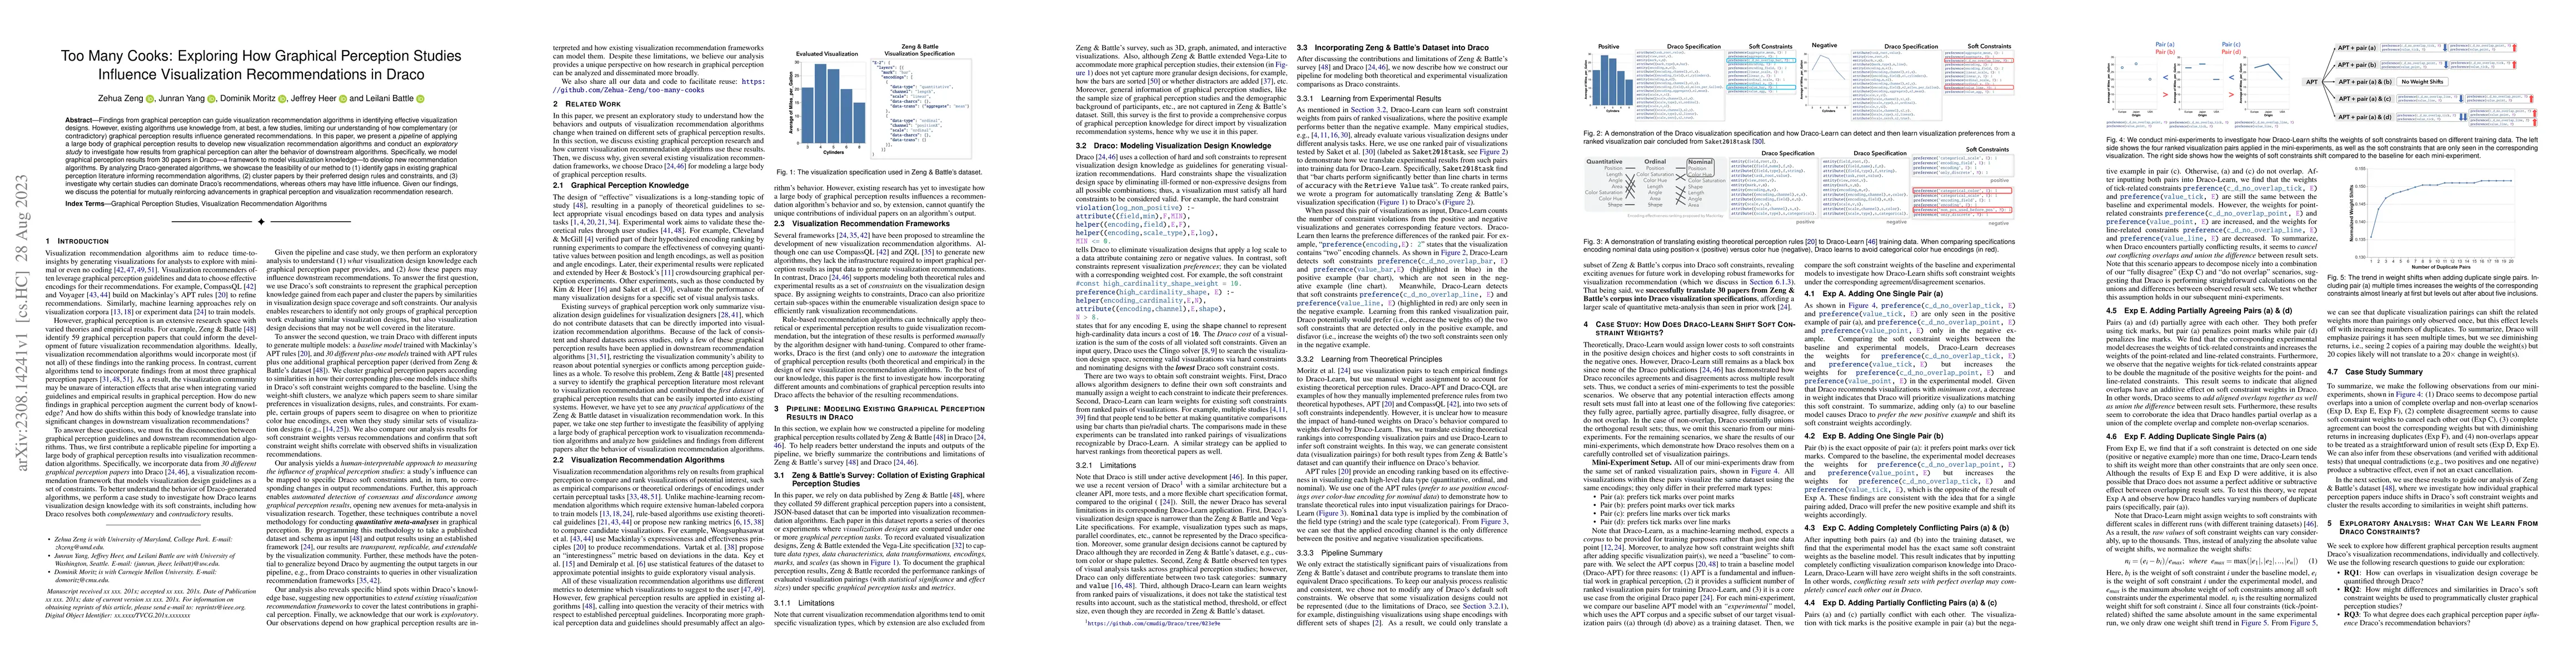
Findings from graphical perception can guide visualization recommendation algorithms in identifying effective visualization designs. However, existing algorithms use knowledge from, at best, a few s...
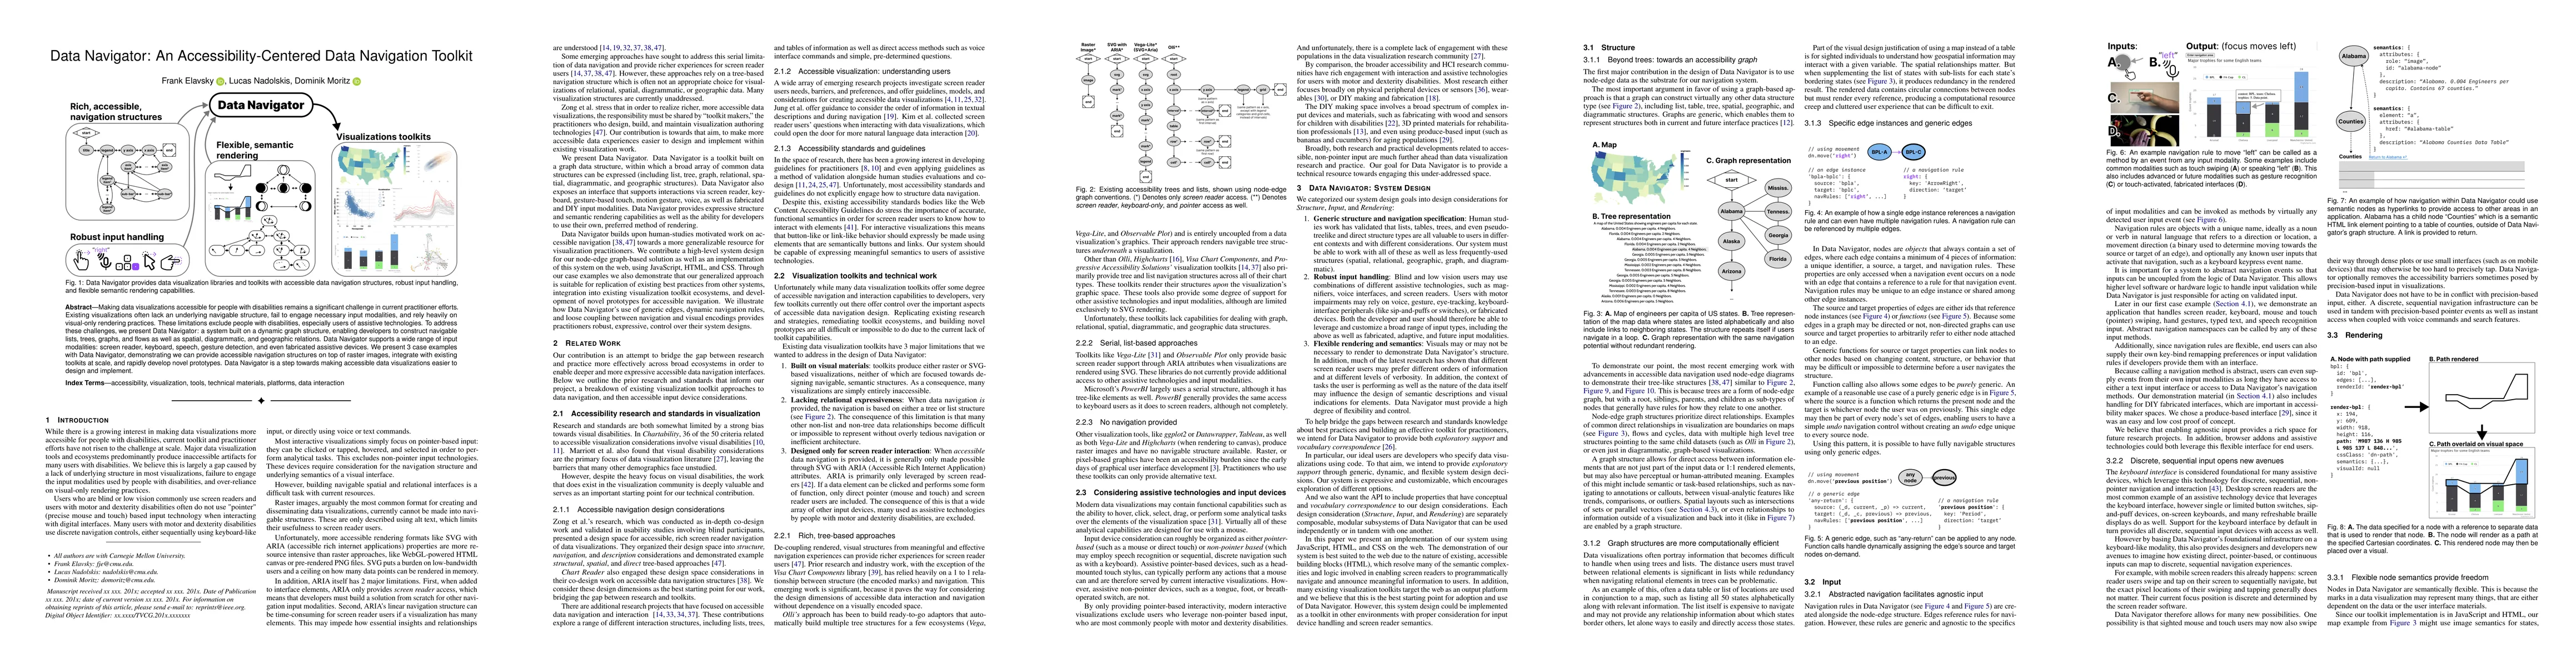
Making data visualizations accessible for people with disabilities remains a significant challenge in current practitioner efforts. Existing visualizations often lack an underlying navigable structu...
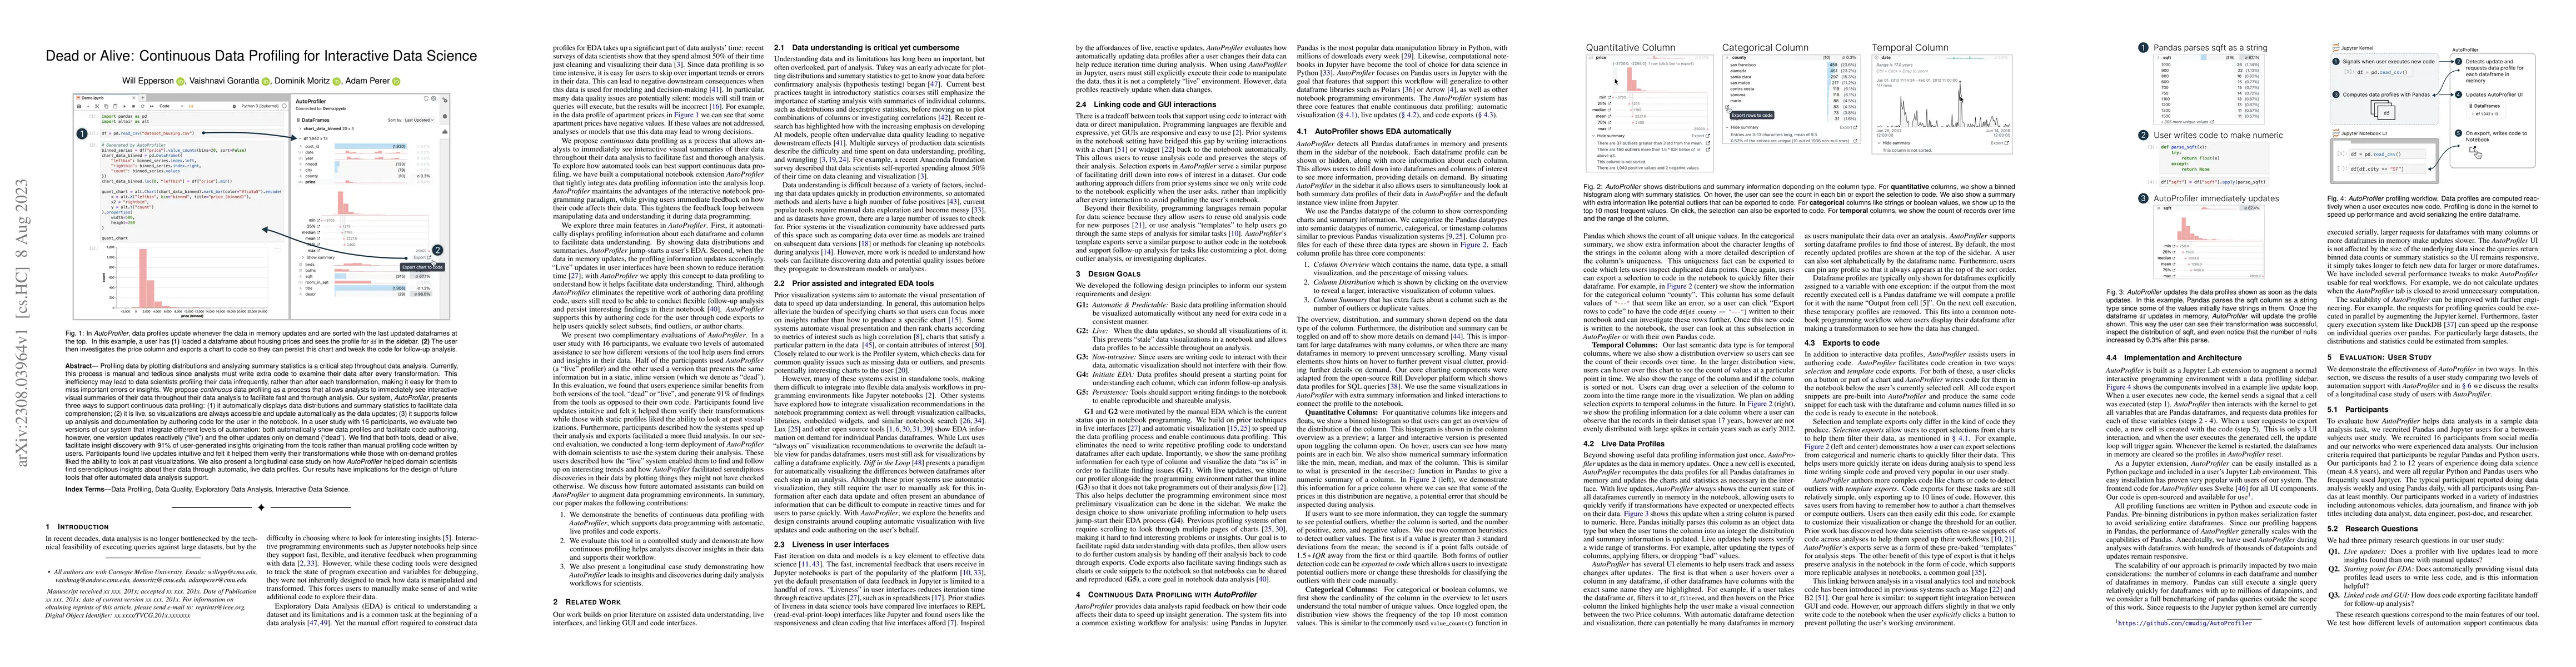
Profiling data by plotting distributions and analyzing summary statistics is a critical step throughout data analysis. Currently, this process is manual and tedious since analysts must write extra c...
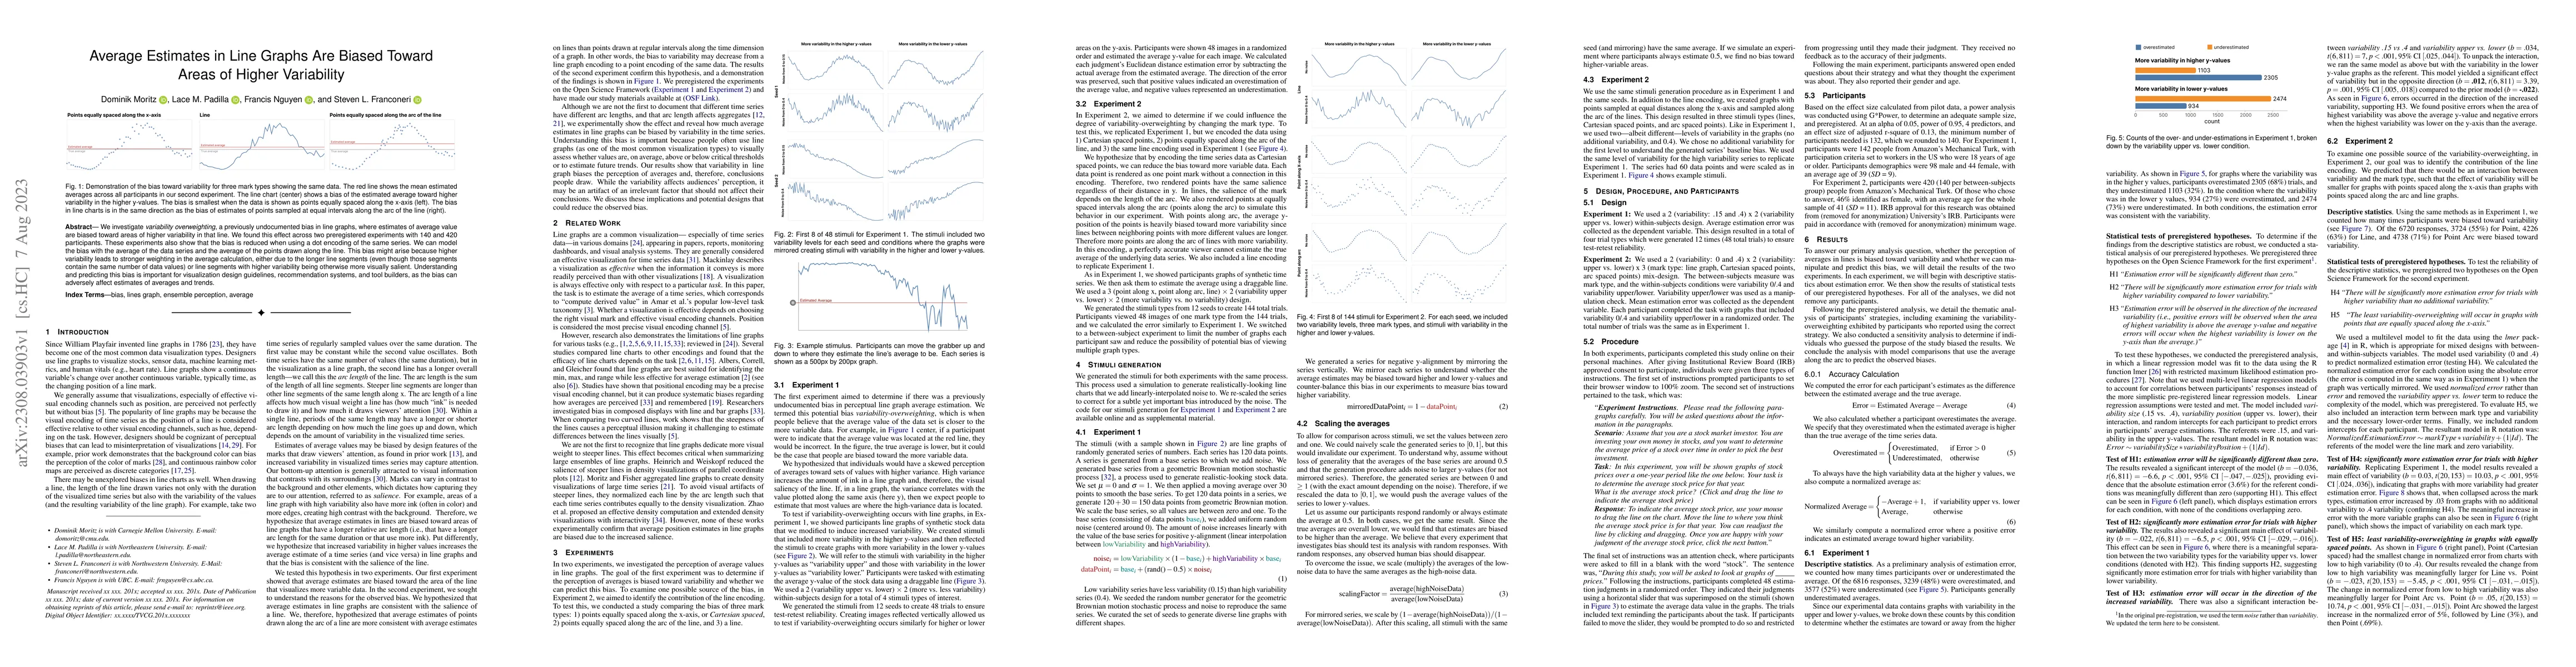
We investigate variability overweighting, a previously undocumented bias in line graphs, where estimates of average value are biased toward areas of higher variability in that line. We found this ef...
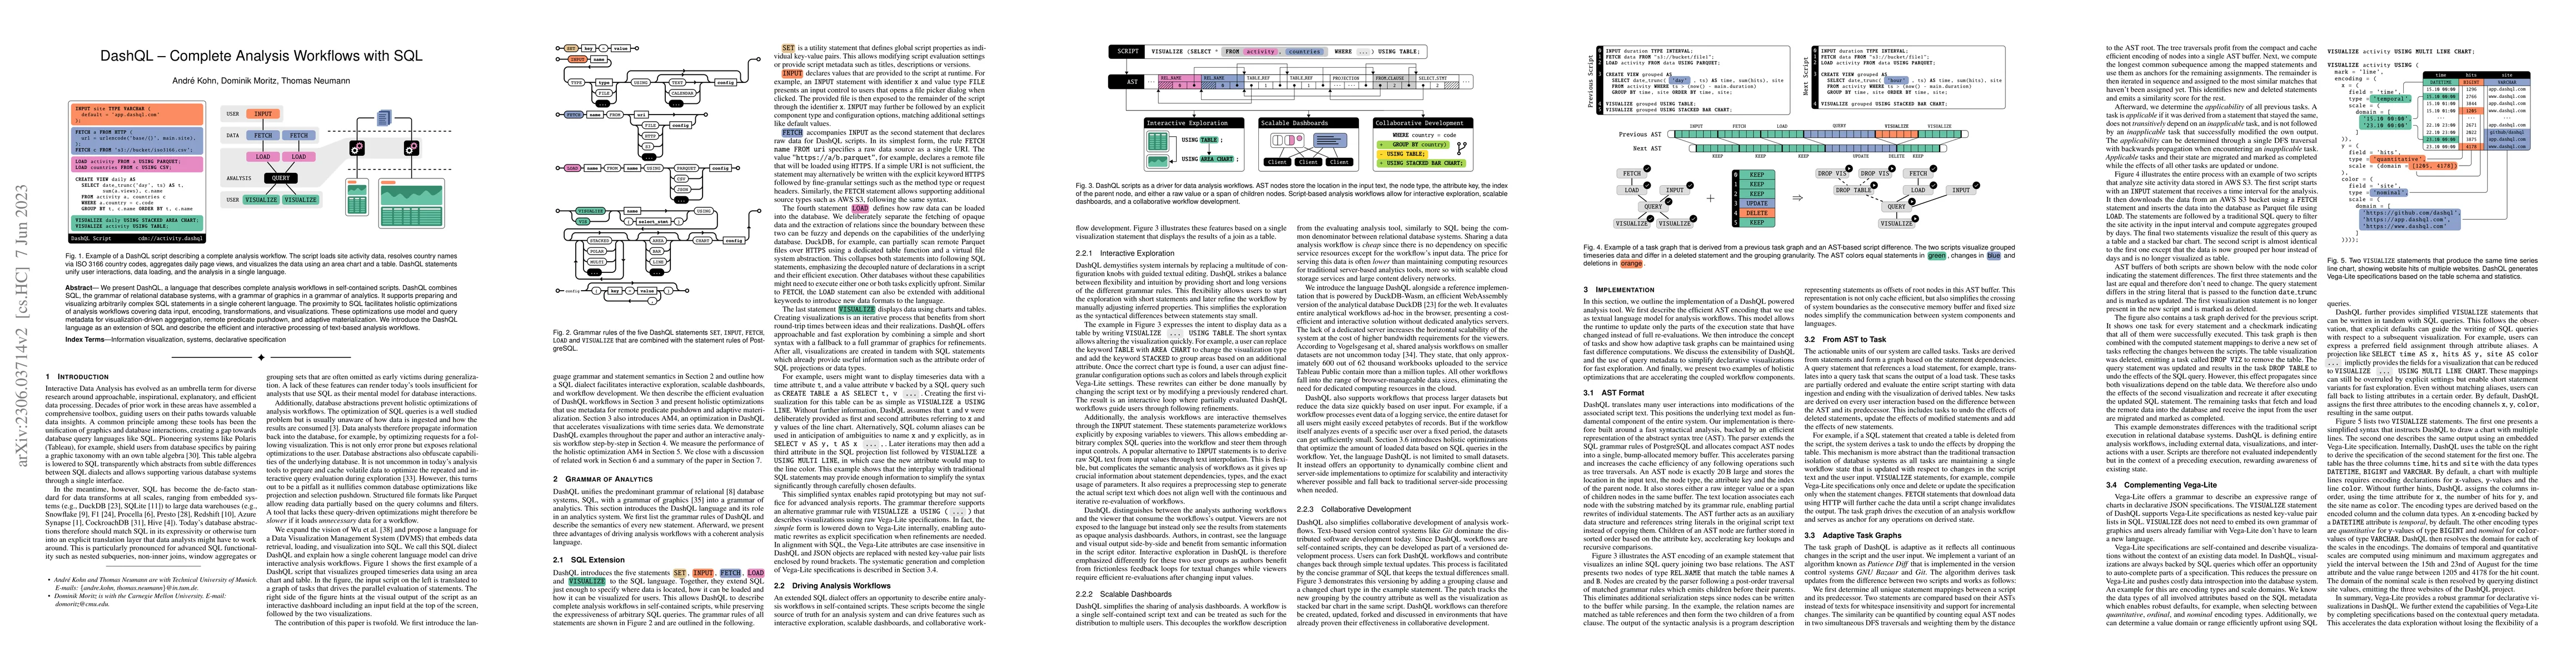
We present DashQL, a language that describes complete analysis workflows in self-contained scripts. DashQL combines SQL, the grammar of relational database systems, with a grammar of graphics in a g...
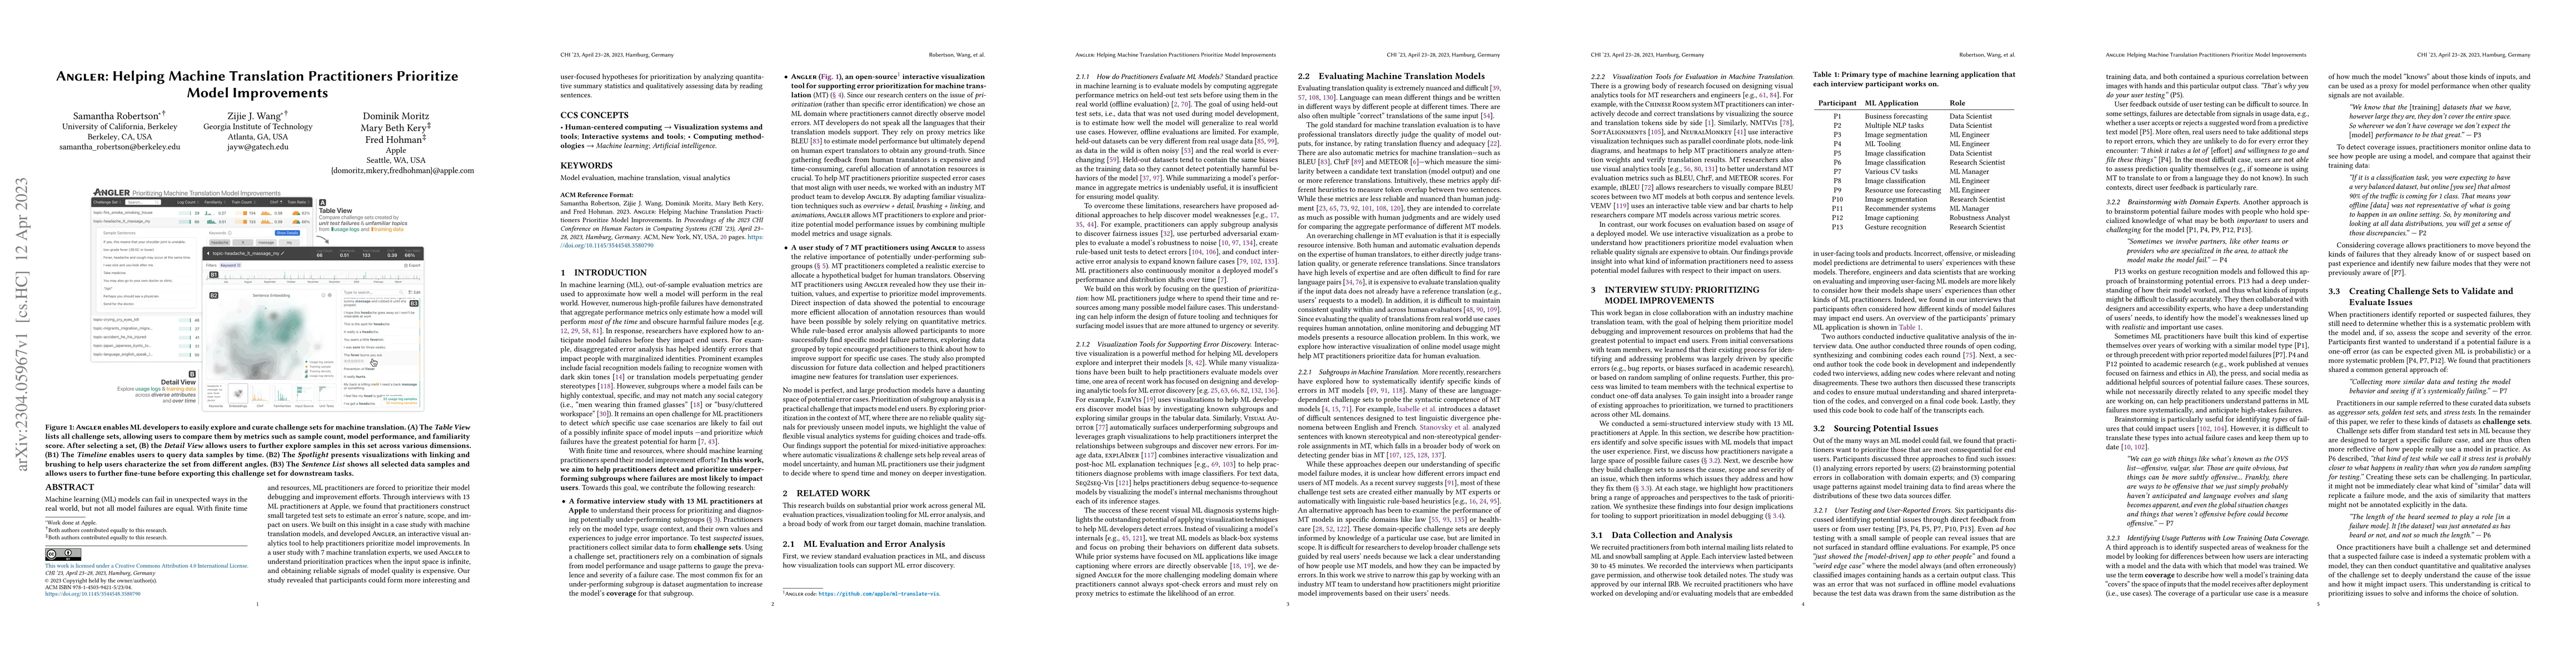
Machine learning (ML) models can fail in unexpected ways in the real world, but not all model failures are equal. With finite time and resources, ML practitioners are forced to prioritize their mode...
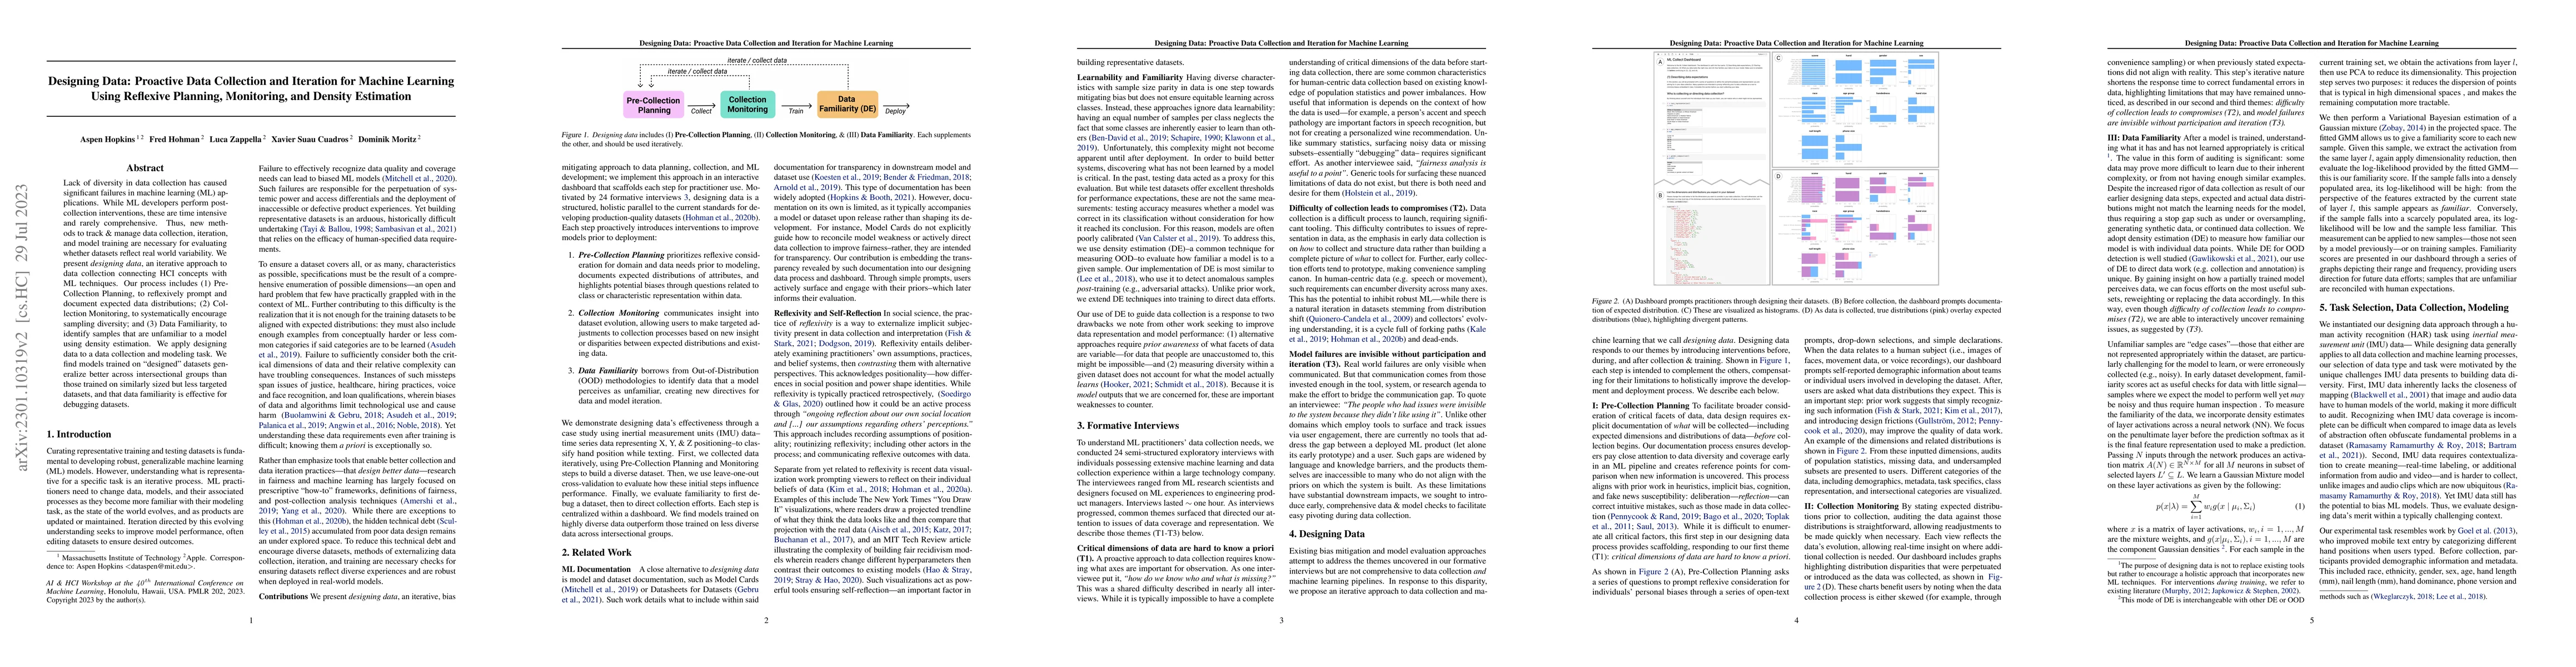
Lack of diversity in data collection has caused significant failures in machine learning (ML) applications. While ML developers perform post-collection interventions, these are time intensive and ra...
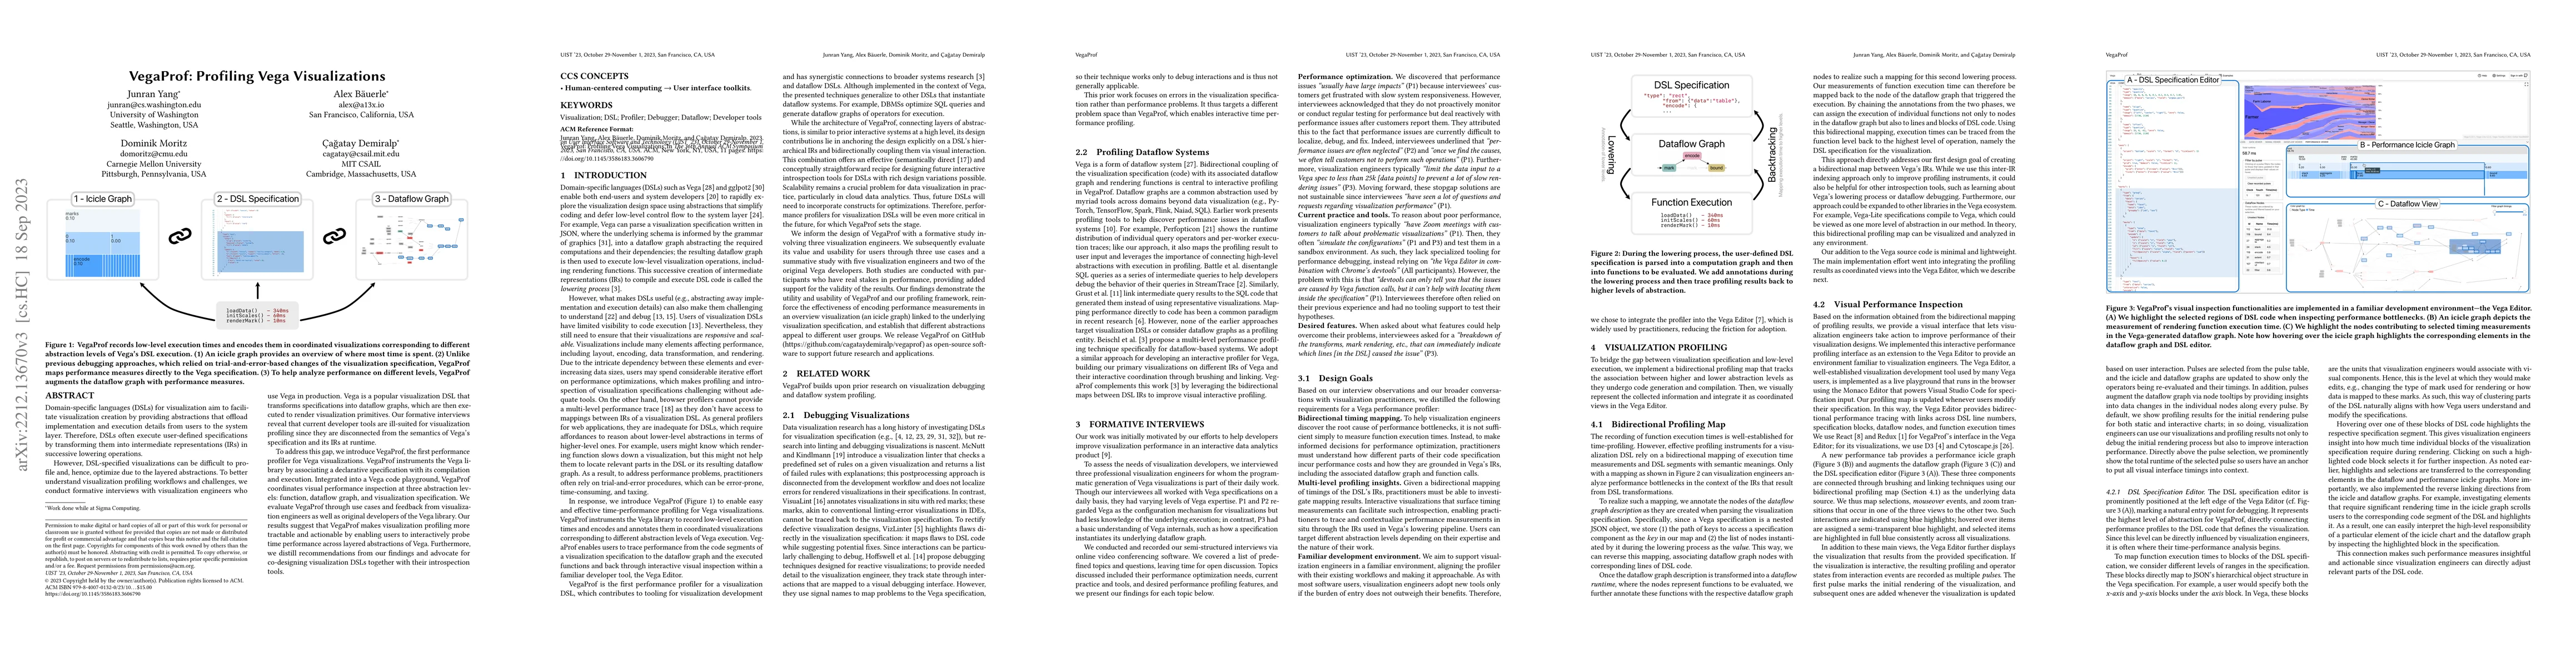
Domain-specific languages (DSLs) for visualization aim to facilitate visualization creation by providing abstractions that offload implementation and execution details from users to the system layer...
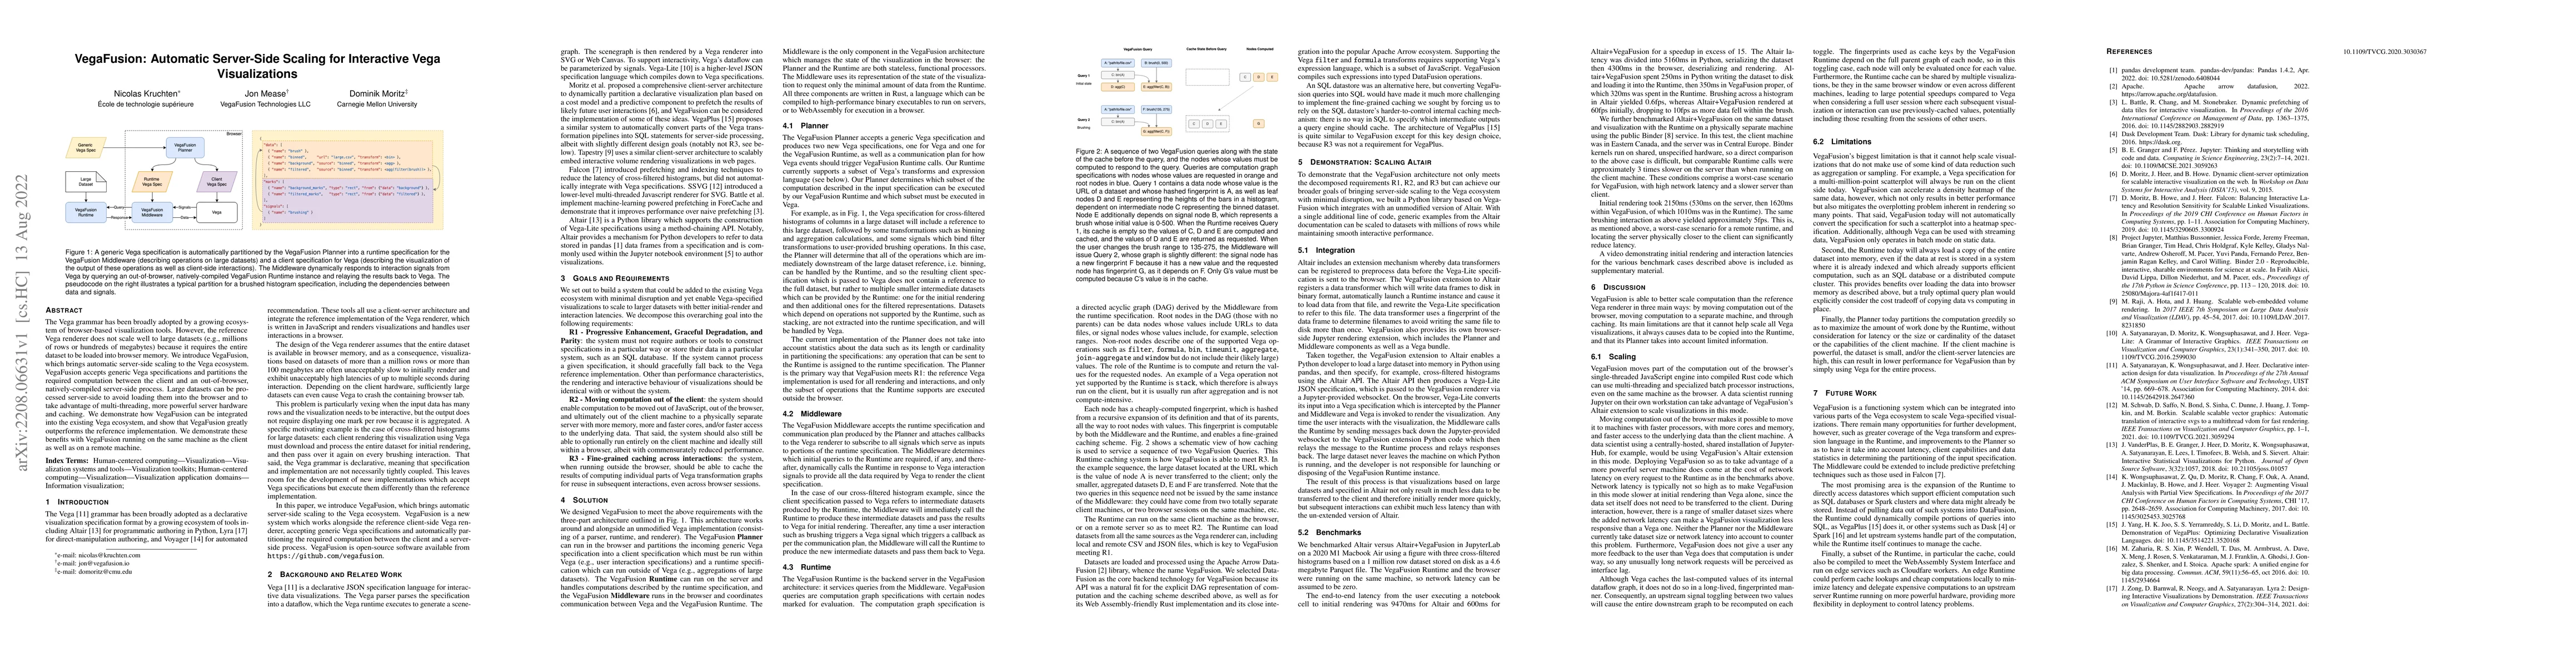
The Vega grammar has been broadly adopted by a growing ecosystem of browser-based visualization tools. However, the reference Vega renderer does not scale well to large datasets (e.g., millions of r...
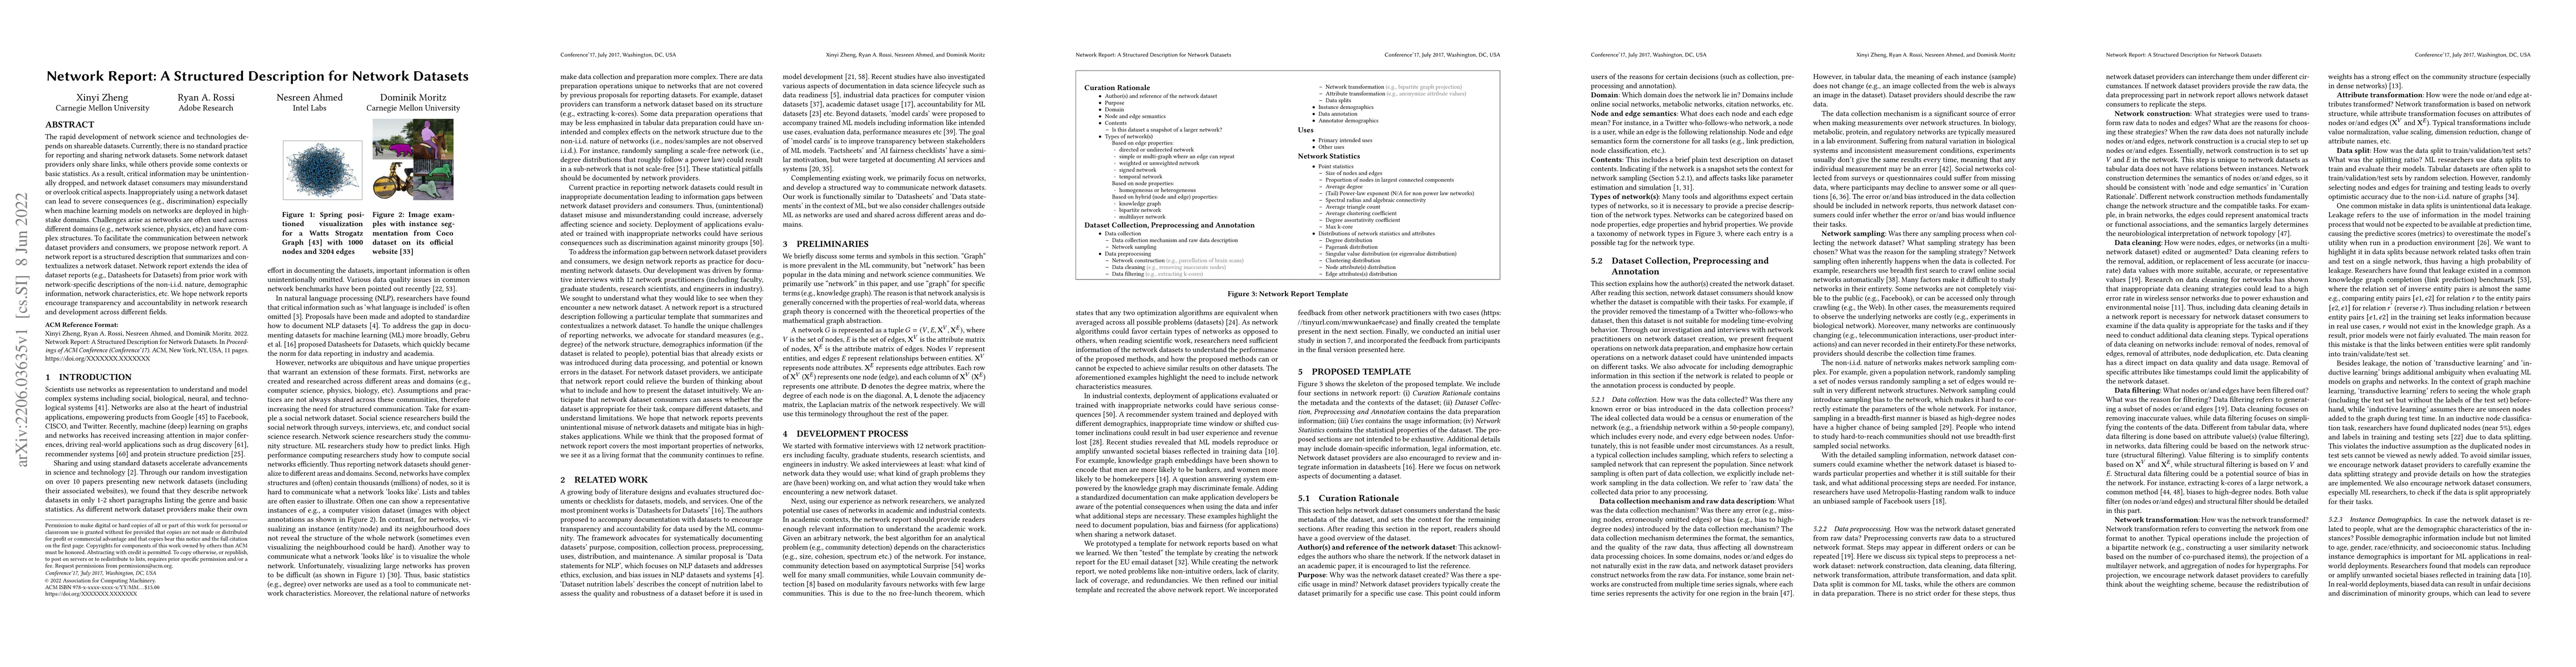
The rapid development of network science and technologies depends on shareable datasets. Currently, there is no standard practice for reporting and sharing network datasets. Some network dataset pro...
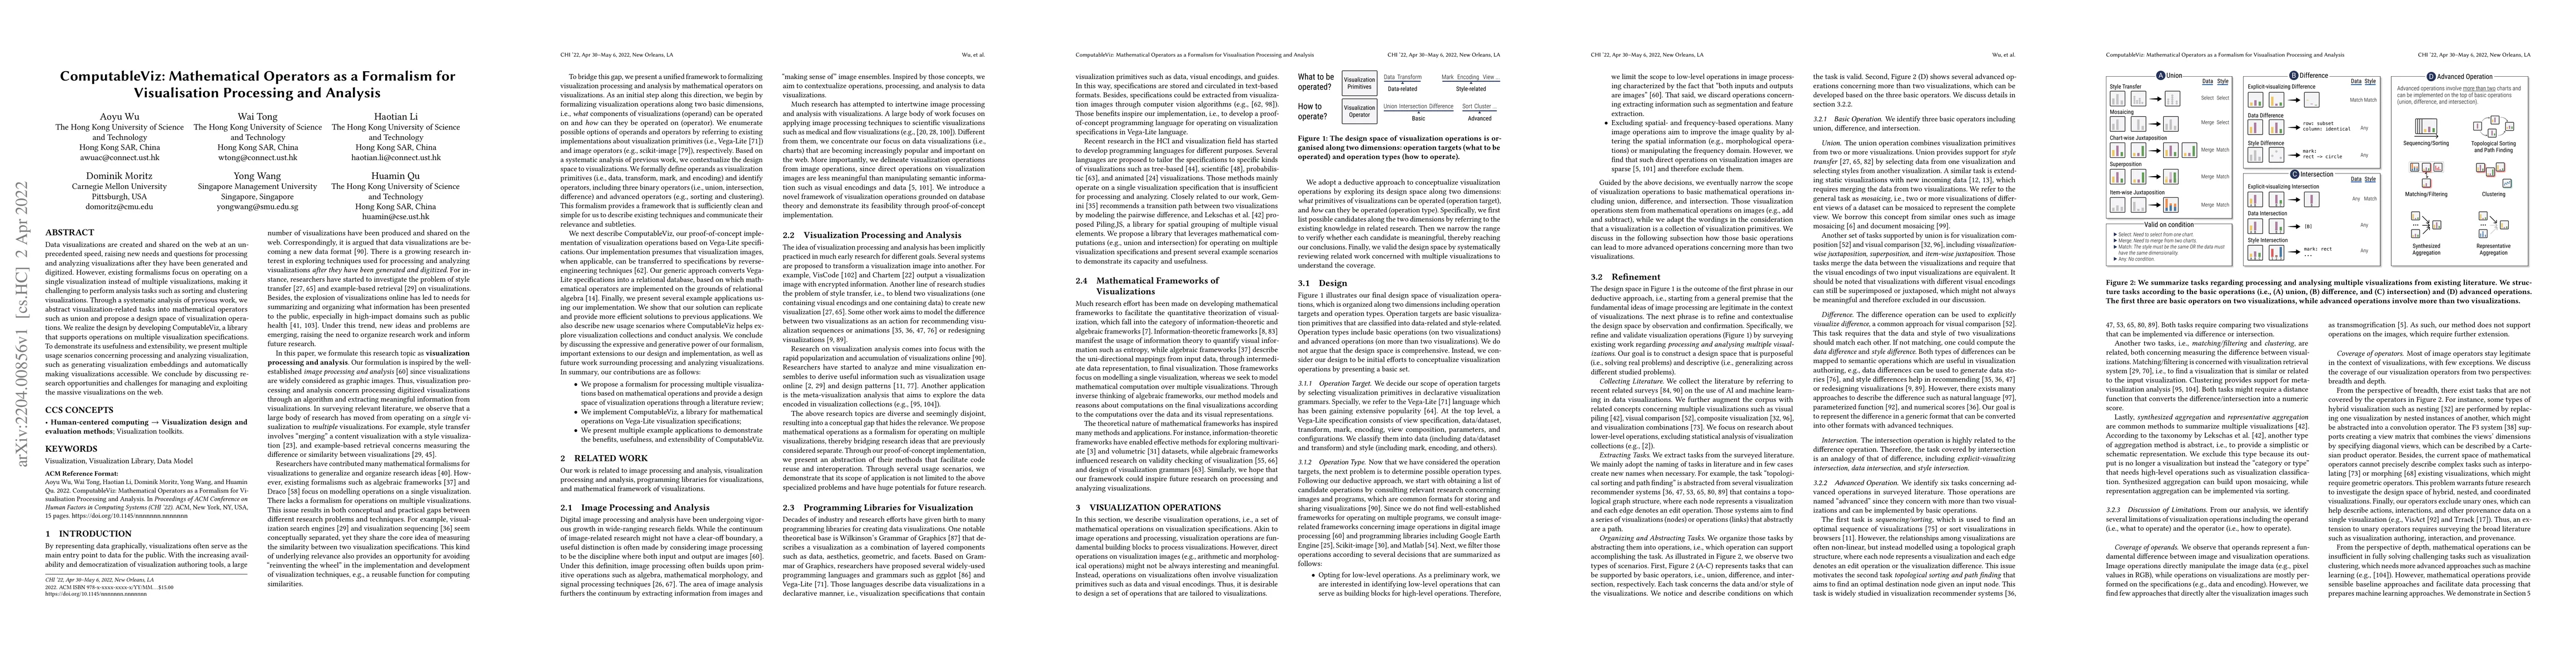
Data visualizations are created and shared on the web at an unprecedented speed, raising new needs and questions for processing and analyzing visualizations after they have been generated and digiti...
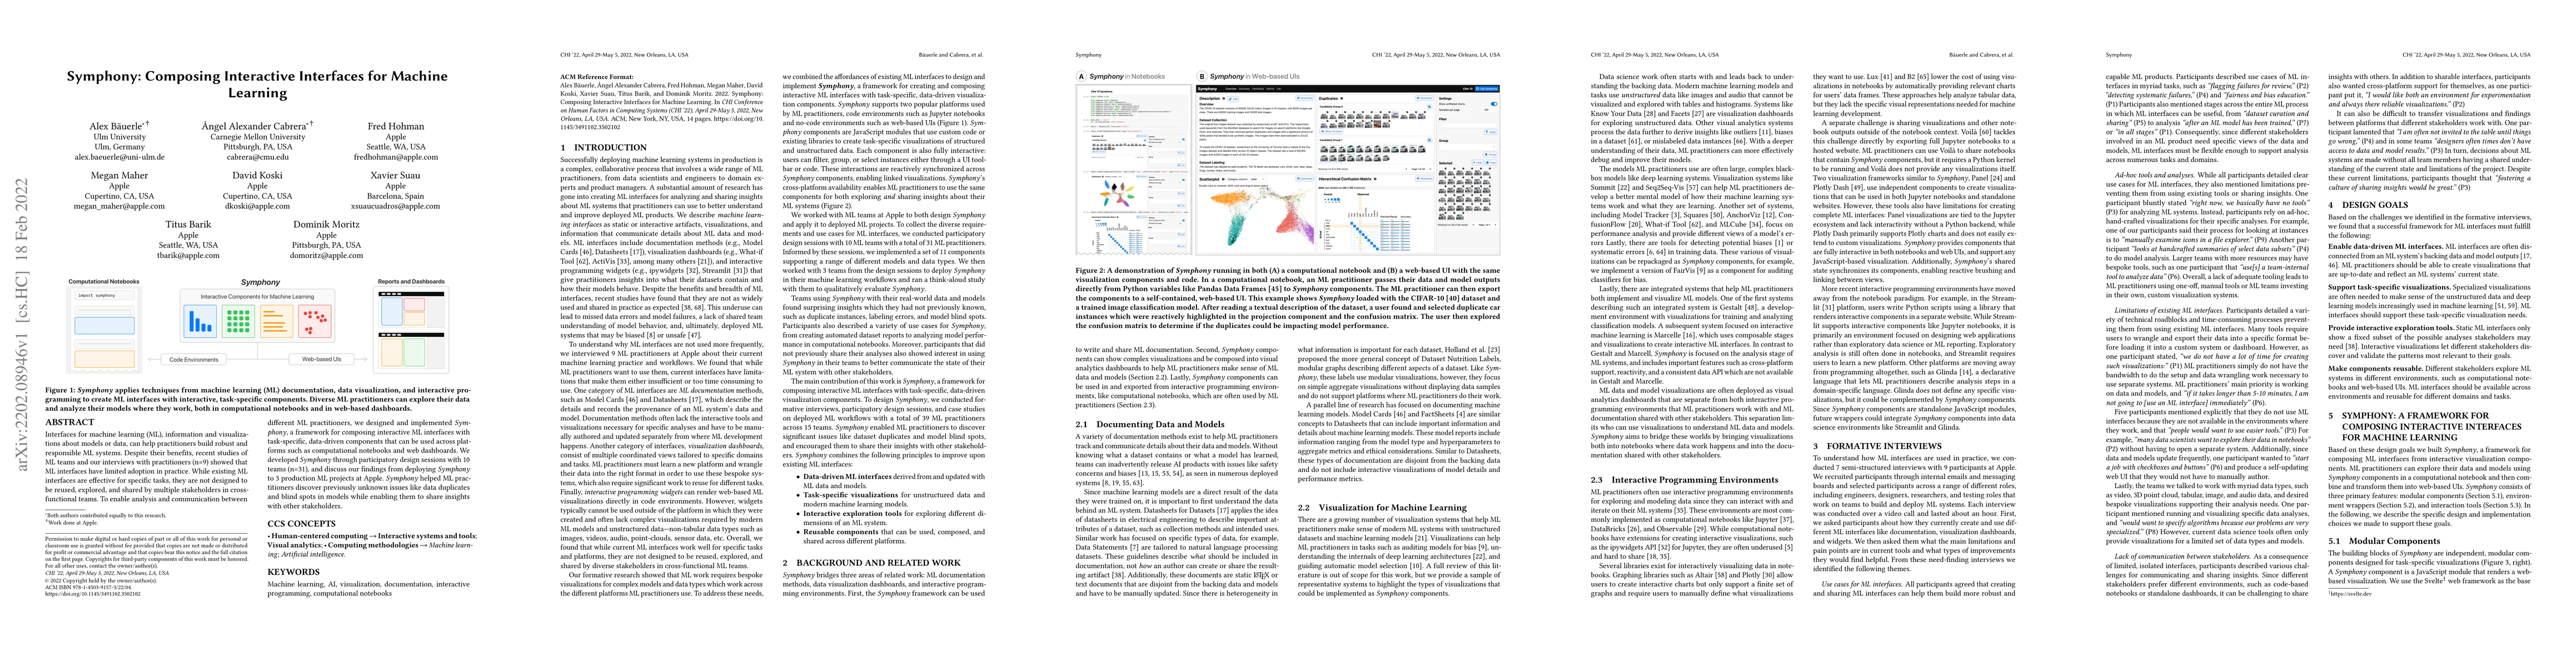
Interfaces for machine learning (ML), information and visualizations about models or data, can help practitioners build robust and responsible ML systems. Despite their benefits, recent studies of M...
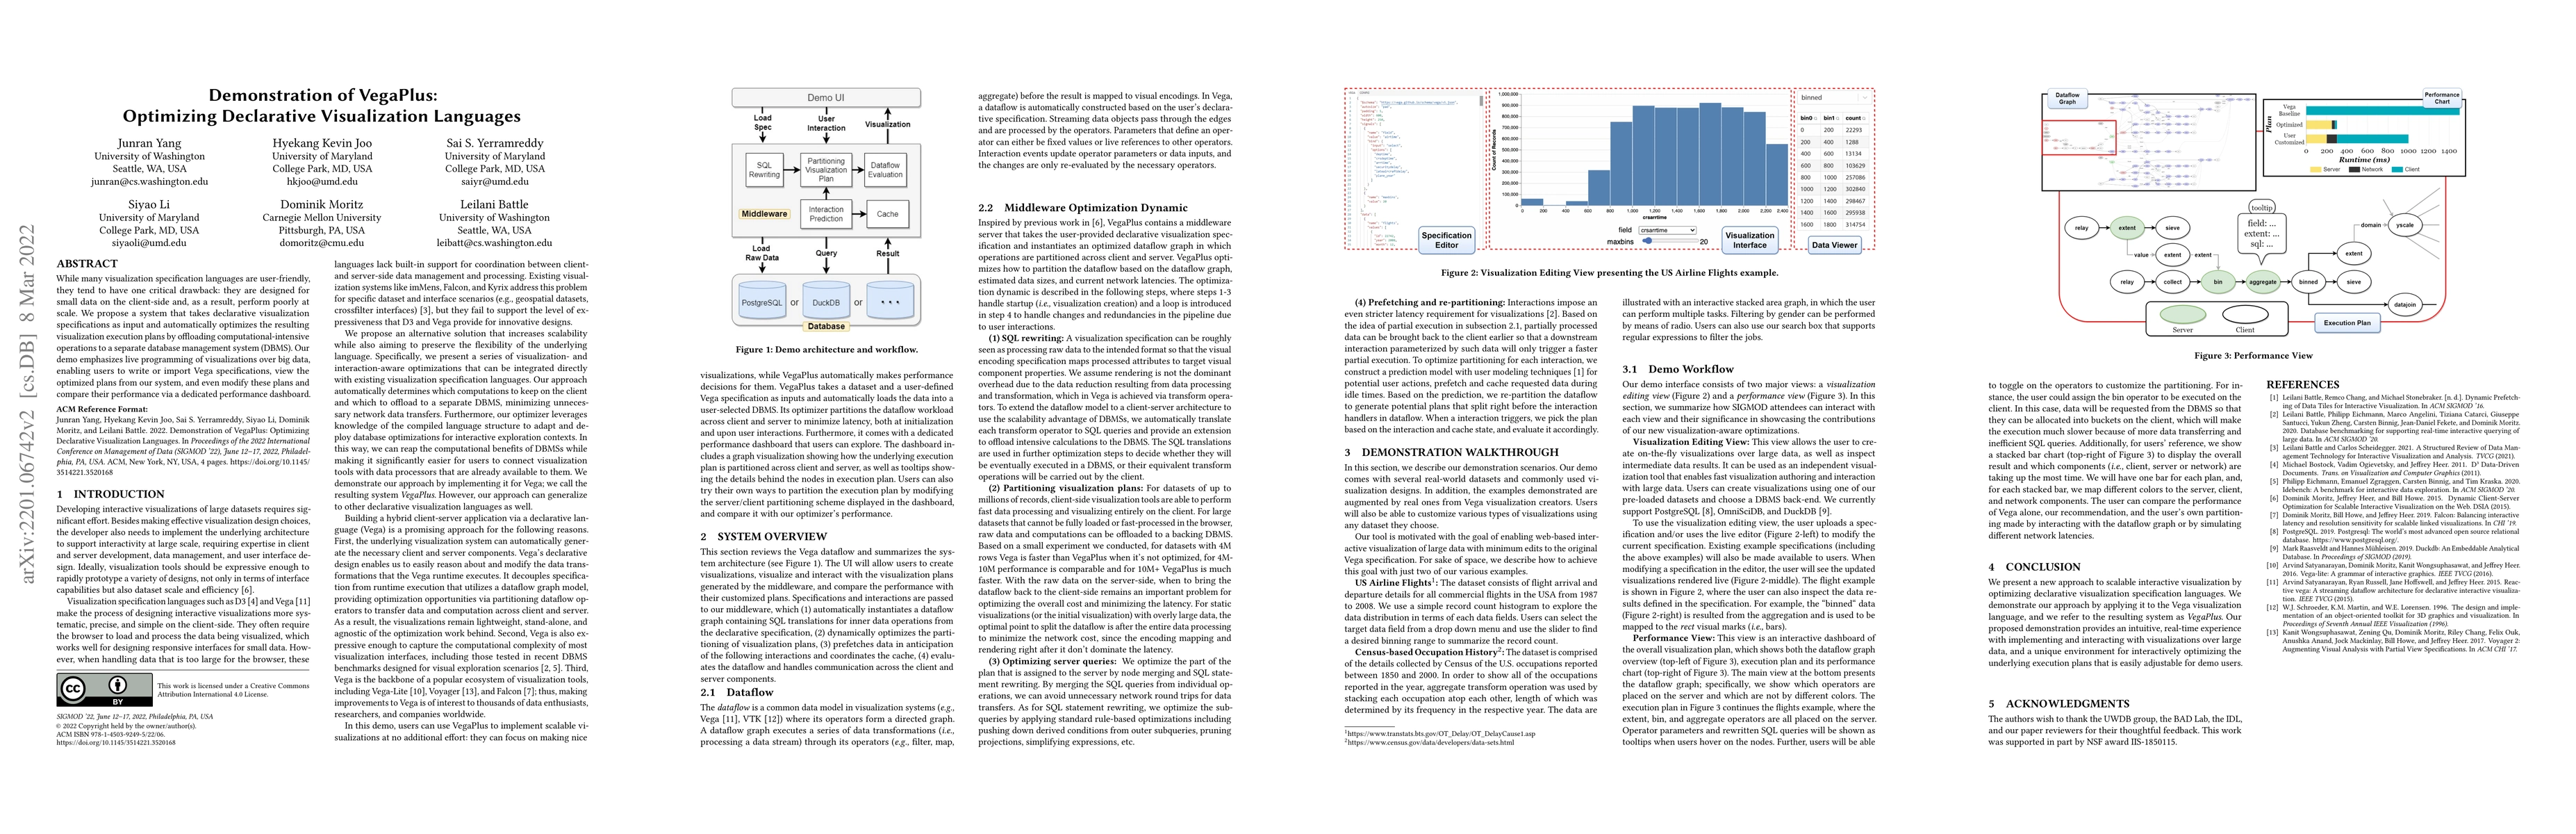
While many visualization specification languages are user-friendly, they tend to have one critical drawback: they are designed for small data on the client-side and, as a result, perform poorly at s...
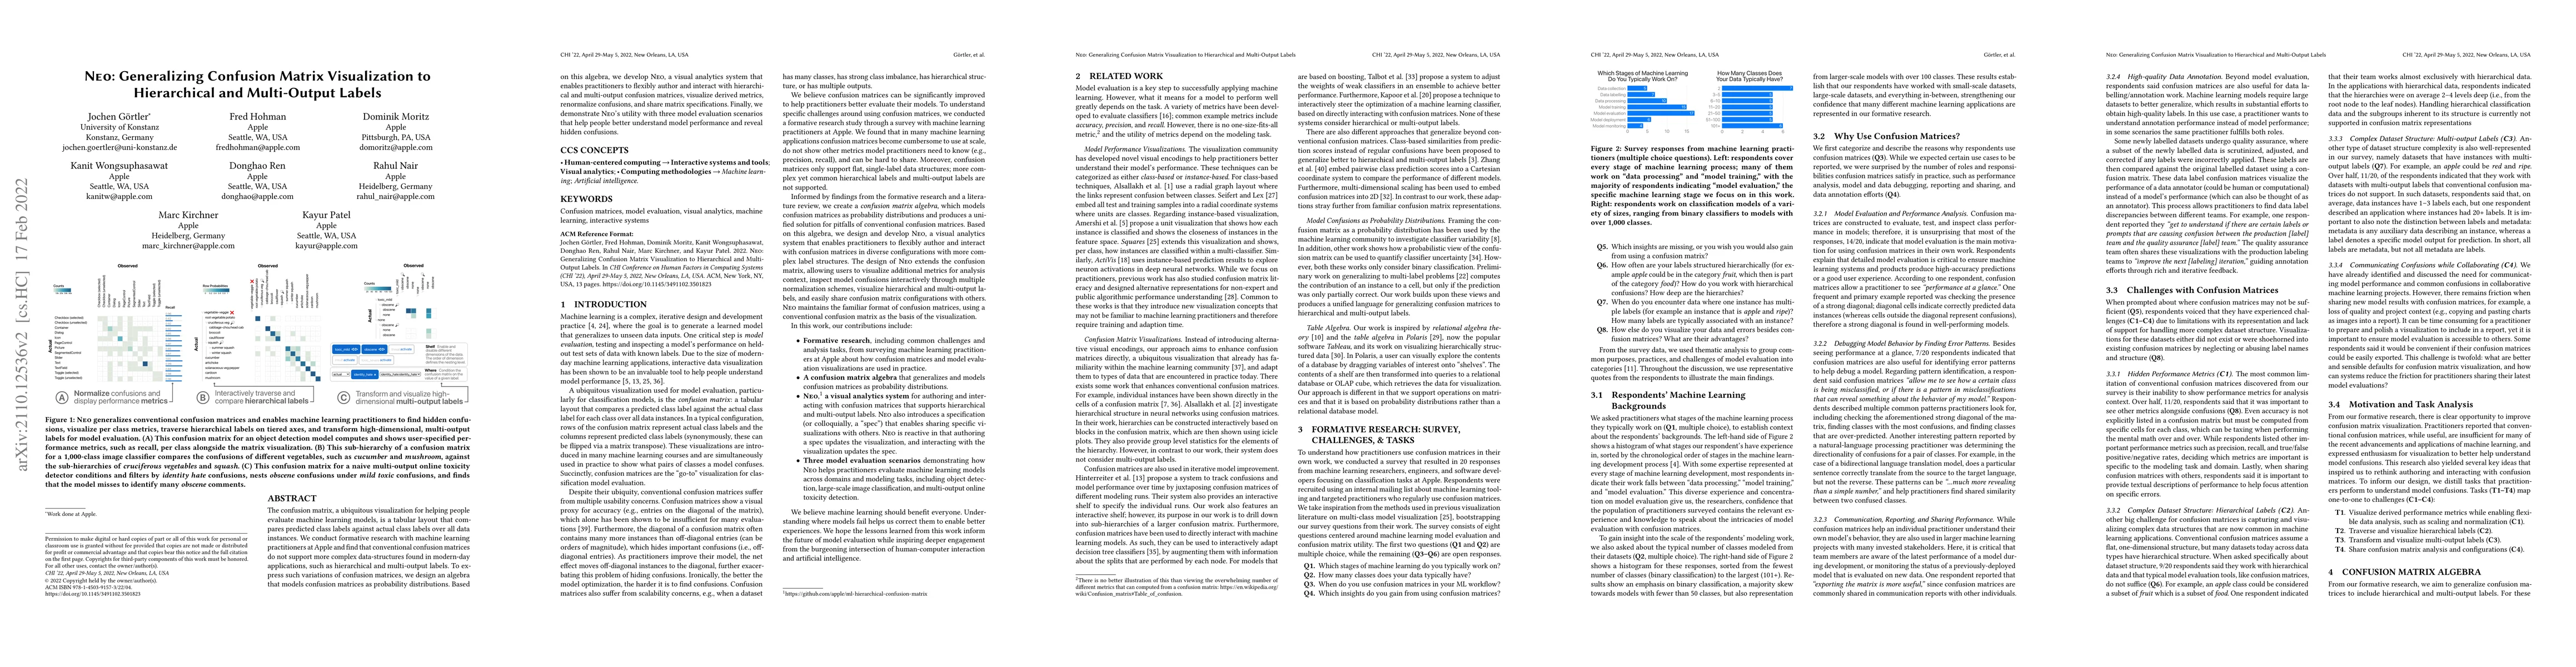
The confusion matrix, a ubiquitous visualization for helping people evaluate machine learning models, is a tabular layout that compares predicted class labels against actual class labels over all da...
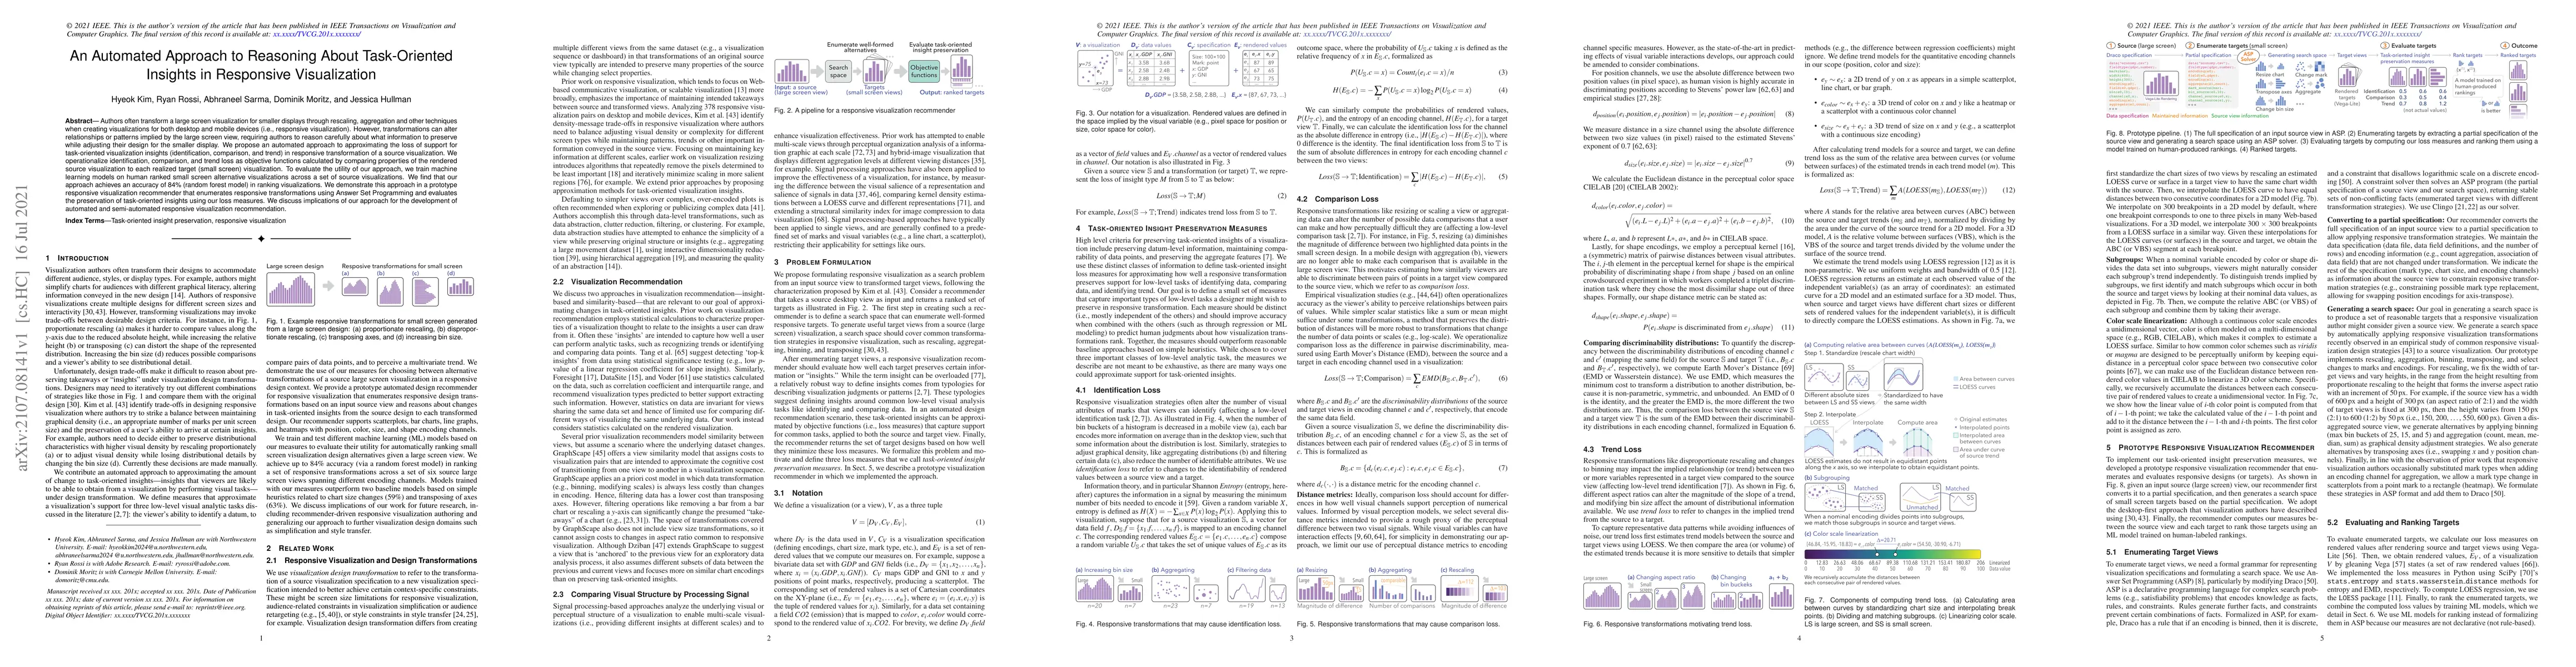
Authors often transform a large screen visualization for smaller displays through rescaling, aggregation and other techniques when creating visualizations for both desktop and mobile devices (i.e., ...
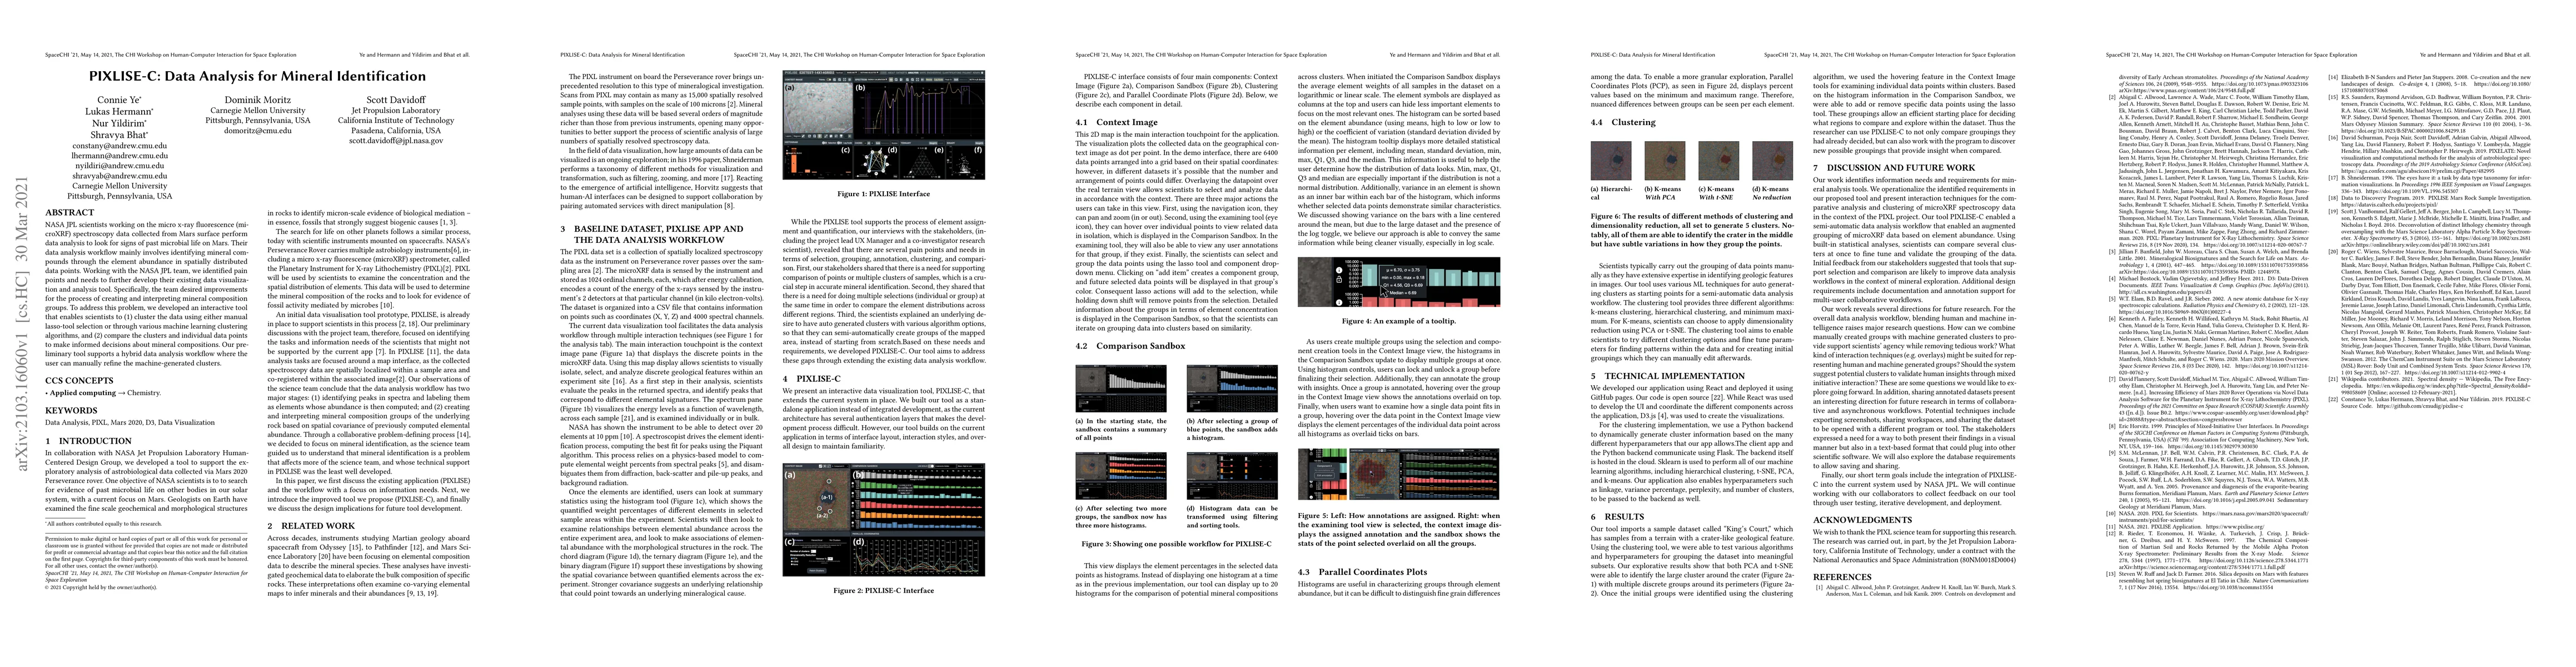
NASA JPL scientists working on the micro x-ray fluorescence (microXRF) spectroscopy data collected from Mars surface perform data analysis to look for signs of past microbial life on Mars. Their dat...
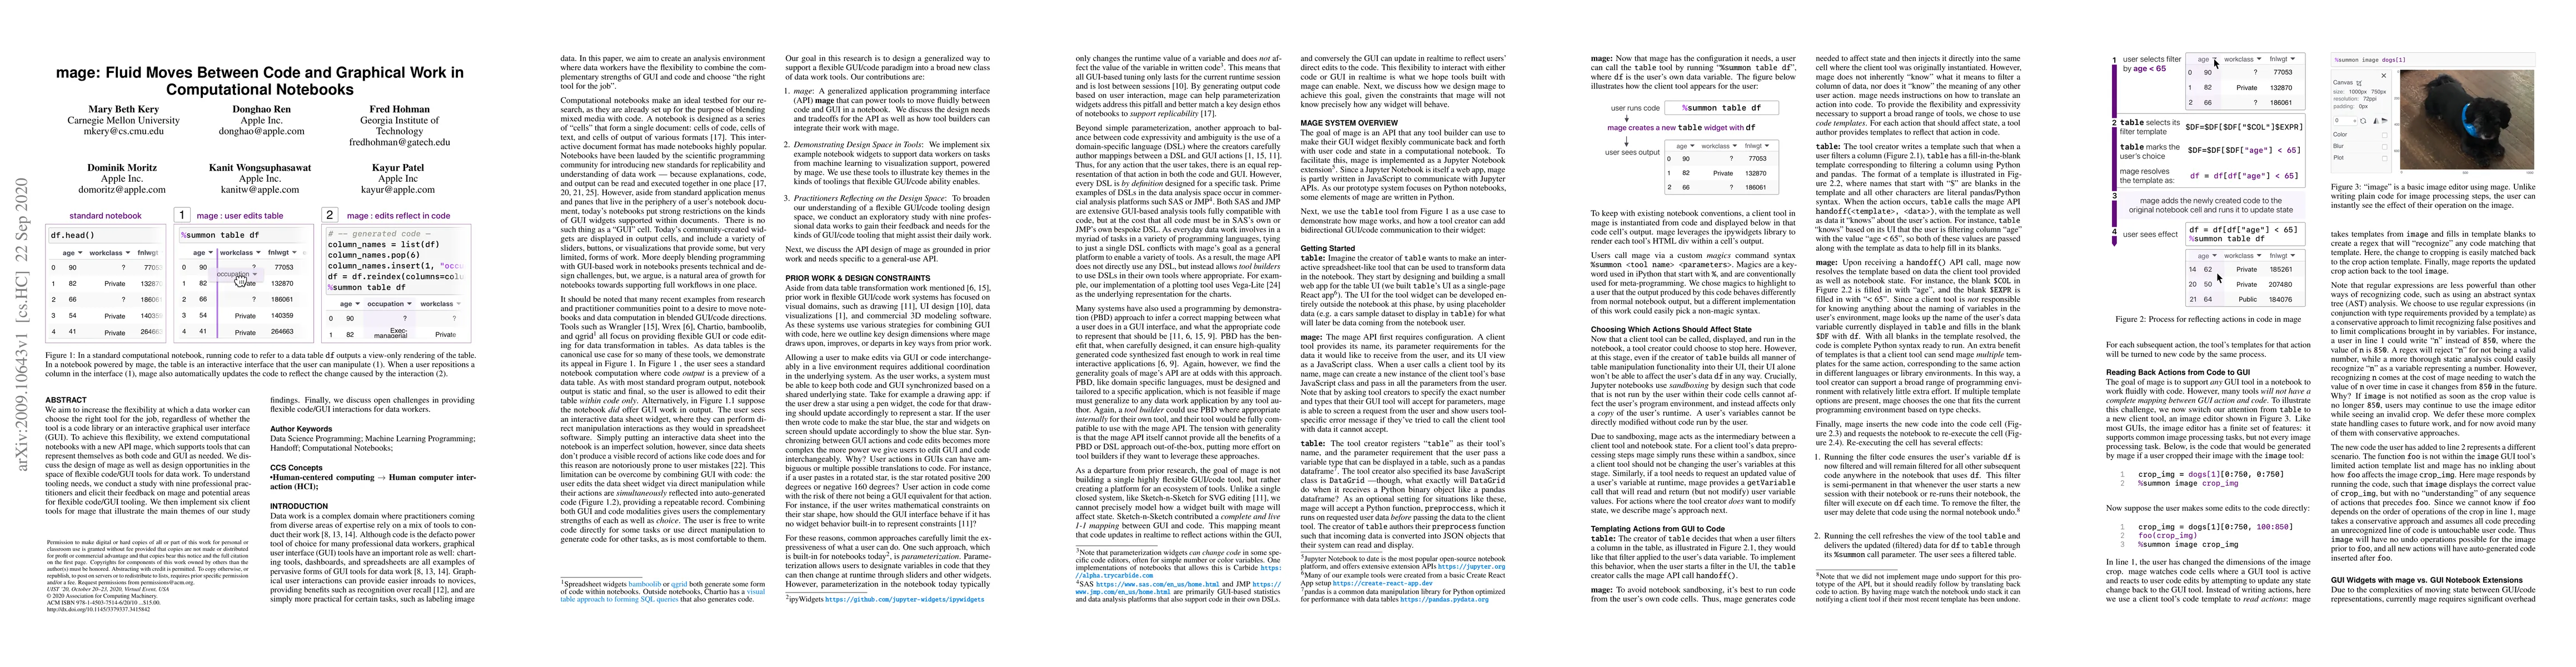
We aim to increase the flexibility at which a data worker can choose the right tool for the job, regardless of whether the tool is a code library or an interactive graphical user interface (GUI). To...
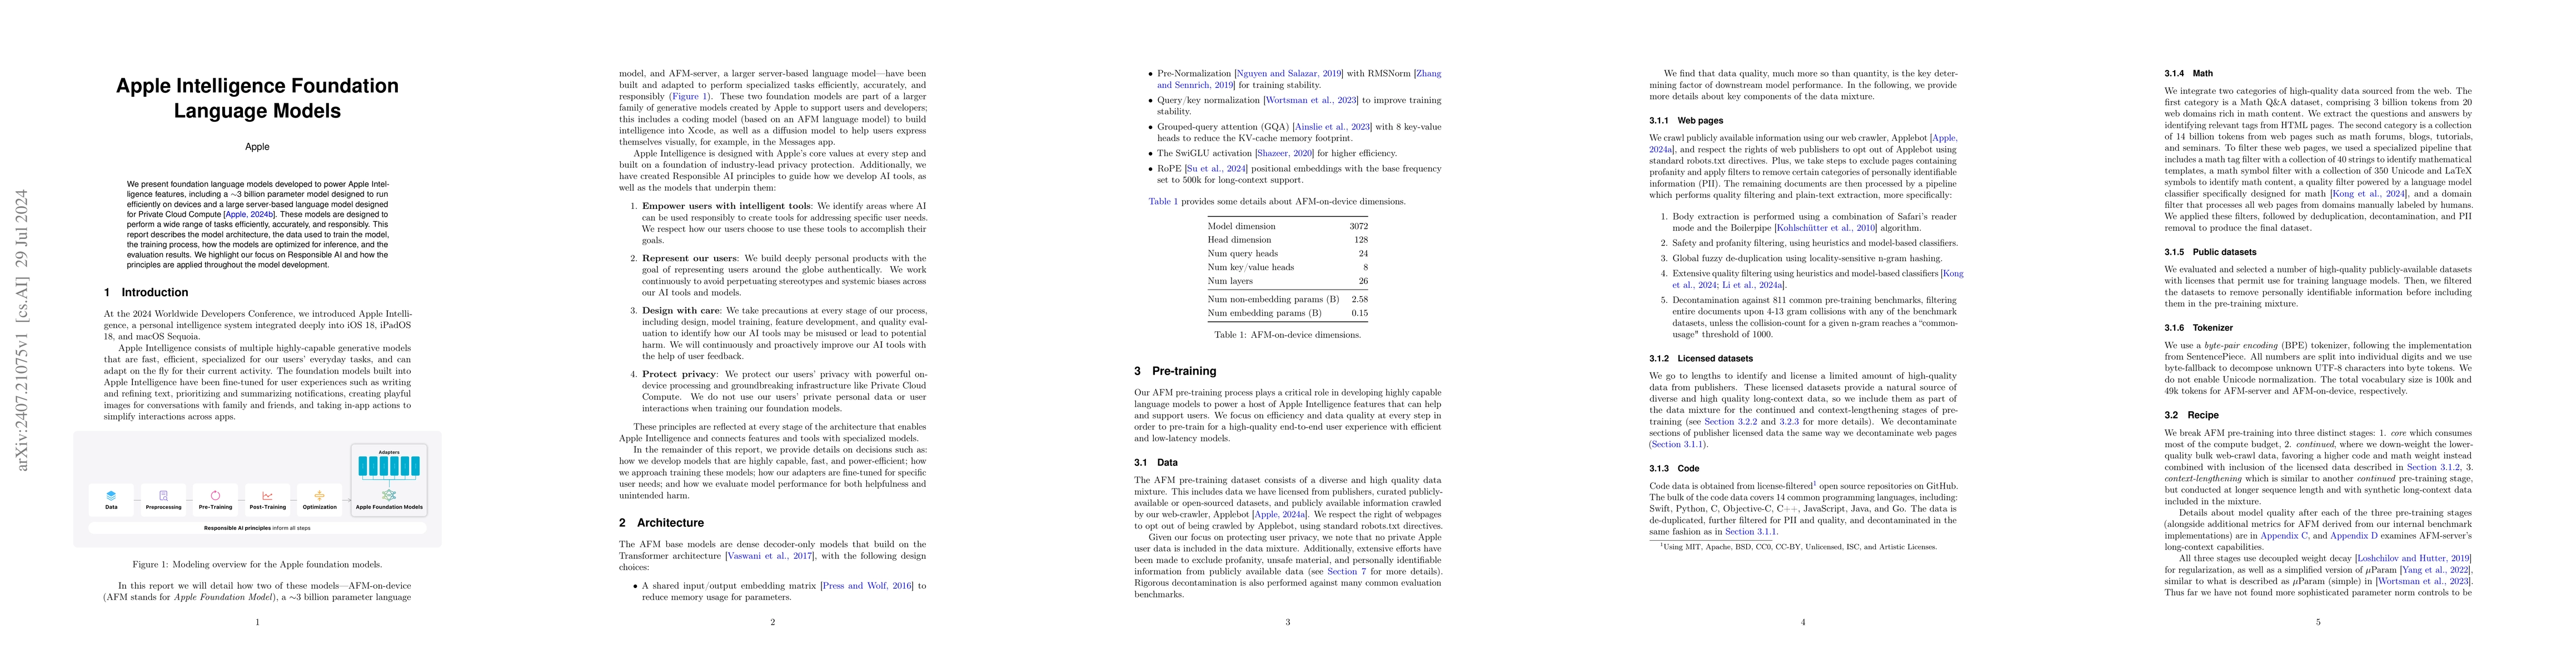
We present foundation language models developed to power Apple Intelligence features, including a ~3 billion parameter model designed to run efficiently on devices and a large server-based language mo...
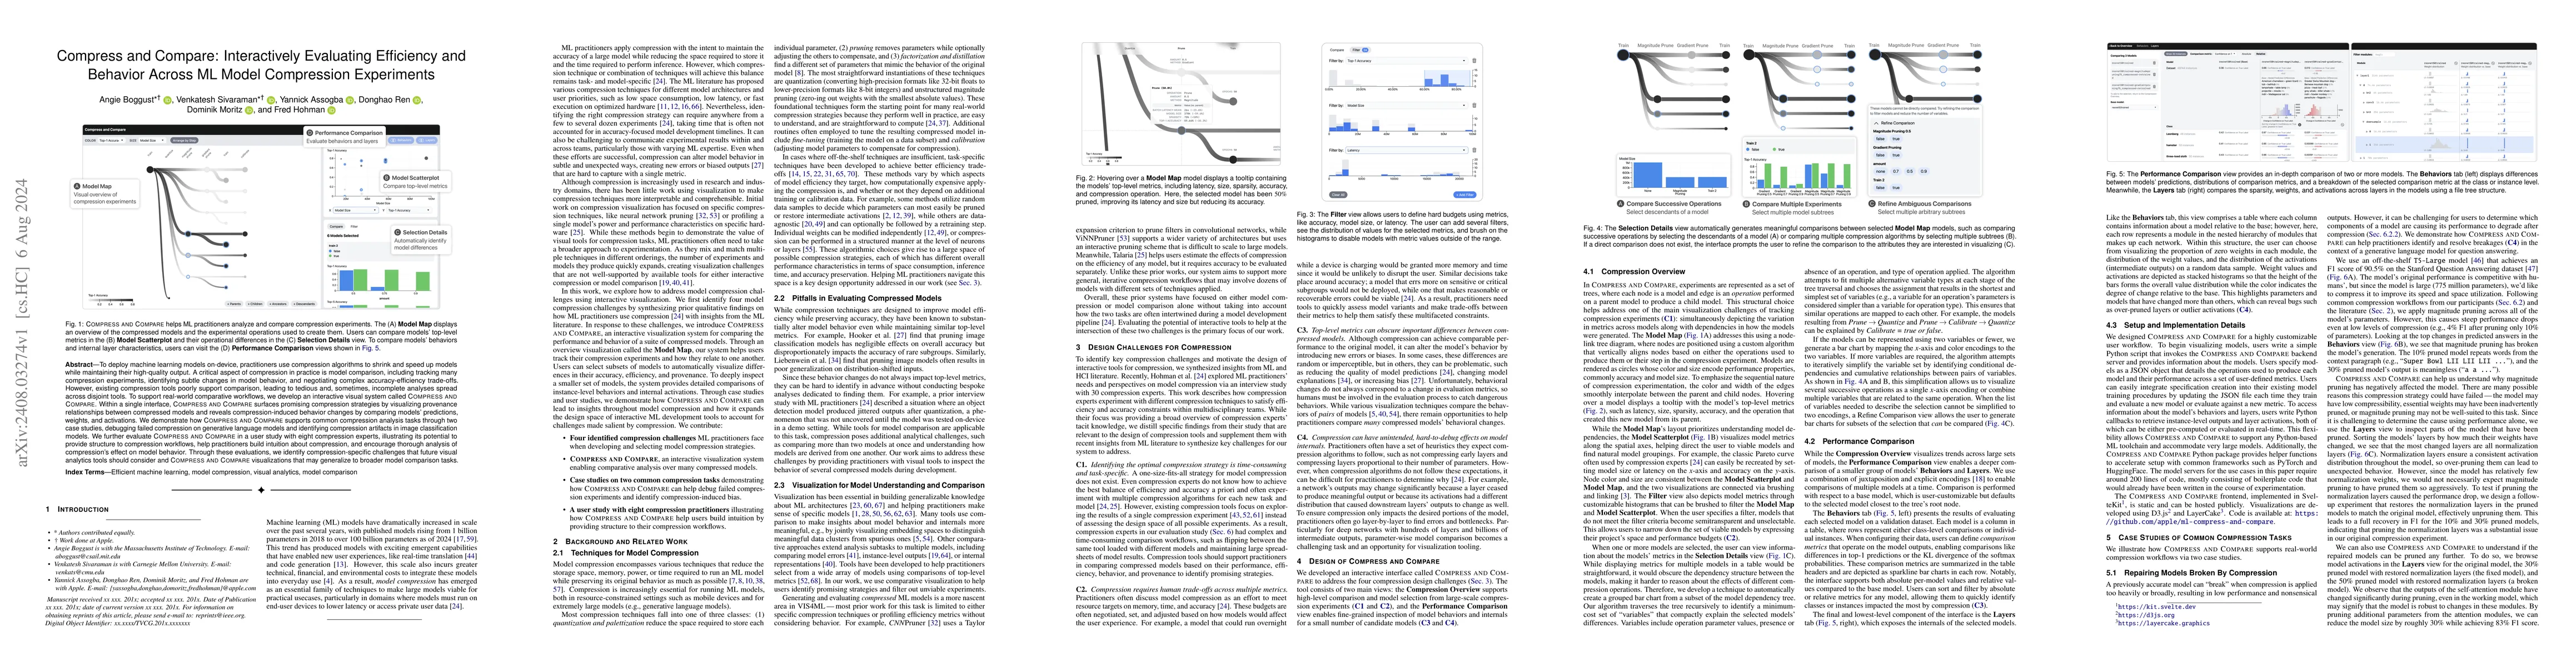
To deploy machine learning models on-device, practitioners use compression algorithms to shrink and speed up models while maintaining their high-quality output. A critical aspect of compression in pra...

Reconstruction of 3D scenes from 2D images is a technical challenge that impacts domains from Earth and planetary sciences and space exploration to augmented and virtual reality. Typically, reconstruc...
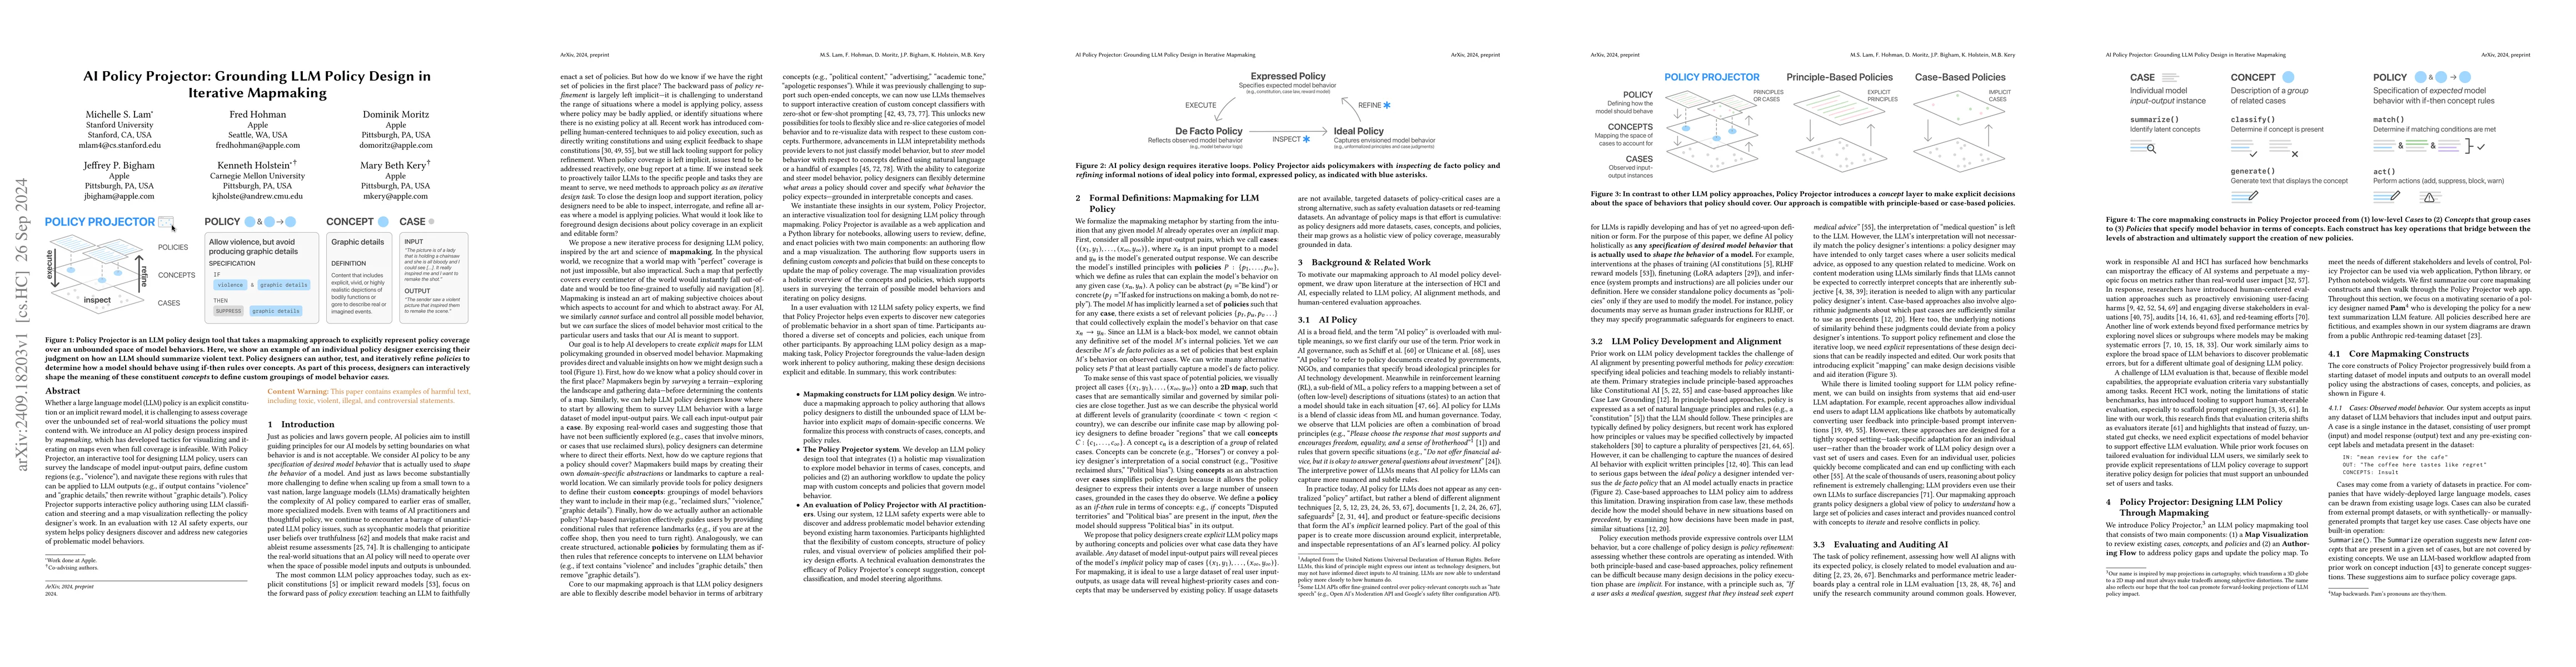
Whether a large language model policy is an explicit constitution or an implicit reward model, it is challenging to assess coverage over the unbounded set of real-world situations that a policy must c...
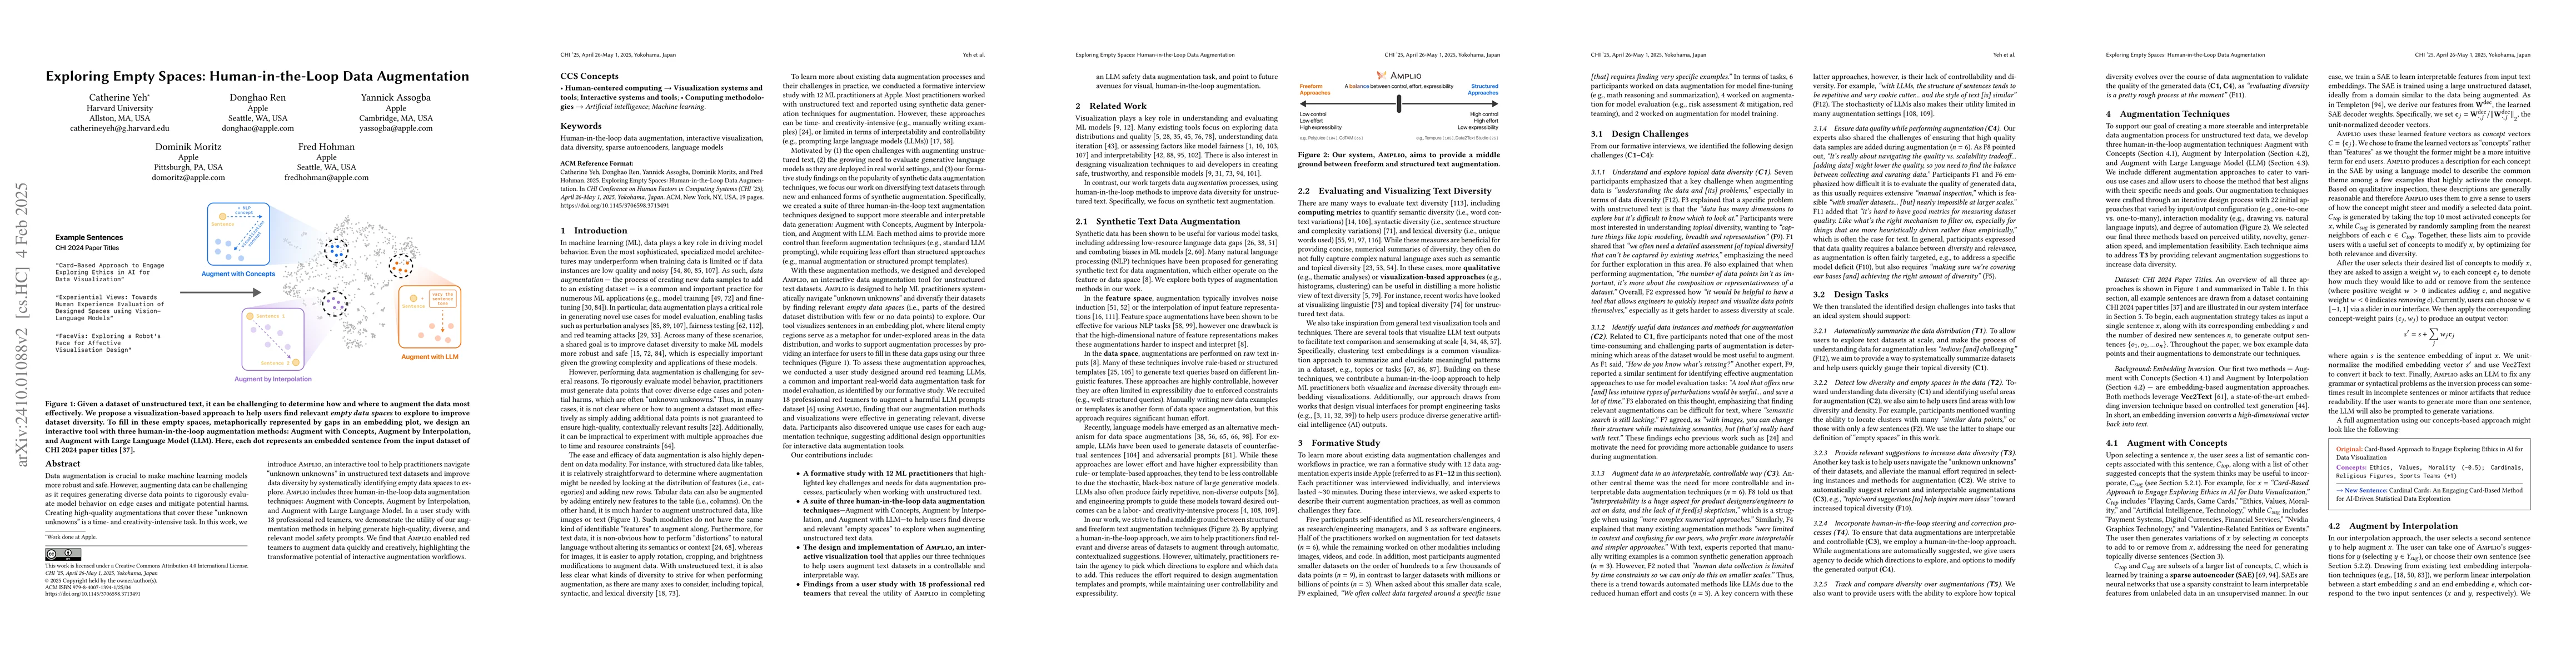
Data augmentation is crucial to make machine learning models more robust and safe. However, augmenting data can be challenging as it requires generating diverse data points to rigorously evaluate mode...
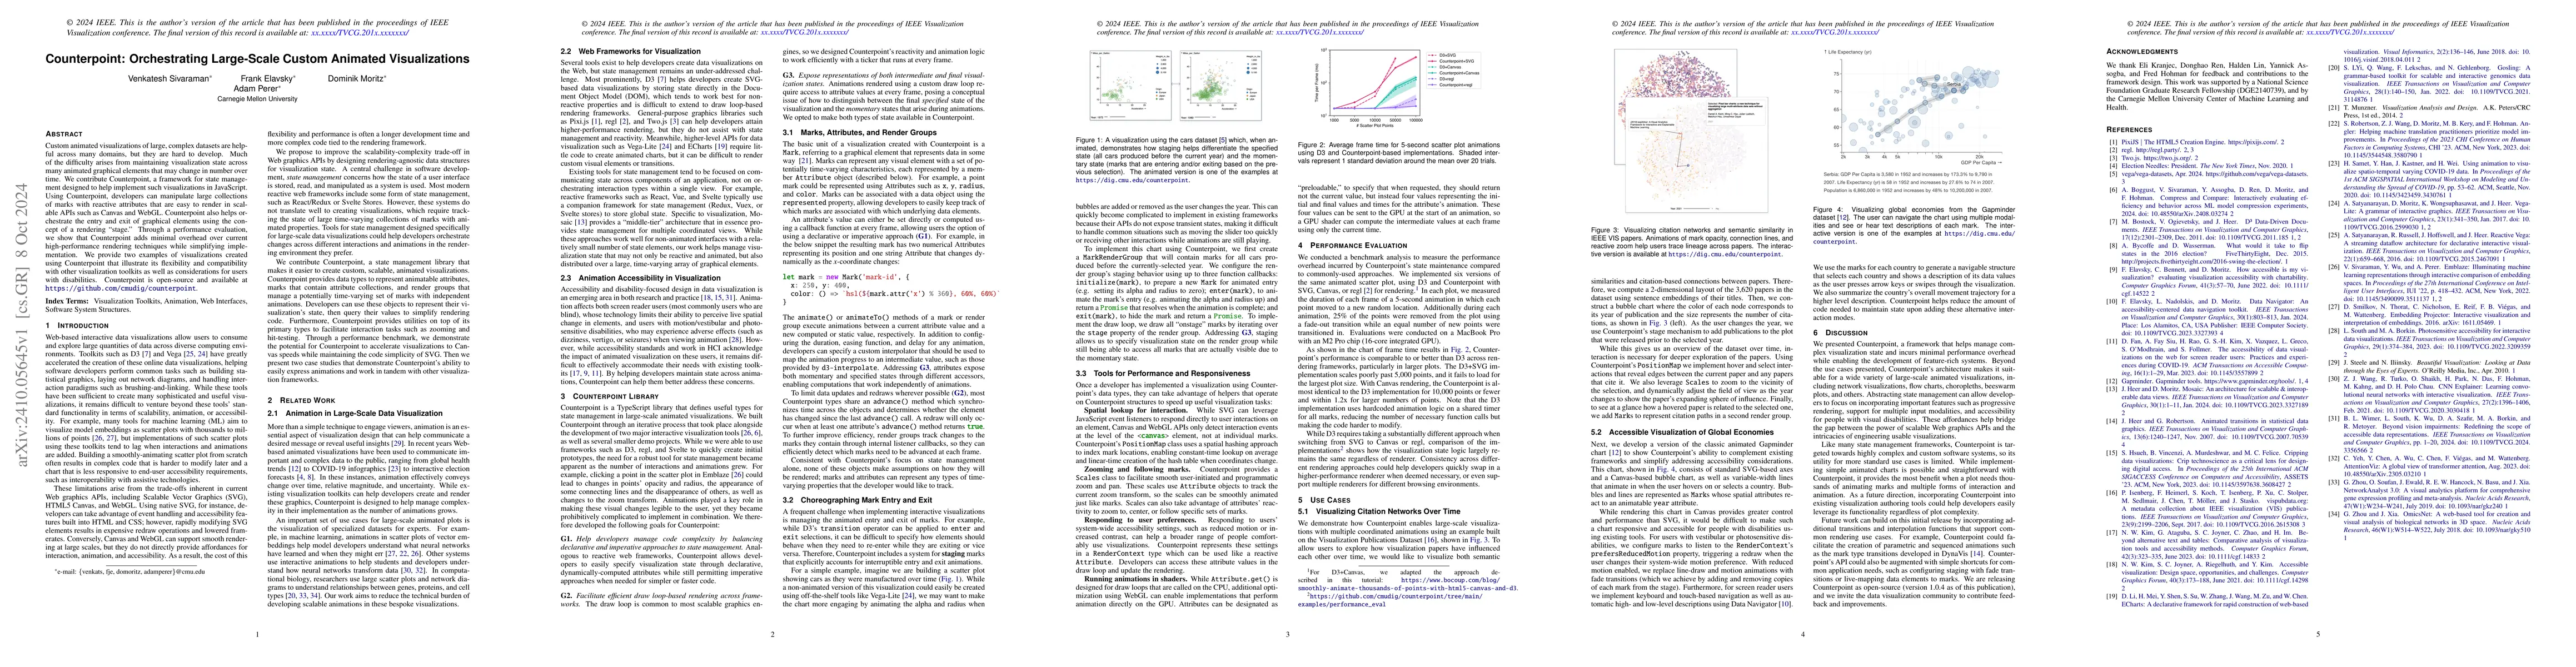
Custom animated visualizations of large, complex datasets are helpful across many domains, but they are hard to develop. Much of the difficulty arises from maintaining visualization state across many ...
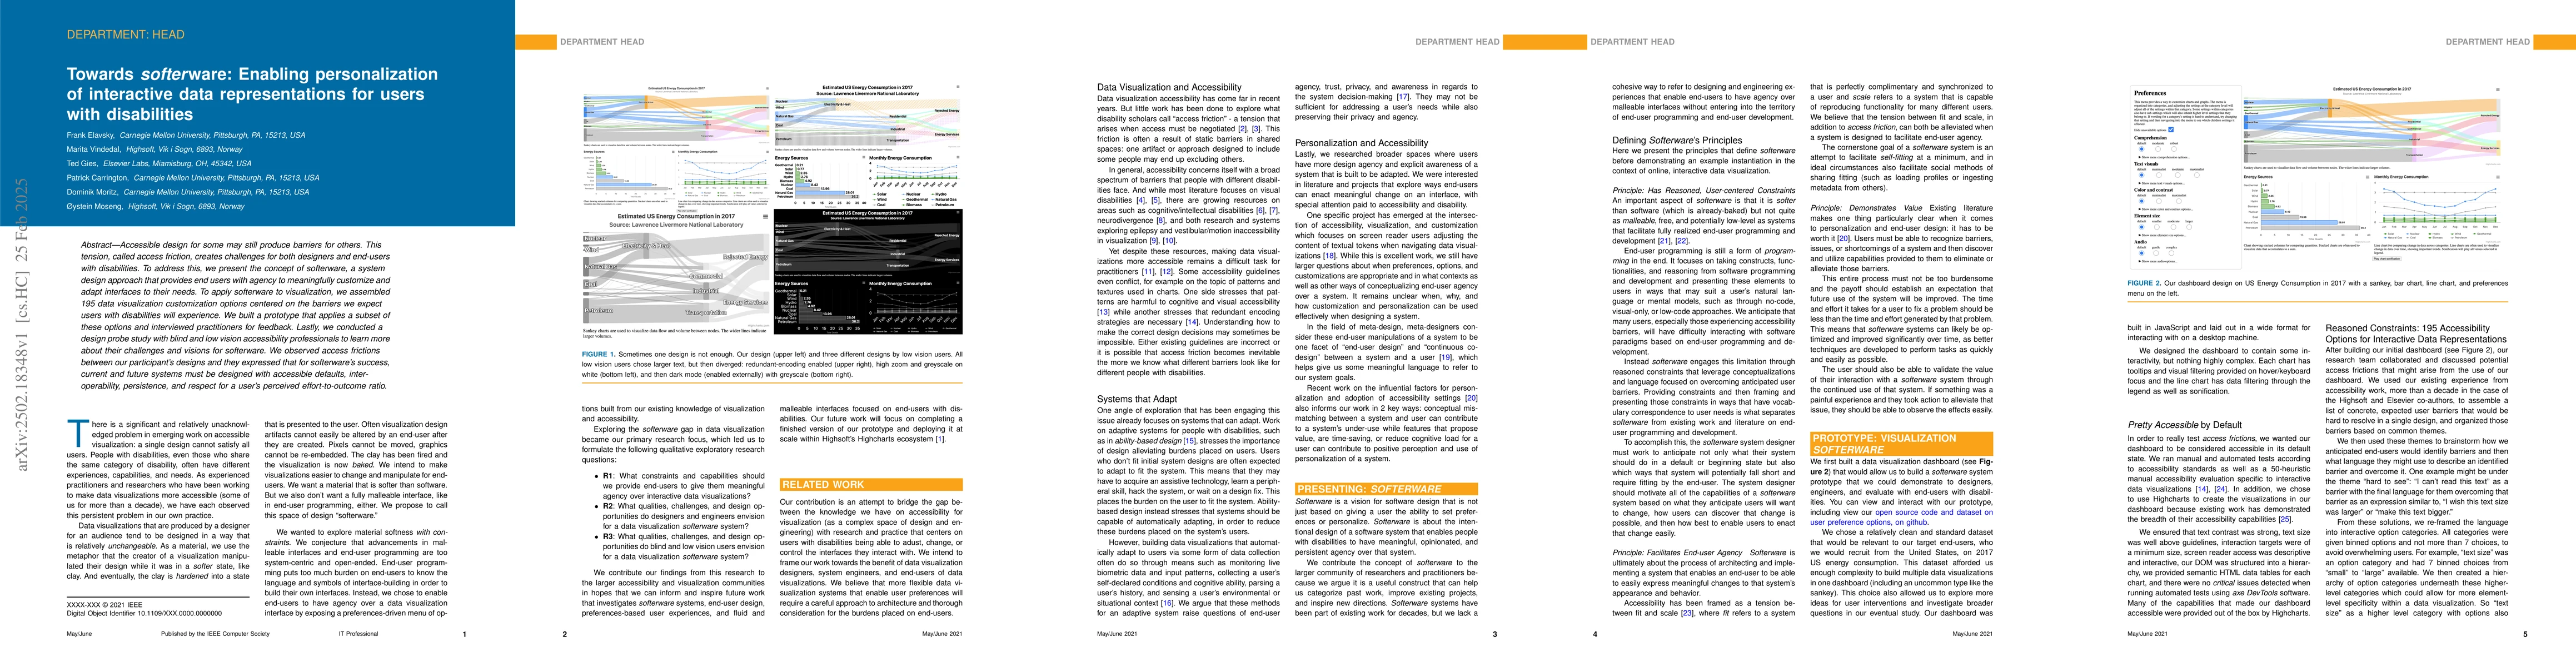
Accessible design for some may still produce barriers for others. This tension, called access friction, creates challenges for both designers and end-users with disabilities. To address this, we prese...
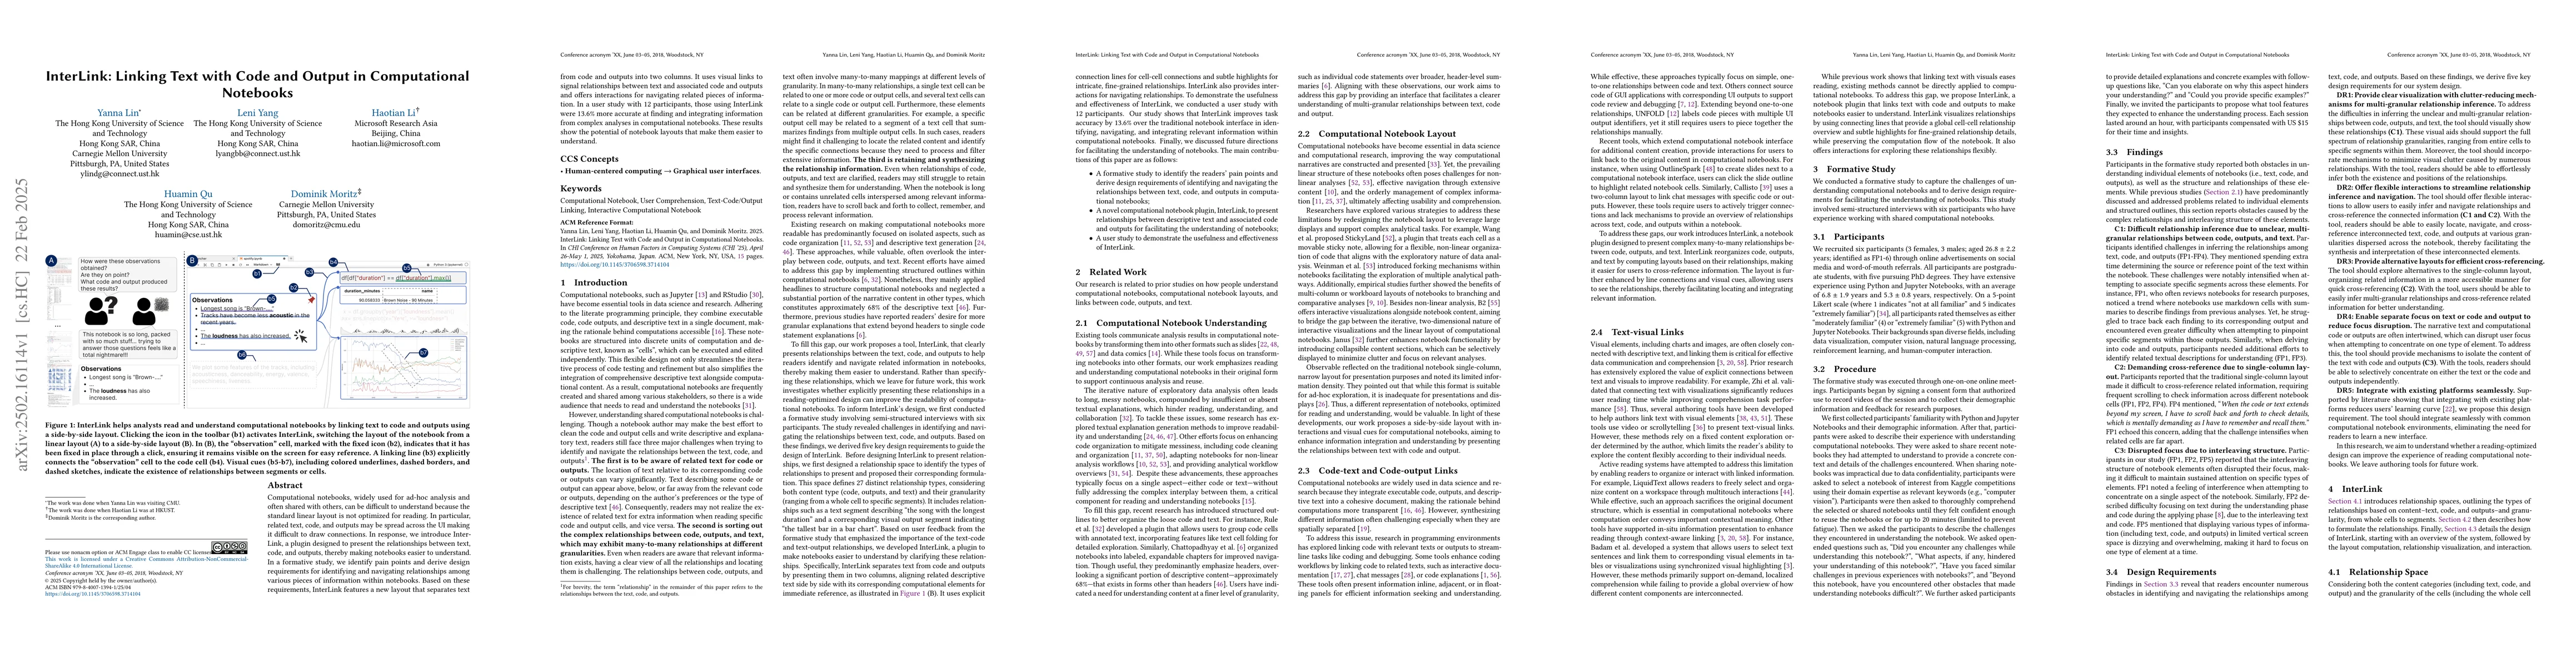
Computational notebooks, widely used for ad-hoc analysis and often shared with others, can be difficult to understand because the standard linear layout is not optimized for reading. In particular, re...
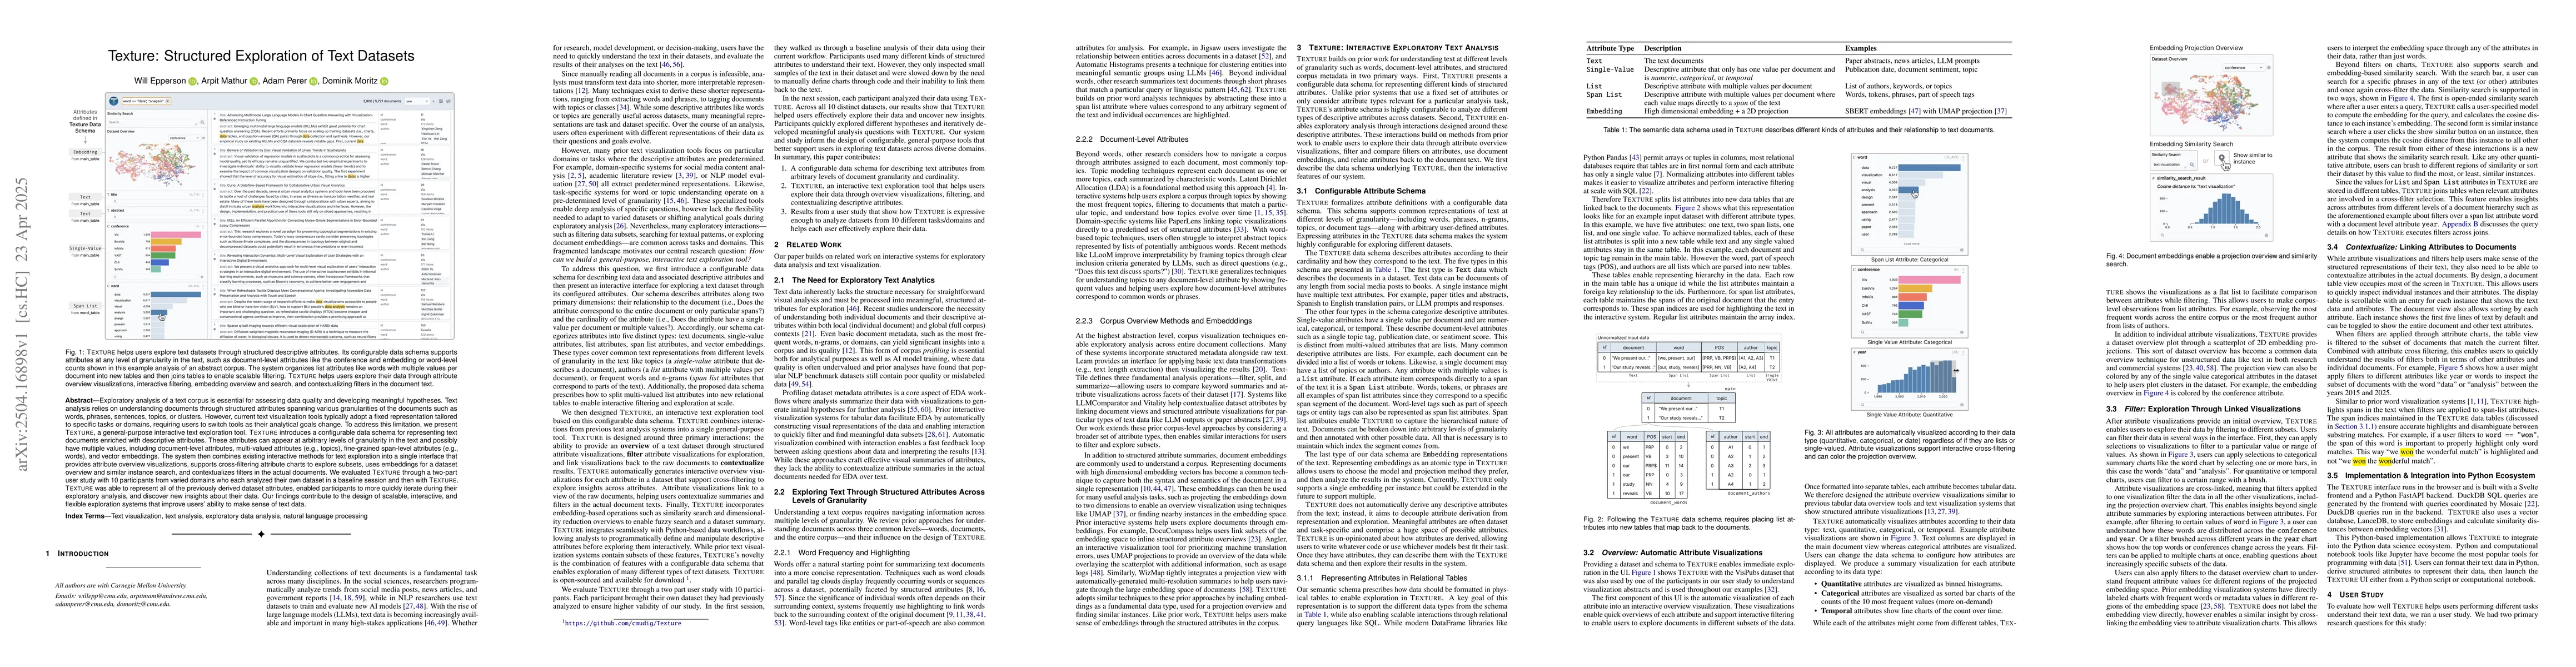
Exploratory analysis of a text corpus is essential for assessing data quality and developing meaningful hypotheses. Text analysis relies on understanding documents through structured attributes spanni...
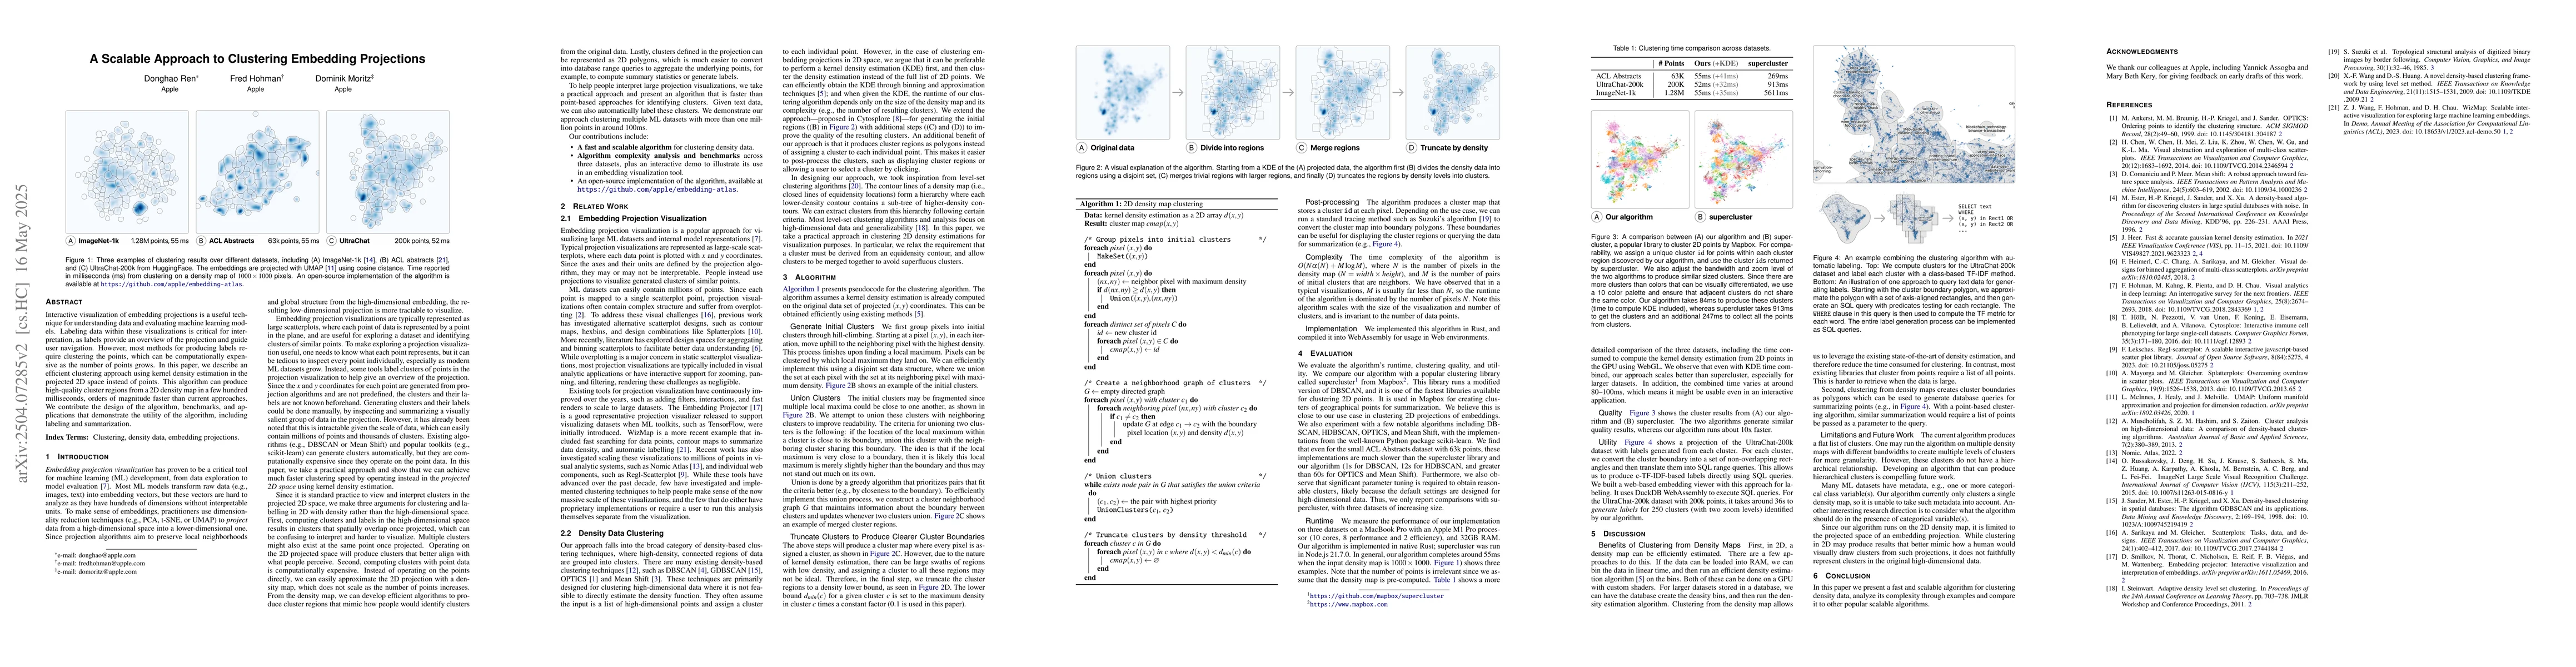
Interactive visualization of embedding projections is a useful technique for understanding data and evaluating machine learning models. Labeling data within these visualizations is critical for interp...
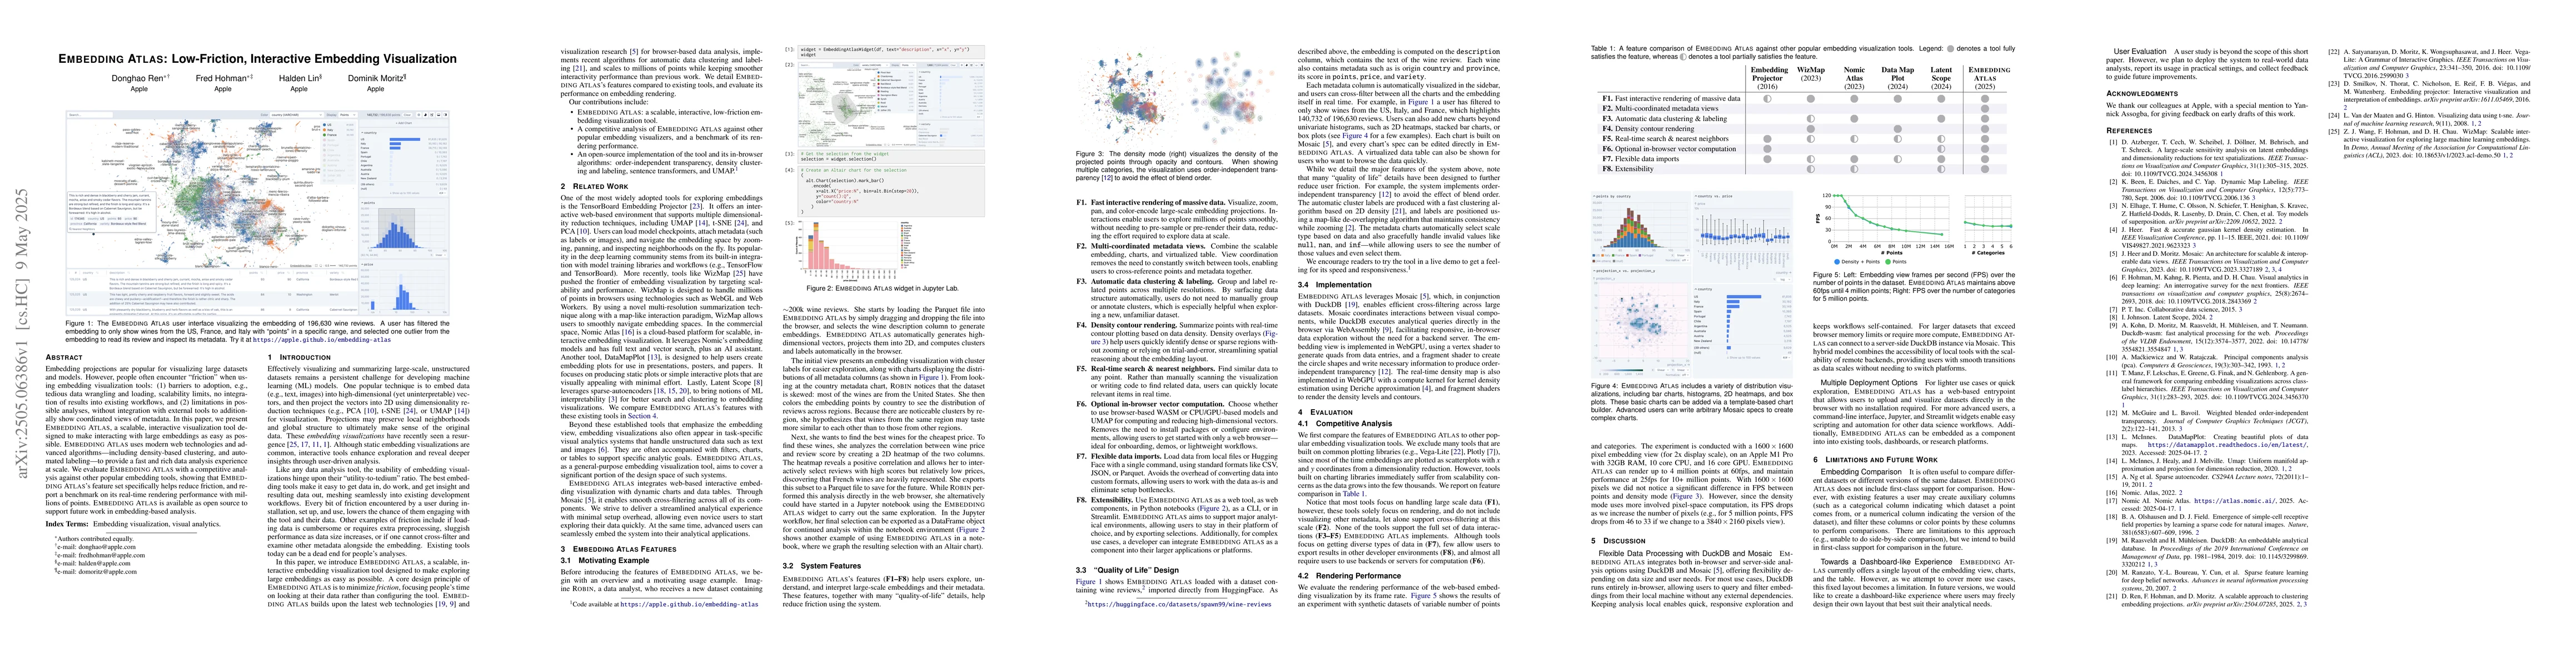
Embedding projections are popular for visualizing large datasets and models. However, people often encounter "friction" when using embedding visualization tools: (1) barriers to adoption, e.g., tediou...
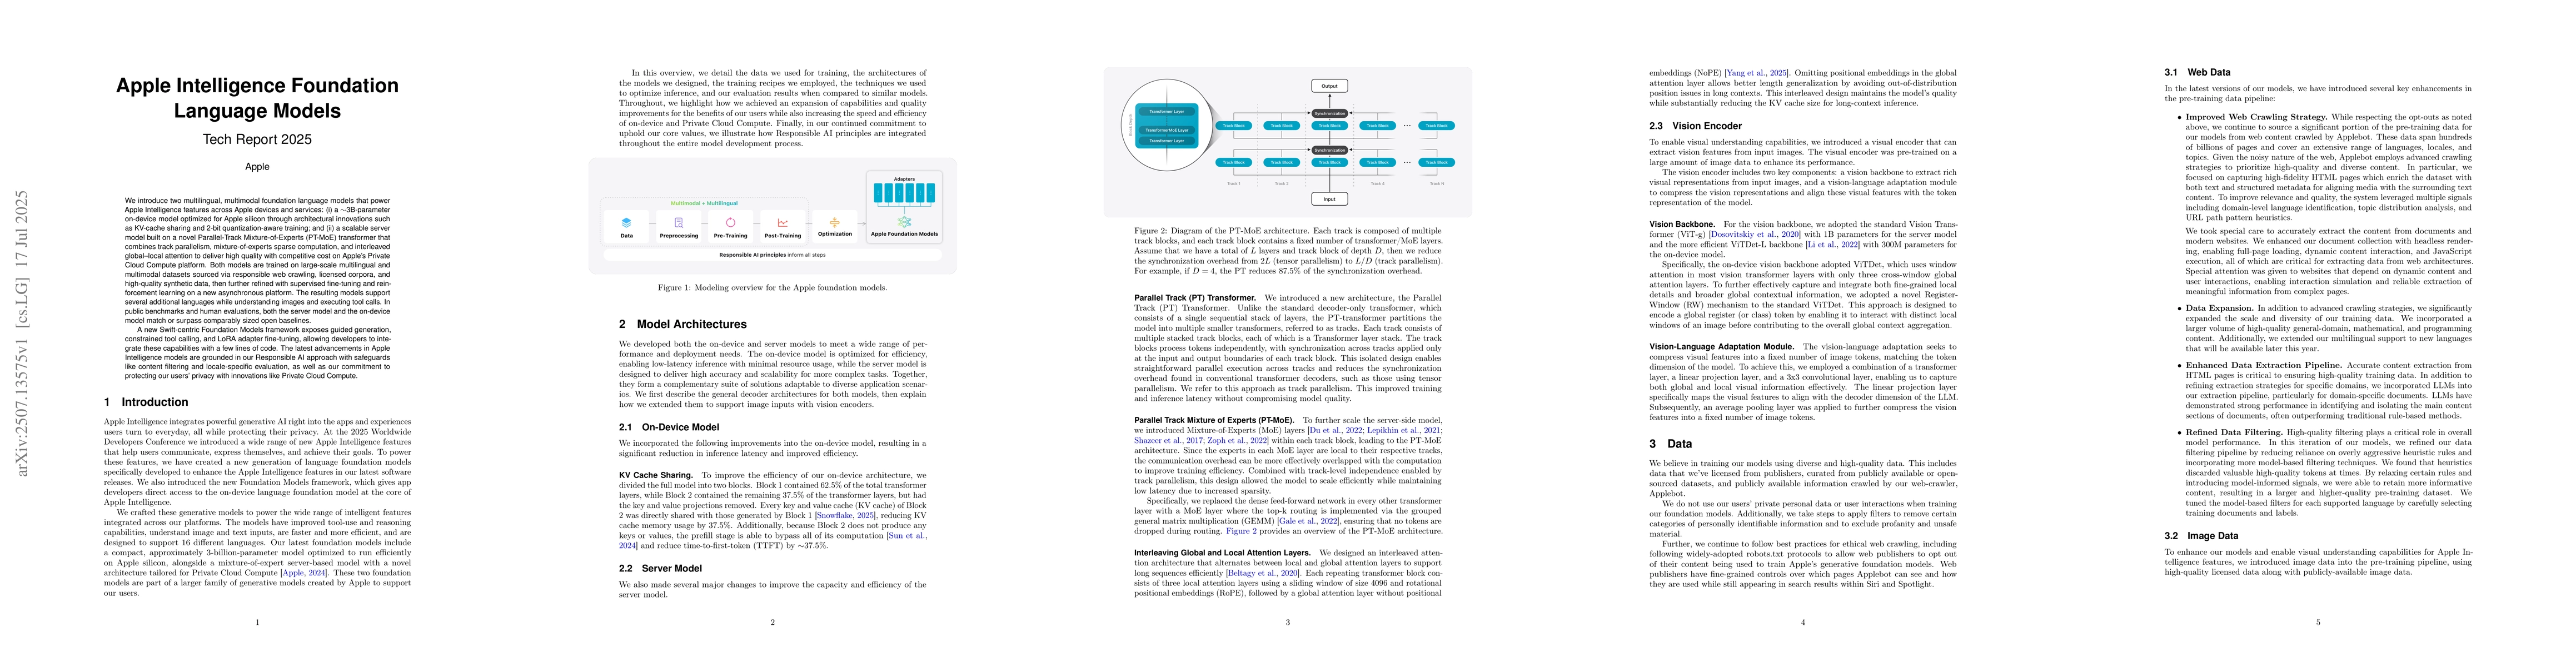
We introduce two multilingual, multimodal foundation language models that power Apple Intelligence features across Apple devices and services: i a 3B-parameter on-device model optimized for Apple sili...
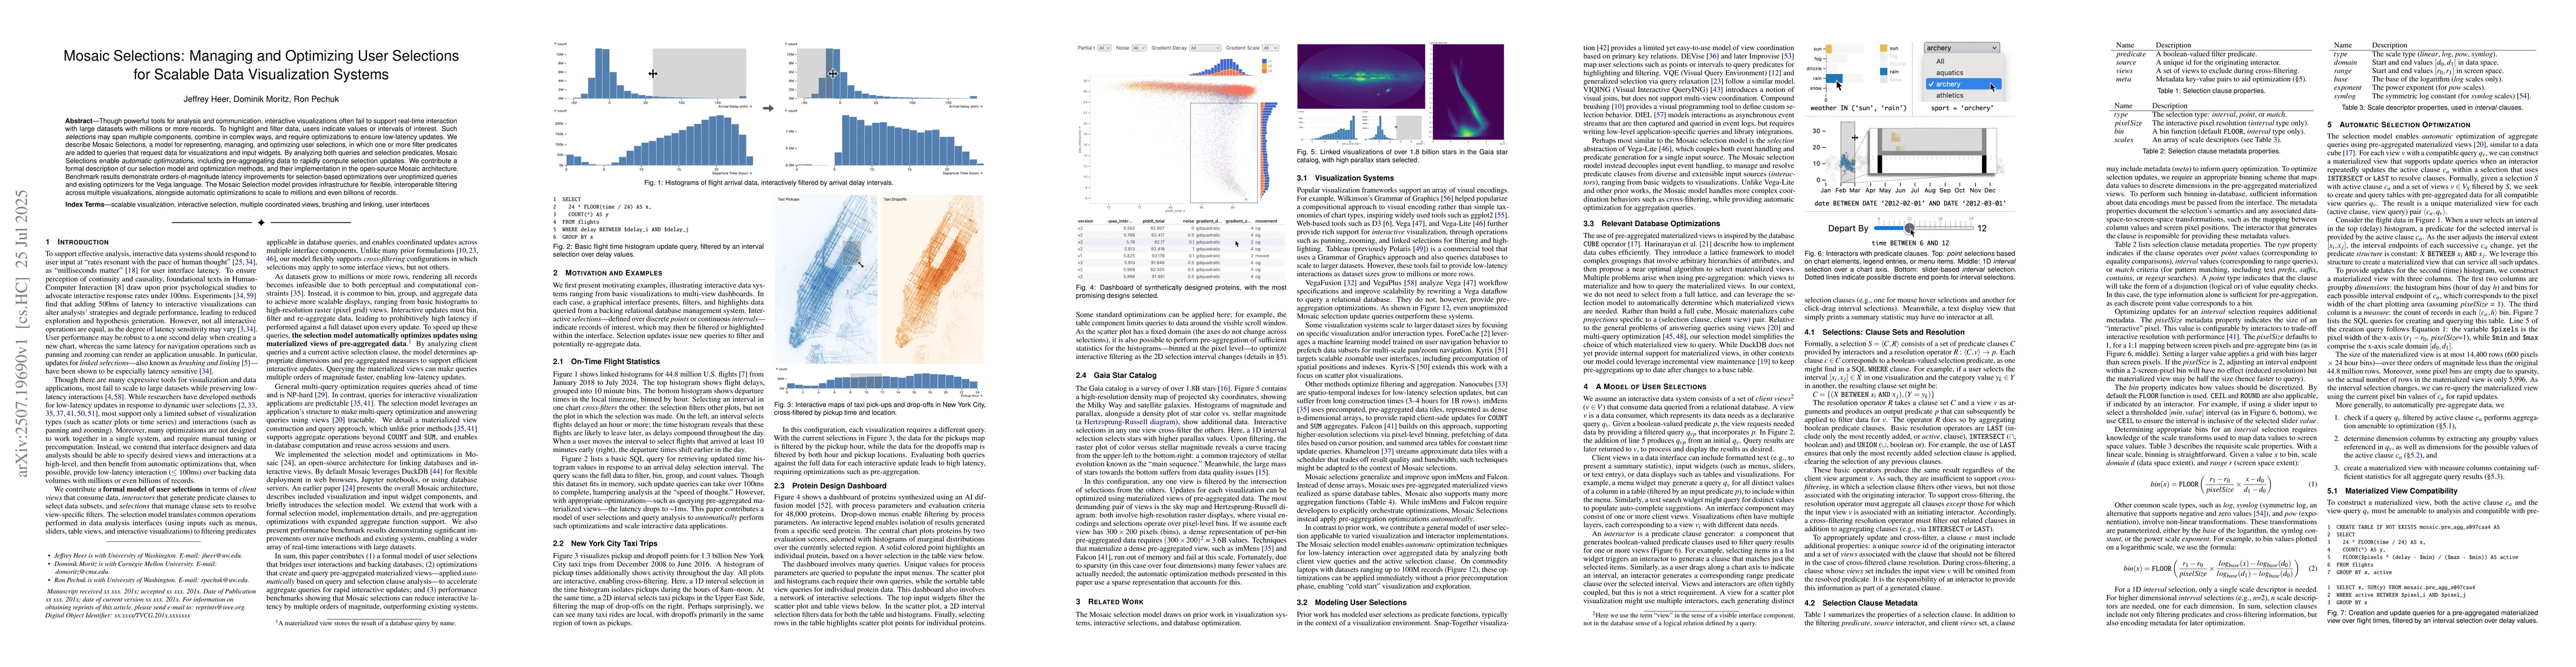
Though powerful tools for analysis and communication, interactive visualizations often fail to support real-time interaction with large datasets with millions or more records. To highlight and filter ...
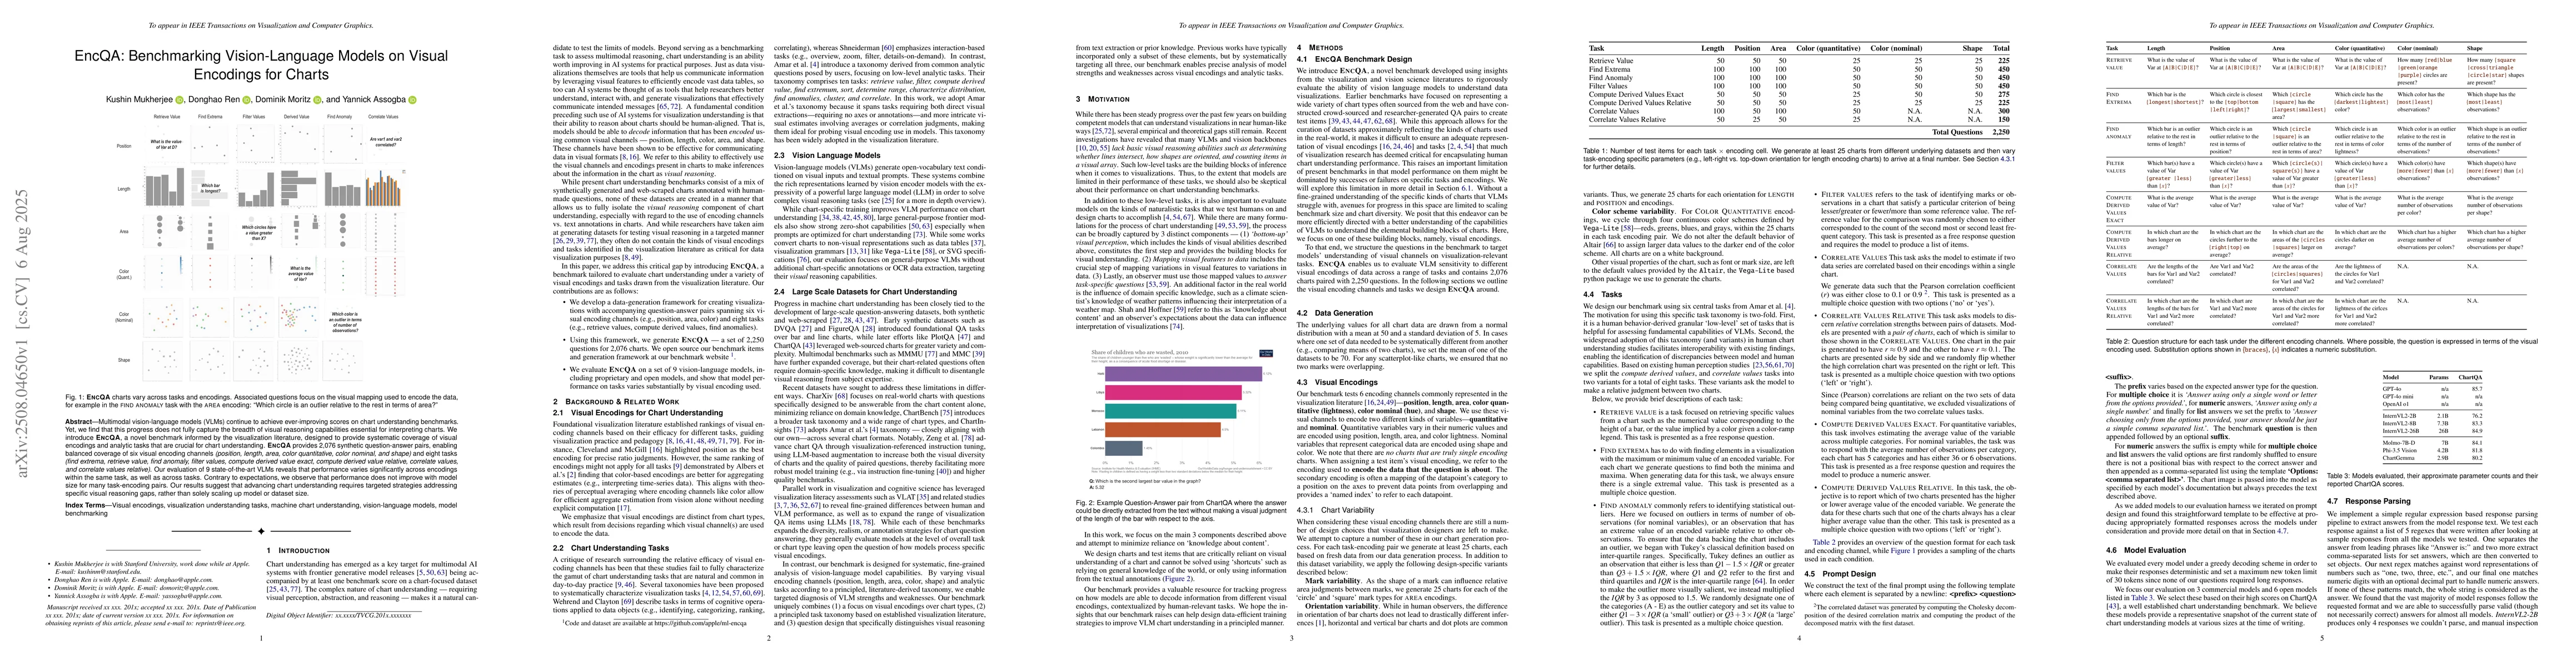
Multimodal vision-language models (VLMs) continue to achieve ever-improving scores on chart understanding benchmarks. Yet, we find that this progress does not fully capture the breadth of visual reaso...
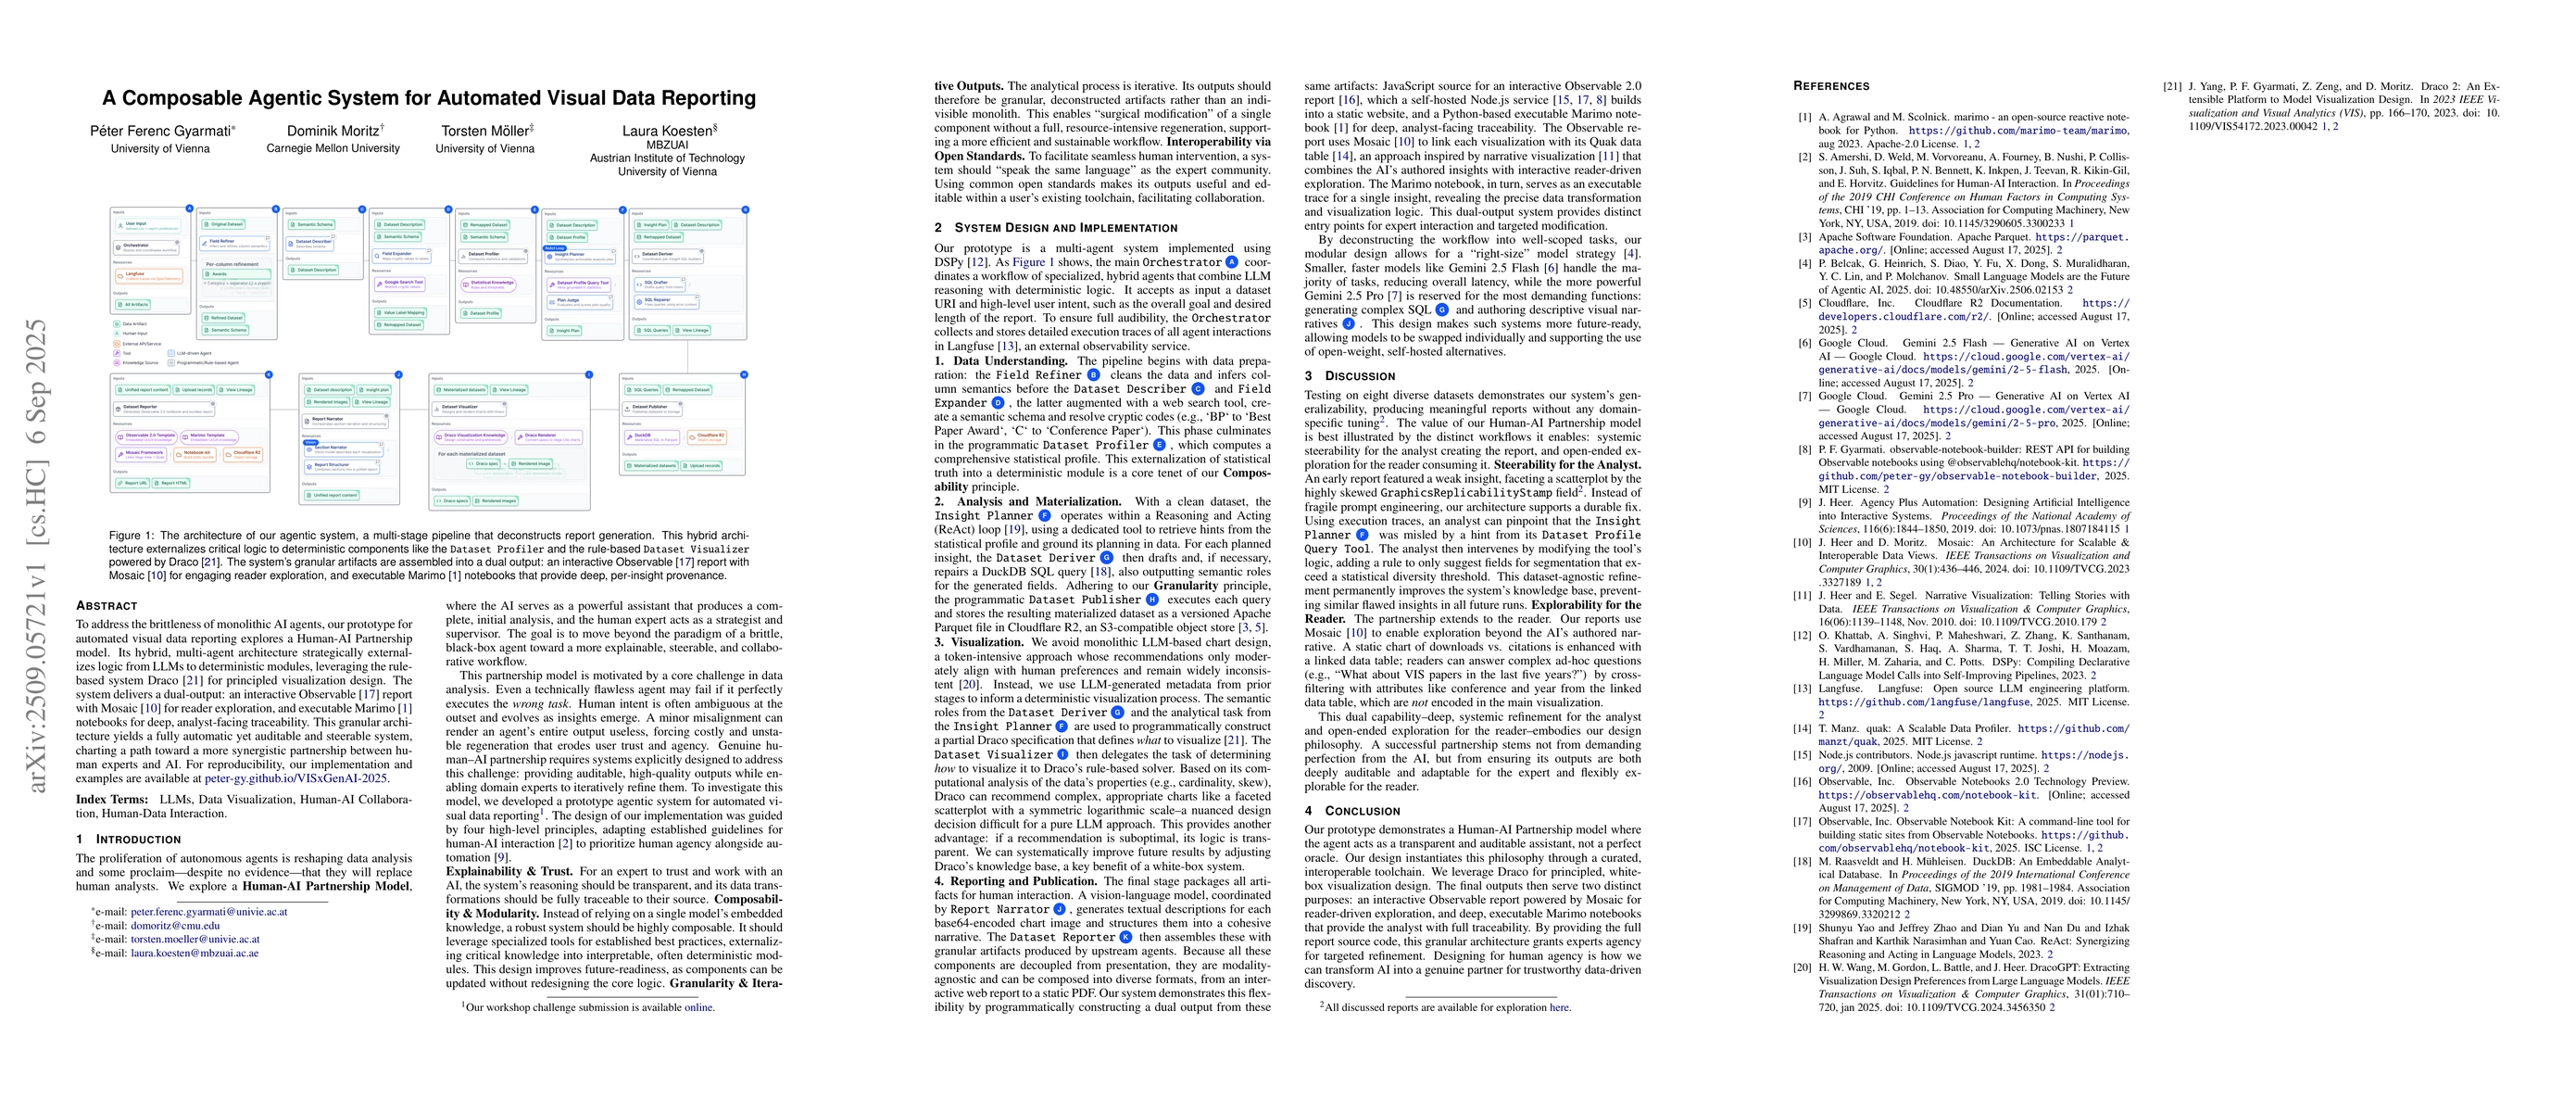
To address the brittleness of monolithic AI agents, our prototype for automated visual data reporting explores a Human-AI Partnership model. Its hybrid, multi-agent architecture strategically external...
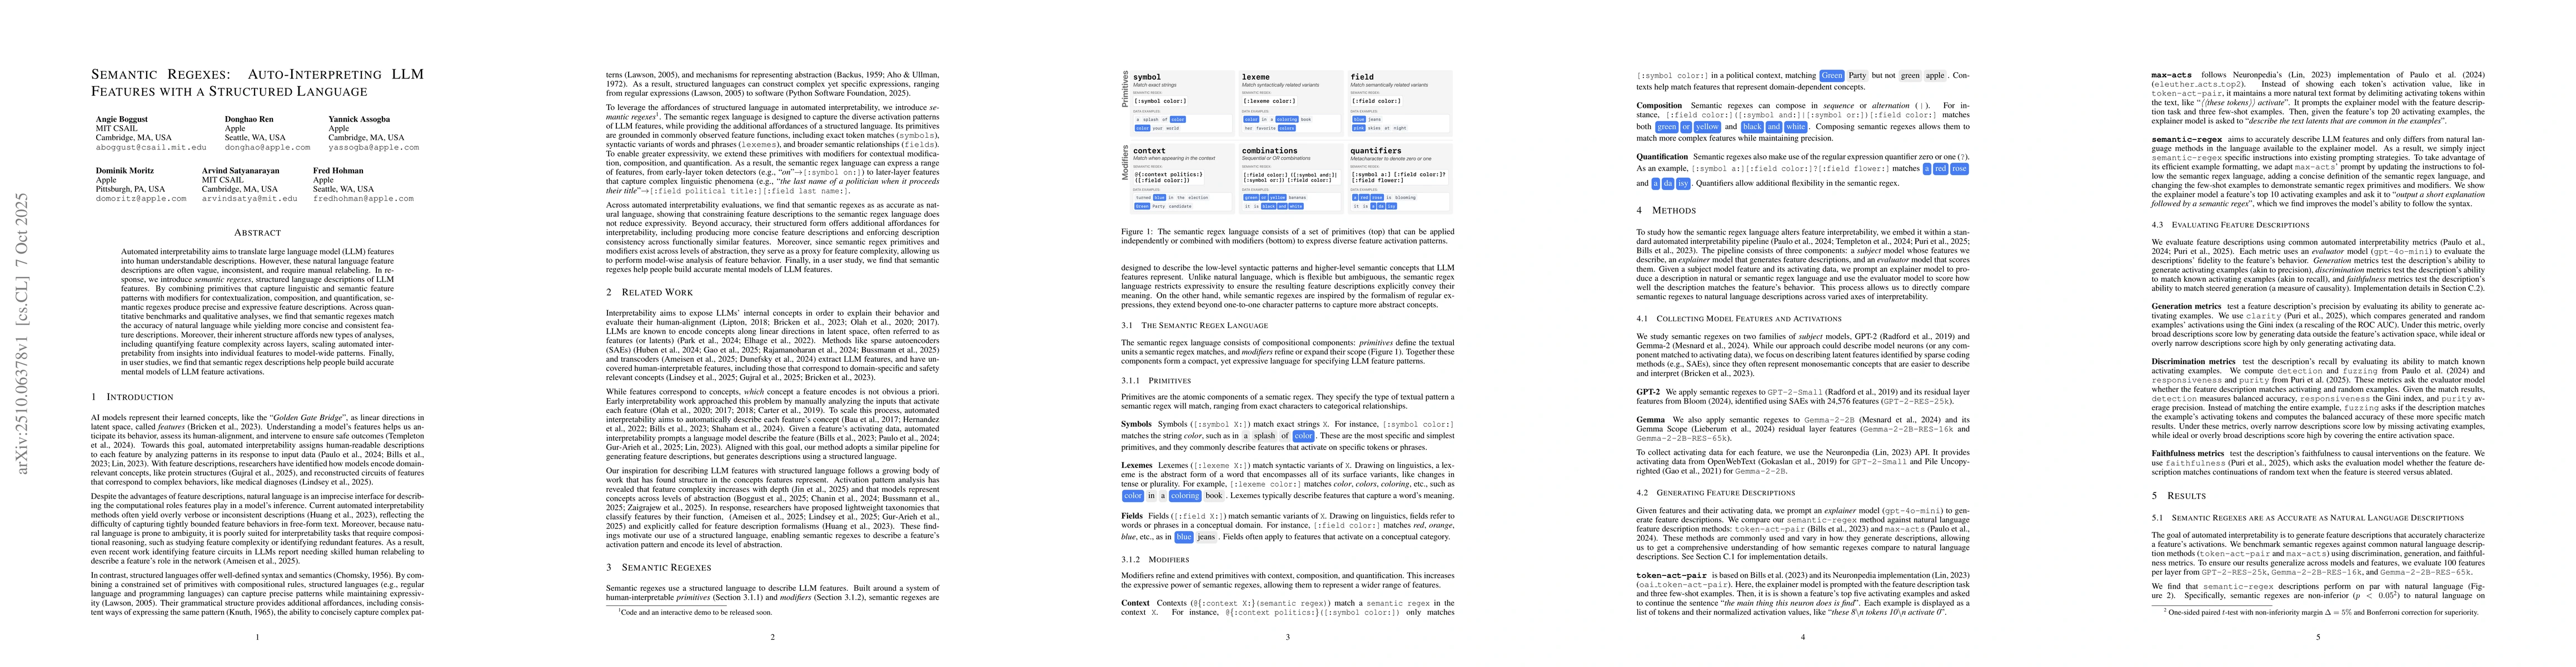
Automated interpretability aims to translate large language model (LLM) features into human understandable descriptions. However, these natural language feature descriptions are often vague, inconsist...
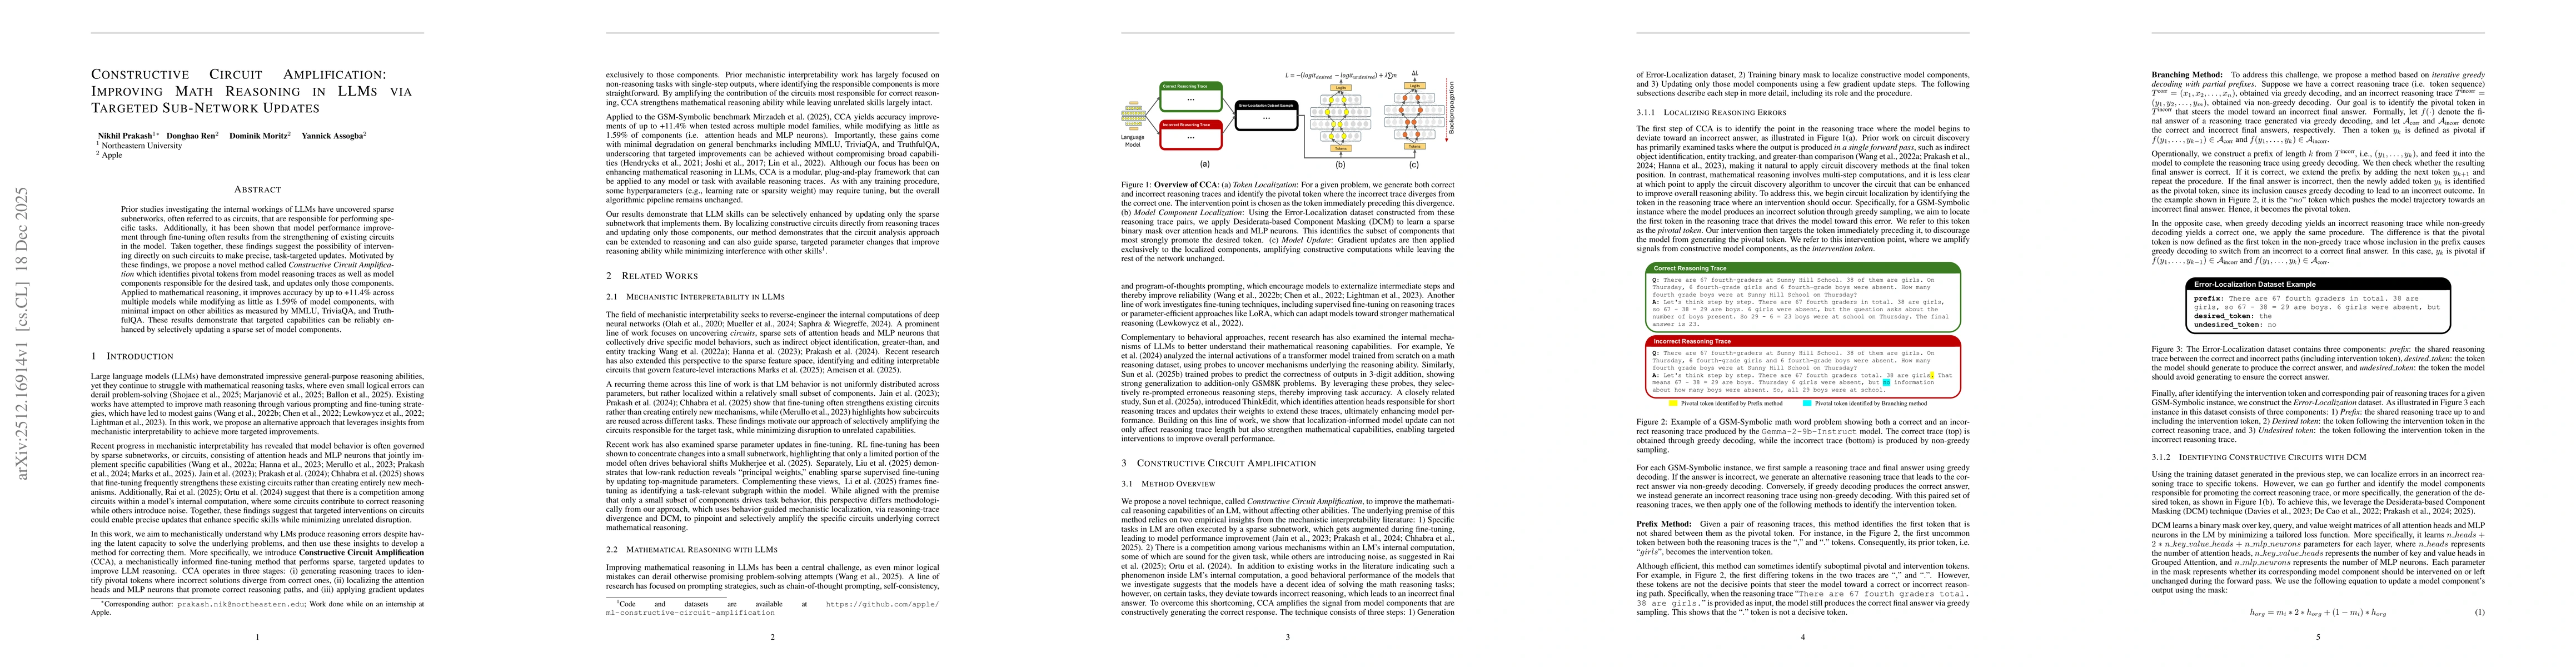
Prior studies investigating the internal workings of LLMs have uncovered sparse subnetworks, often referred to as circuits, that are responsible for performing specific tasks. Additionally, it has bee...
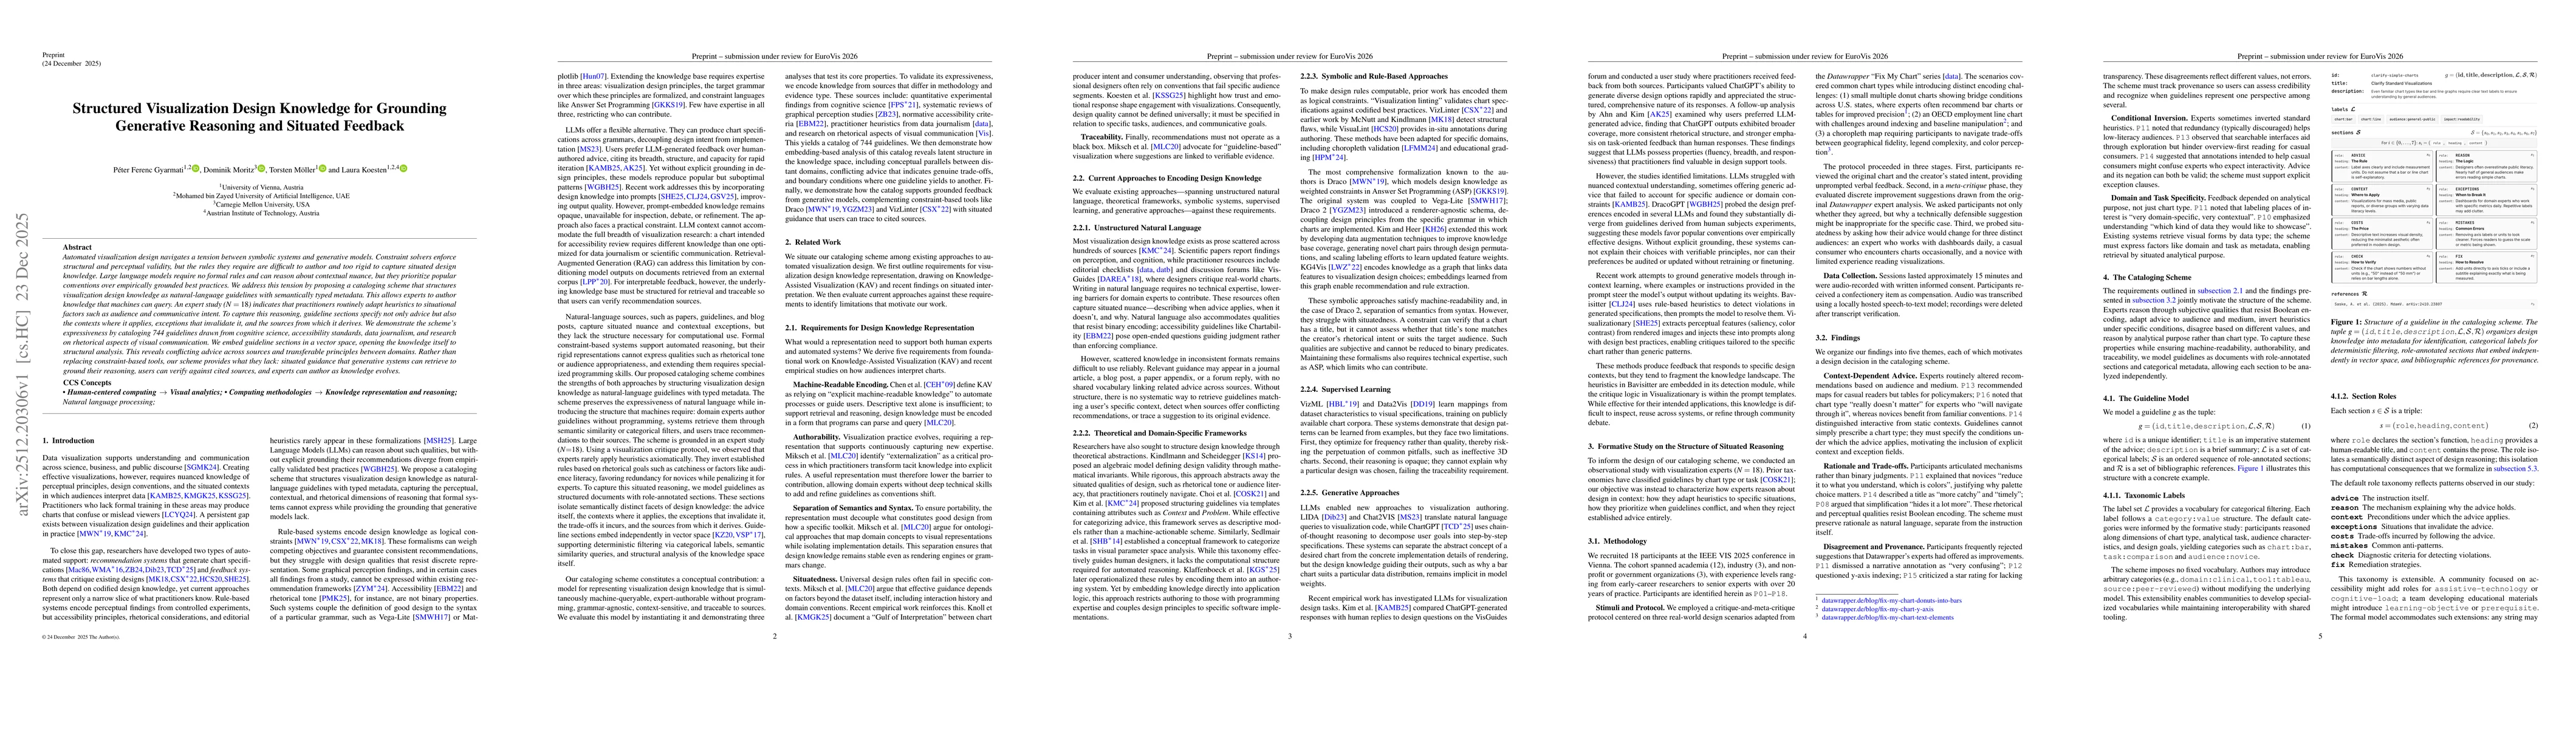
Automated visualization design navigates a tension between symbolic systems and generative models. Constraint solvers enforce structural and perceptual validity, but the rules they require are difficu...
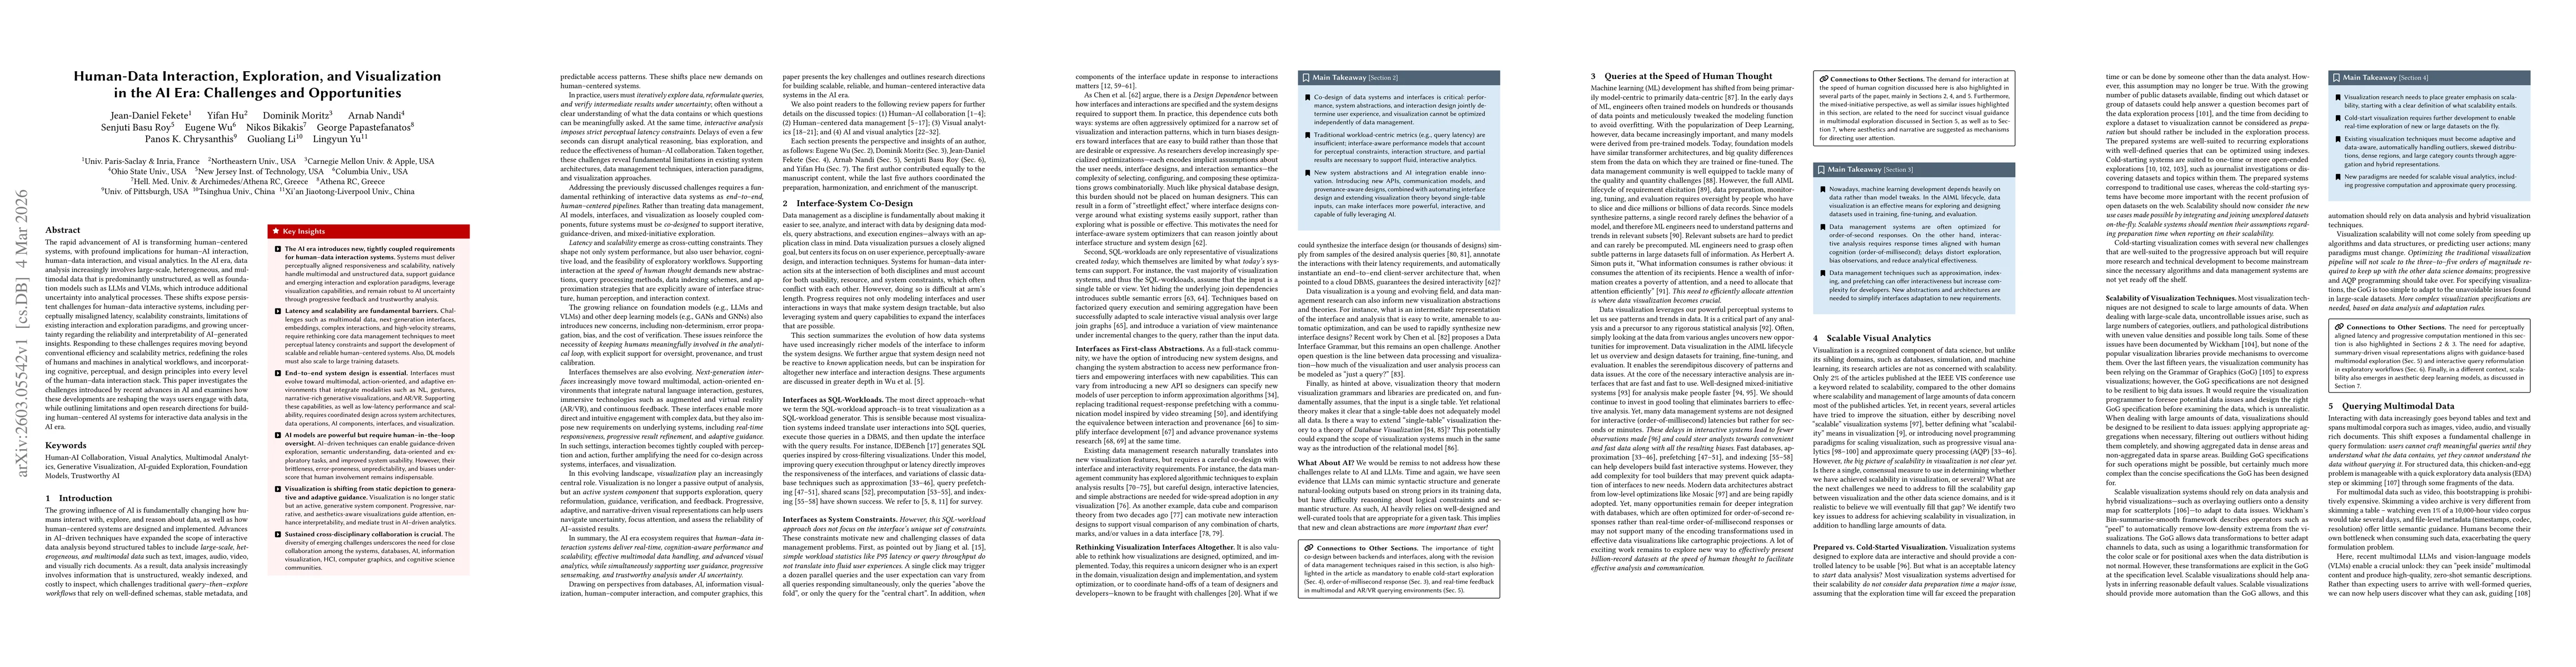
The rapid advancement of AI is transforming human-centered systems, with profound implications for human-AI interaction, human-data interaction, and visual analytics. In the AI era, data analysis incr...
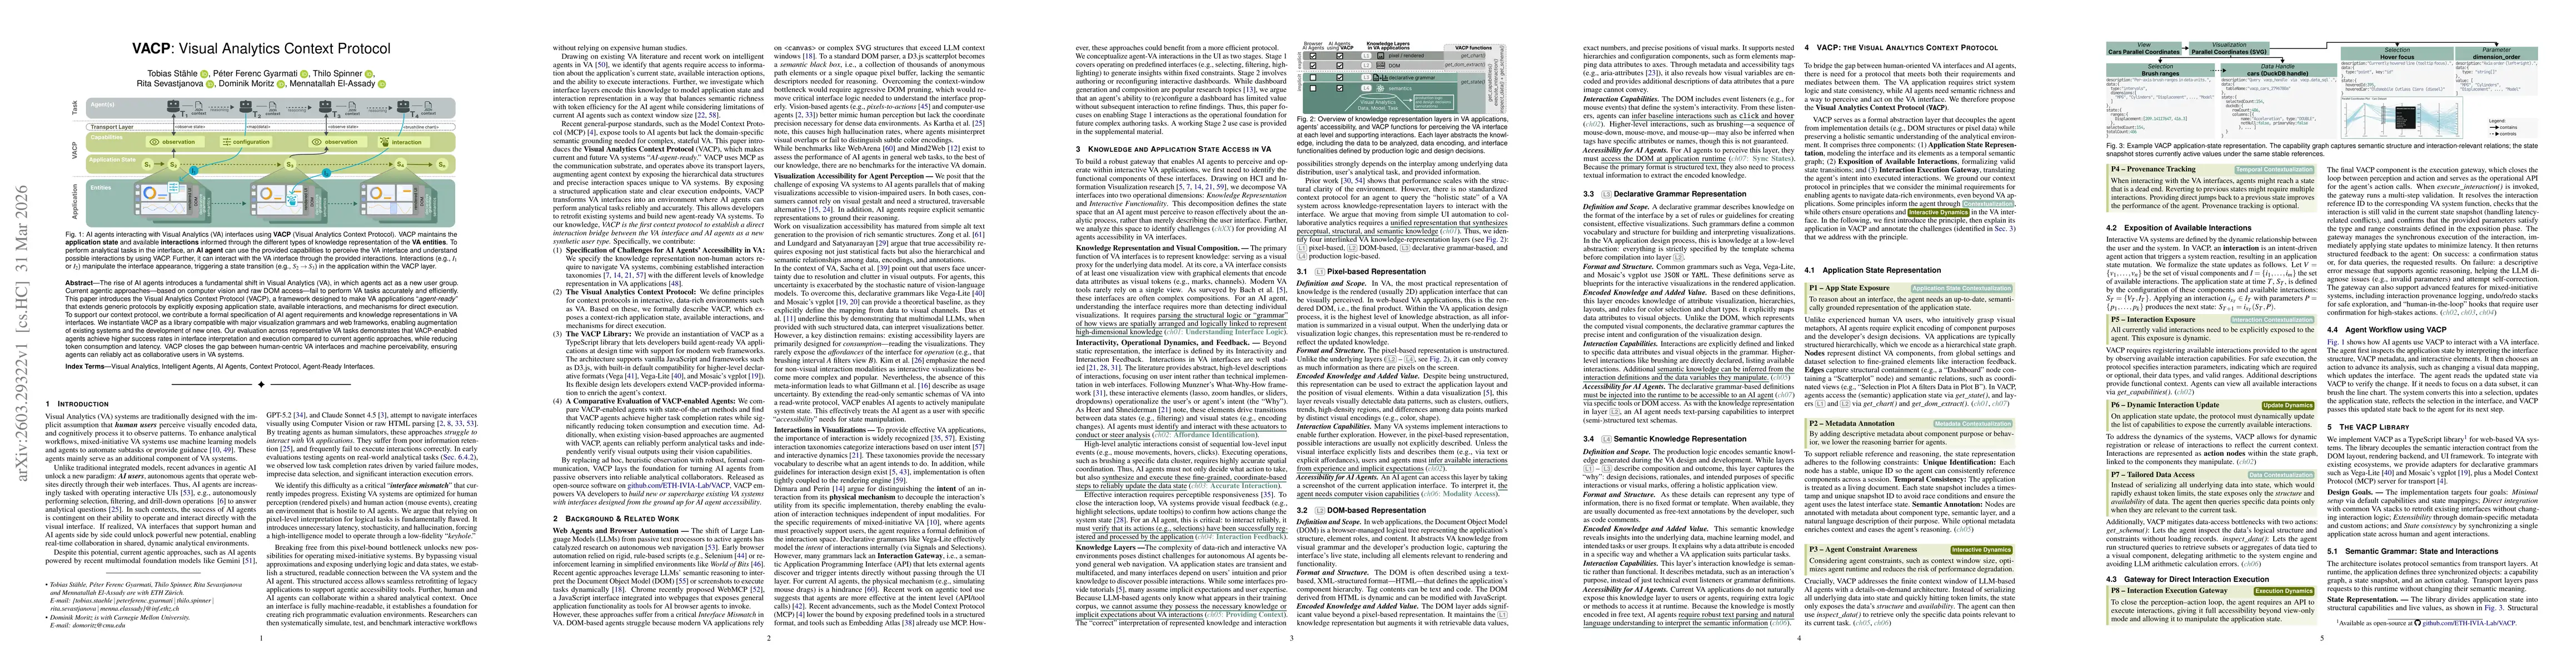
The rise of AI agents introduces a fundamental shift in Visual Analytics (VA), in which agents act as a new user group. Current agentic approaches - based on computer vision and raw DOM access - fail ...
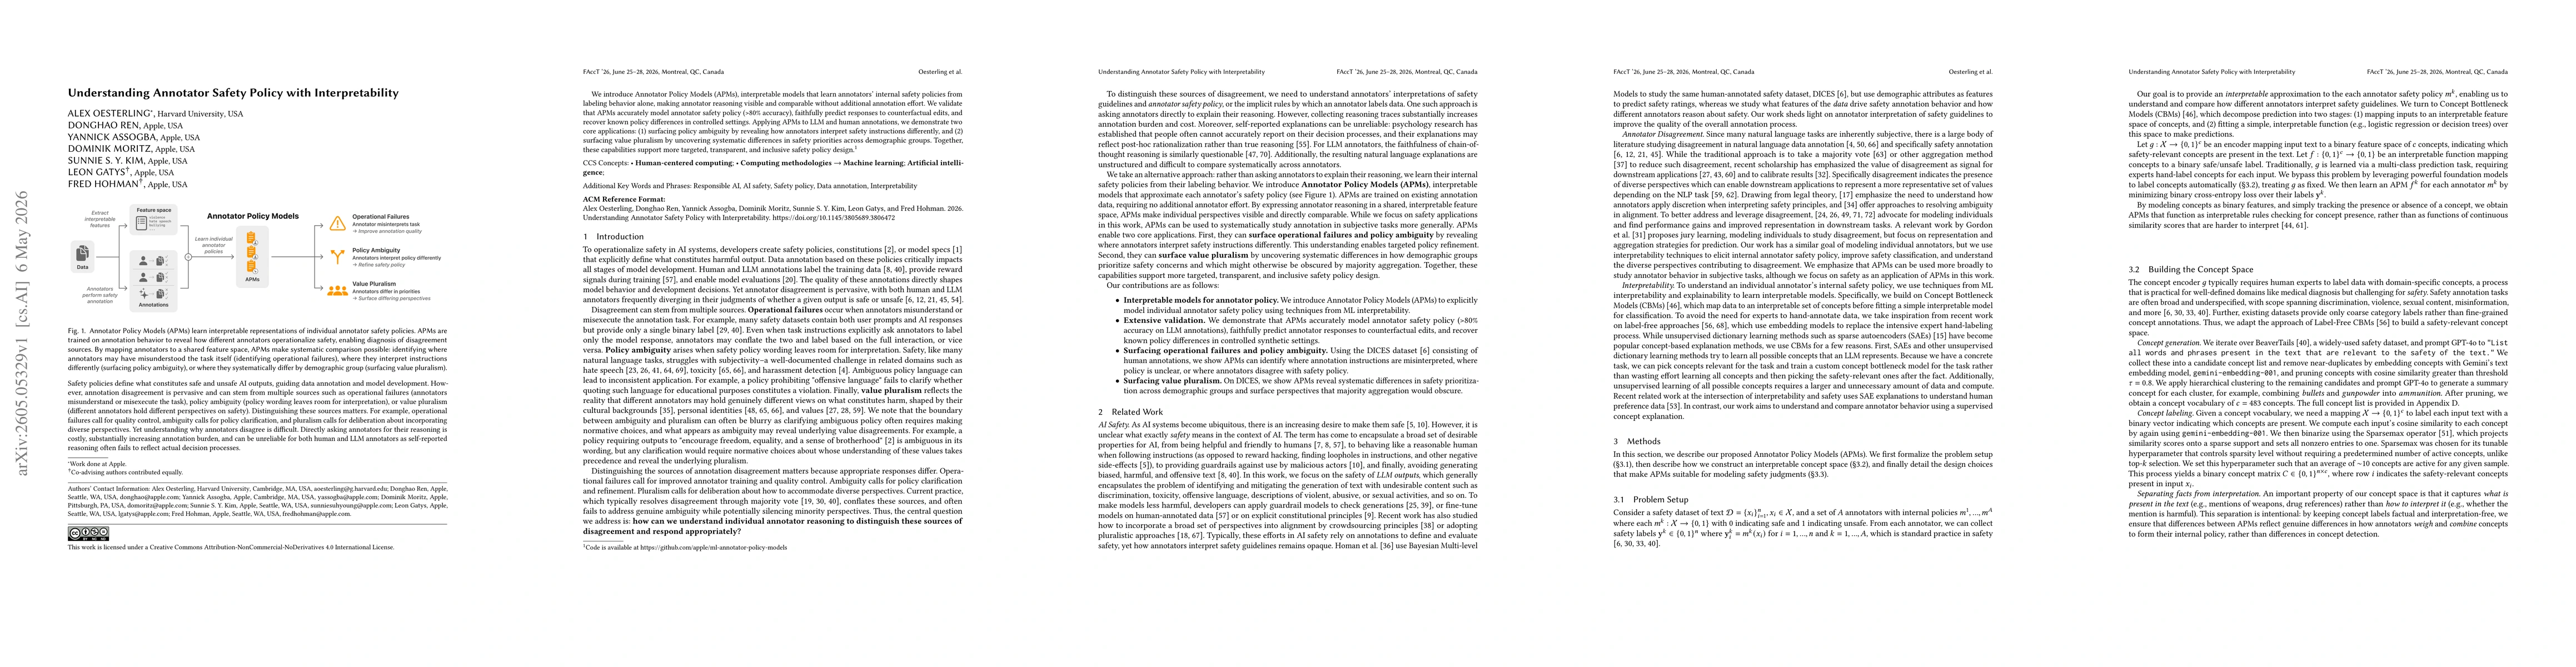
Safety policies define what constitutes safe and unsafe AI outputs, guiding data annotation and model development. However, annotation disagreement is pervasive and can stem from multiple sources such...