Data Navigator: An accessibility-centered data navigation toolkit
Publication
Metrics
AI Quick Summary
Data Navigator is an accessibility-centered toolkit that enables developers to create navigable data visualizations for people with disabilities by supporting diverse input modalities and dynamic graph structures. It aims to address the limitations of existing visualizations, offering a solution for accessible navigation and integration with existing tools.
Paper Preview
Abstract
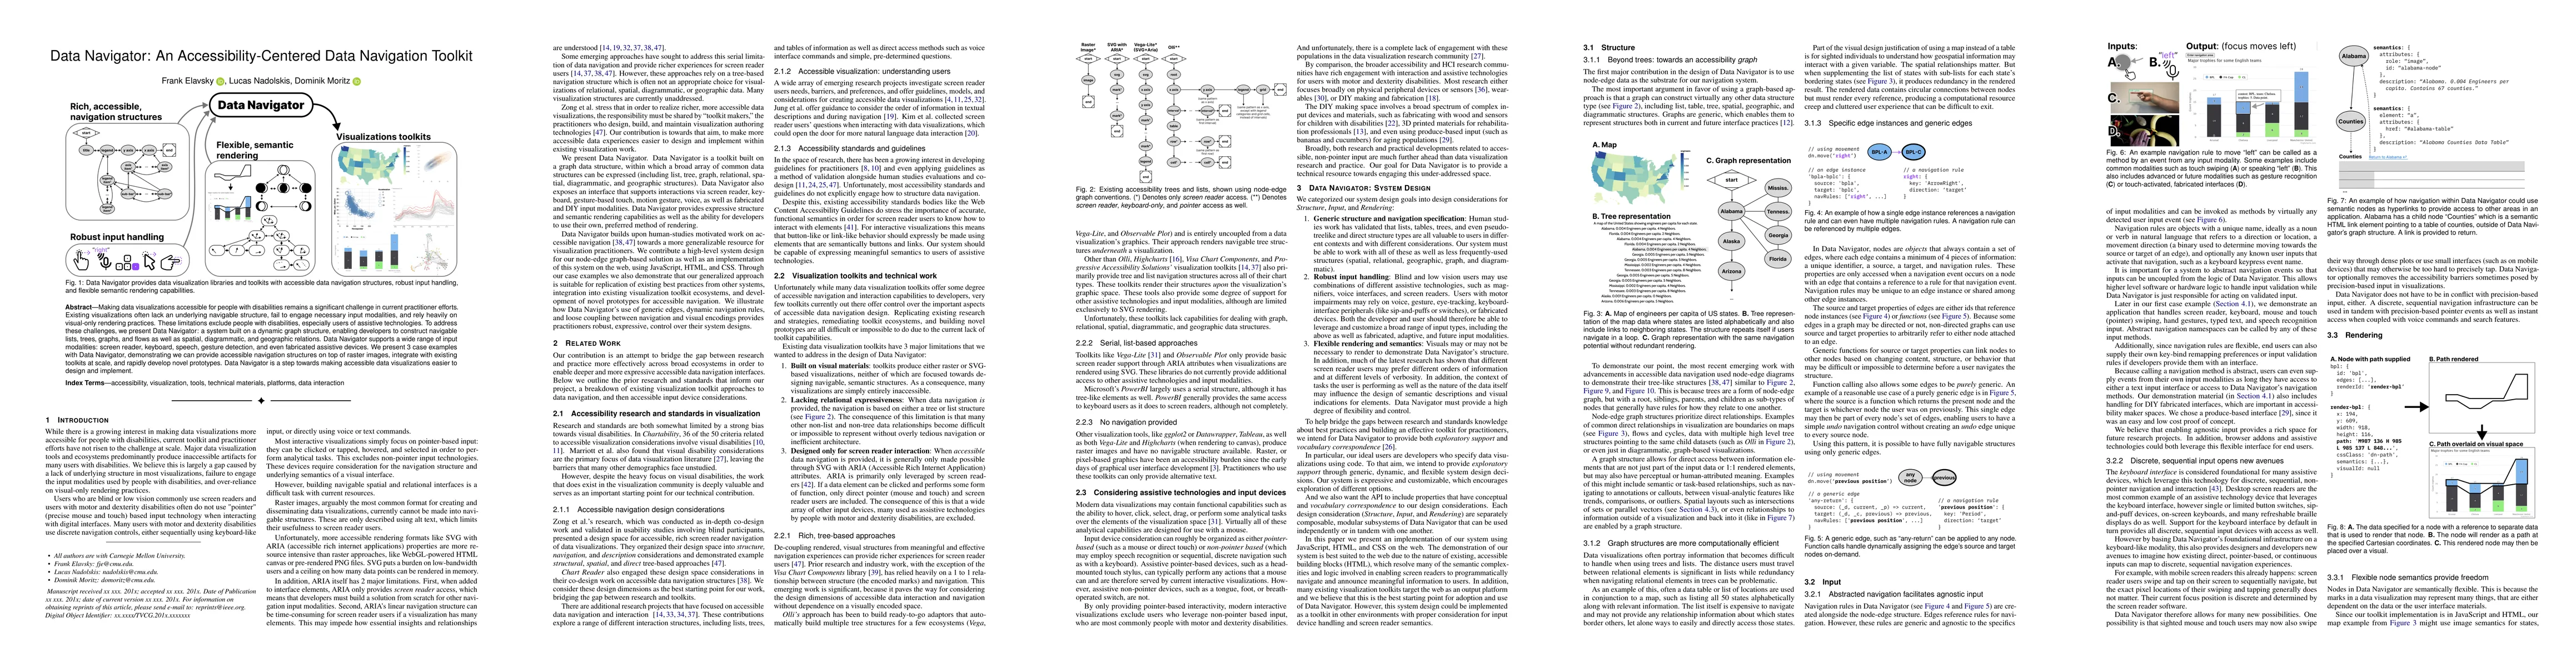
Making data visualizations accessible for people with disabilities remains a significant challenge in current practitioner efforts. Existing visualizations often lack an underlying navigable structure, fail to engage necessary input modalities, and rely heavily on visual-only rendering practices. These limitations exclude people with disabilities, especially users of assistive technologies. To address these challenges, we present Data Navigator: a system built on a dynamic graph structure, enabling developers to construct navigable lists, trees, graphs, and flows as well as spatial, diagrammatic, and geographic relations. Data Navigator supports a wide range of input modalities: screen reader, keyboard, speech, gesture detection, and even fabricated assistive devices. We present 3 case examples with Data Navigator, demonstrating we can provide accessible navigation structures on top of raster images, integrate with existing toolkits at scale, and rapidly develop novel prototypes. Data Navigator is a step towards making accessible data visualizations easier to design and implement.
AI Key Findings
Get AI-generated insights about this paper's methodology, results, significance, and more — seven facets brought into focus.
Impact
Paper Details
Authors
PDF Preview
Key Terms
Citation Network
Current paper (gray), citations (green), references (blue)
Display is limited for performance on very large graphs.
Discussion 0