Publication
Metrics
AI Quick Summary
Title: Optimizing Dataflow Systems for Scalable Interactive Visualization Summary: VegaPlus automates the optimization of interactive dashboards for large datasets by leveraging an optimizer that adapts execution plans based on user interactions, achieving superior performance compared to traditional methods.
Paper Preview
Abstract
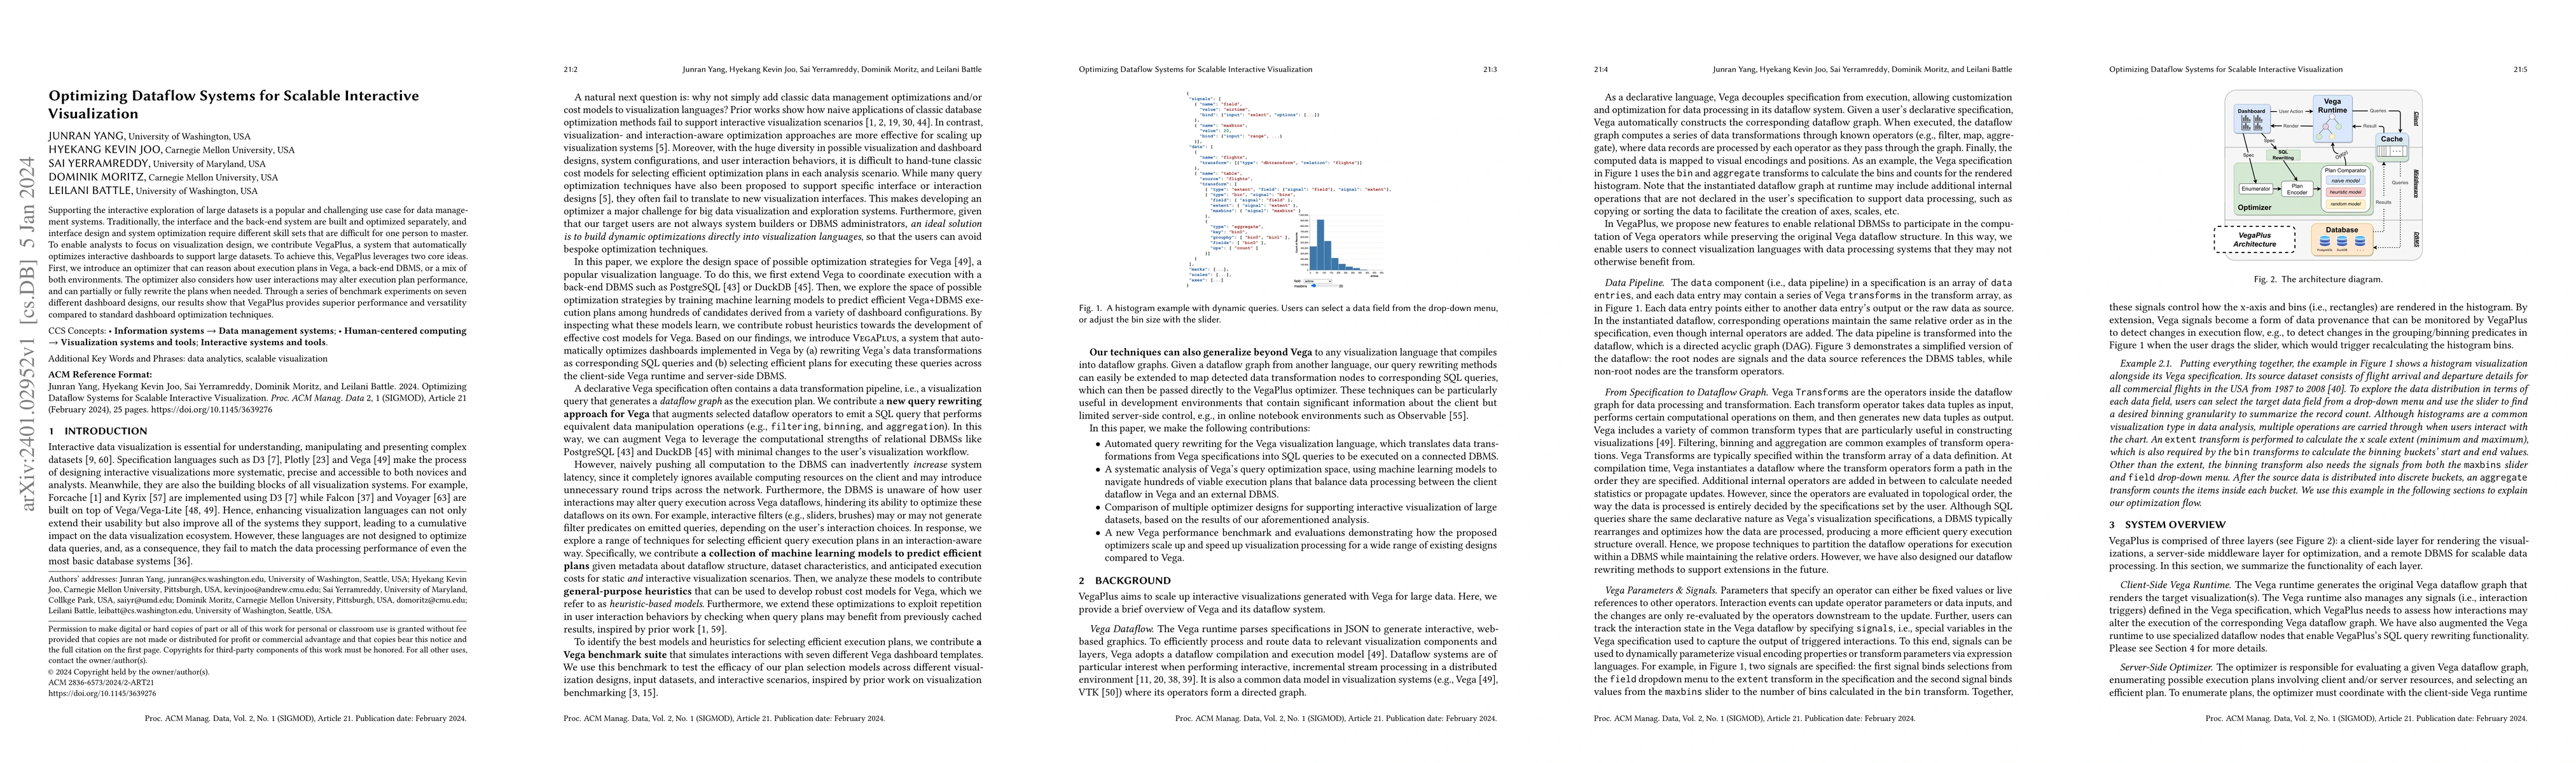
Supporting the interactive exploration of large datasets is a popular and challenging use case for data management systems. Traditionally, the interface and the back-end system are built and optimized separately, and interface design and system optimization require different skill sets that are difficult for one person to master. To enable analysts to focus on visualization design, we contribute VegaPlus, a system that automatically optimizes interactive dashboards to support large datasets. To achieve this, VegaPlus leverages two core ideas. First, we introduce an optimizer that can reason about execution plans in Vega, a back-end DBMS, or a mix of both environments. The optimizer also considers how user interactions may alter execution plan performance, and can partially or fully rewrite the plans when needed. Through a series of benchmark experiments on seven different dashboard designs, our results show that VegaPlus provides superior performance and versatility compared to standard dashboard optimization techniques.
AI Key Findings
Get AI-generated insights about this paper's methodology, results, significance, and more — seven facets brought into focus.
Impact
Paper Details
Authors
PDF Preview
Key Terms
Citation Network
Current paper (gray), citations (green), references (blue)
Display is limited for performance on very large graphs.
Discussion 0