Academic Profile
Statistics
Similar Authors
Papers on arXiv
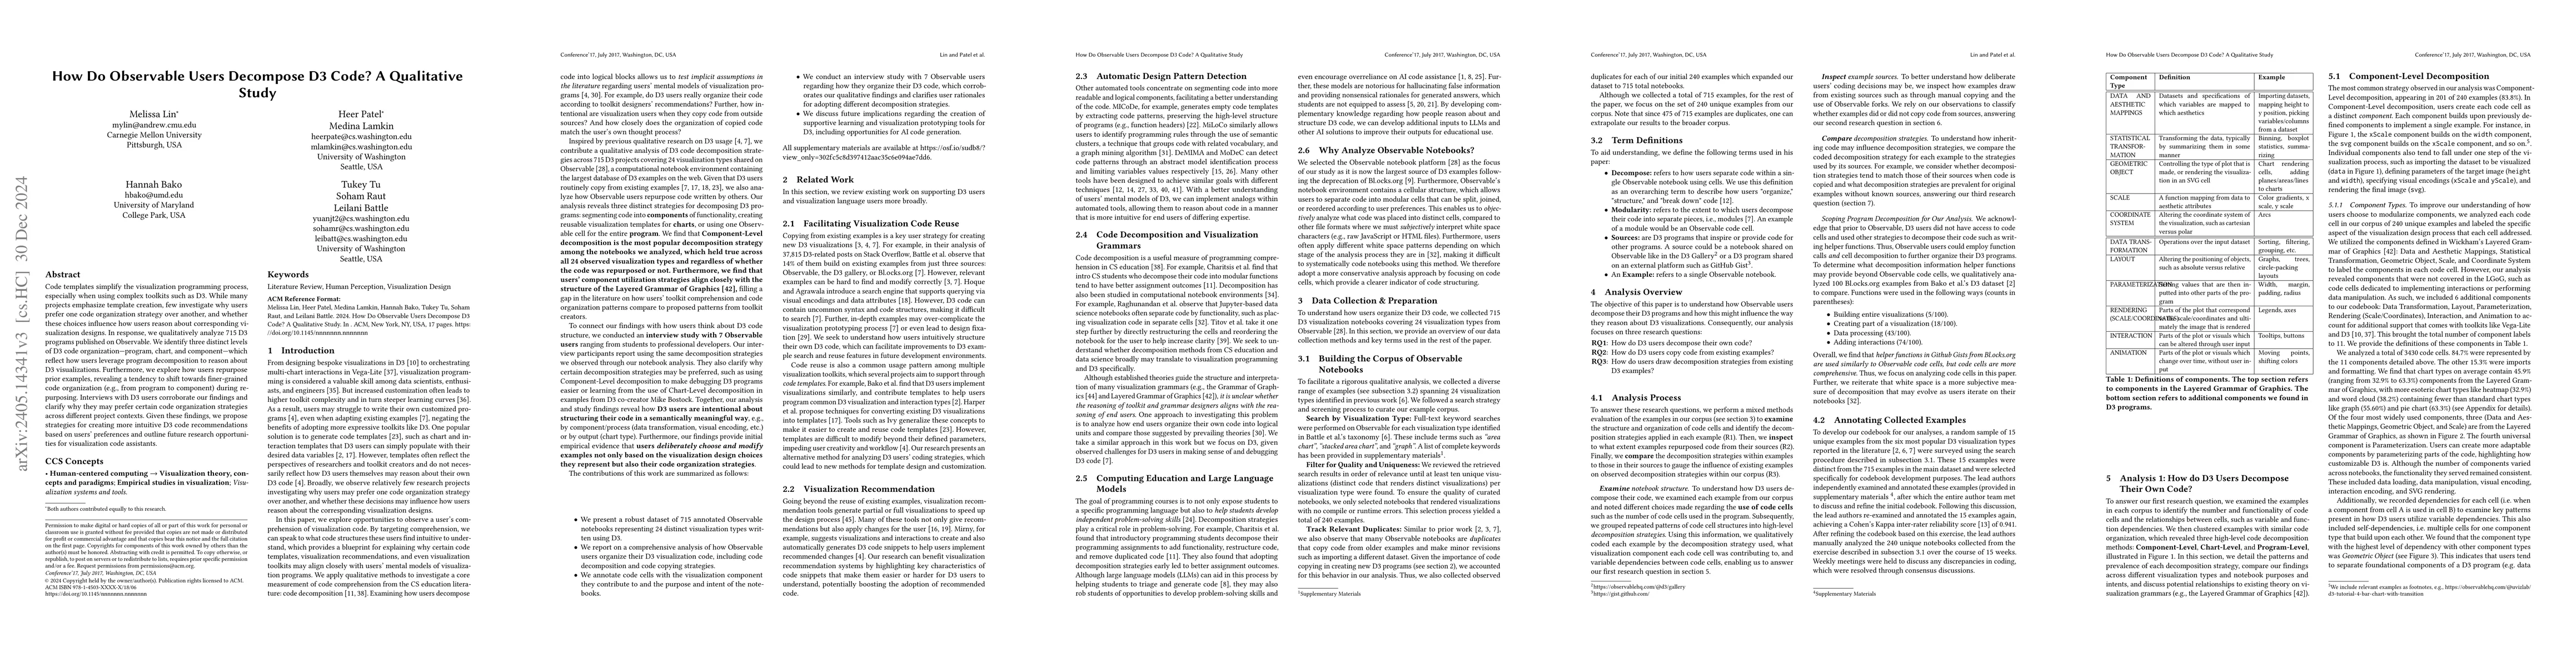
Users often struggle to program visualizations using complex toolkits like D3. Before we can design effective code assistants to support them, we must first understand how D3 users reason about thei...
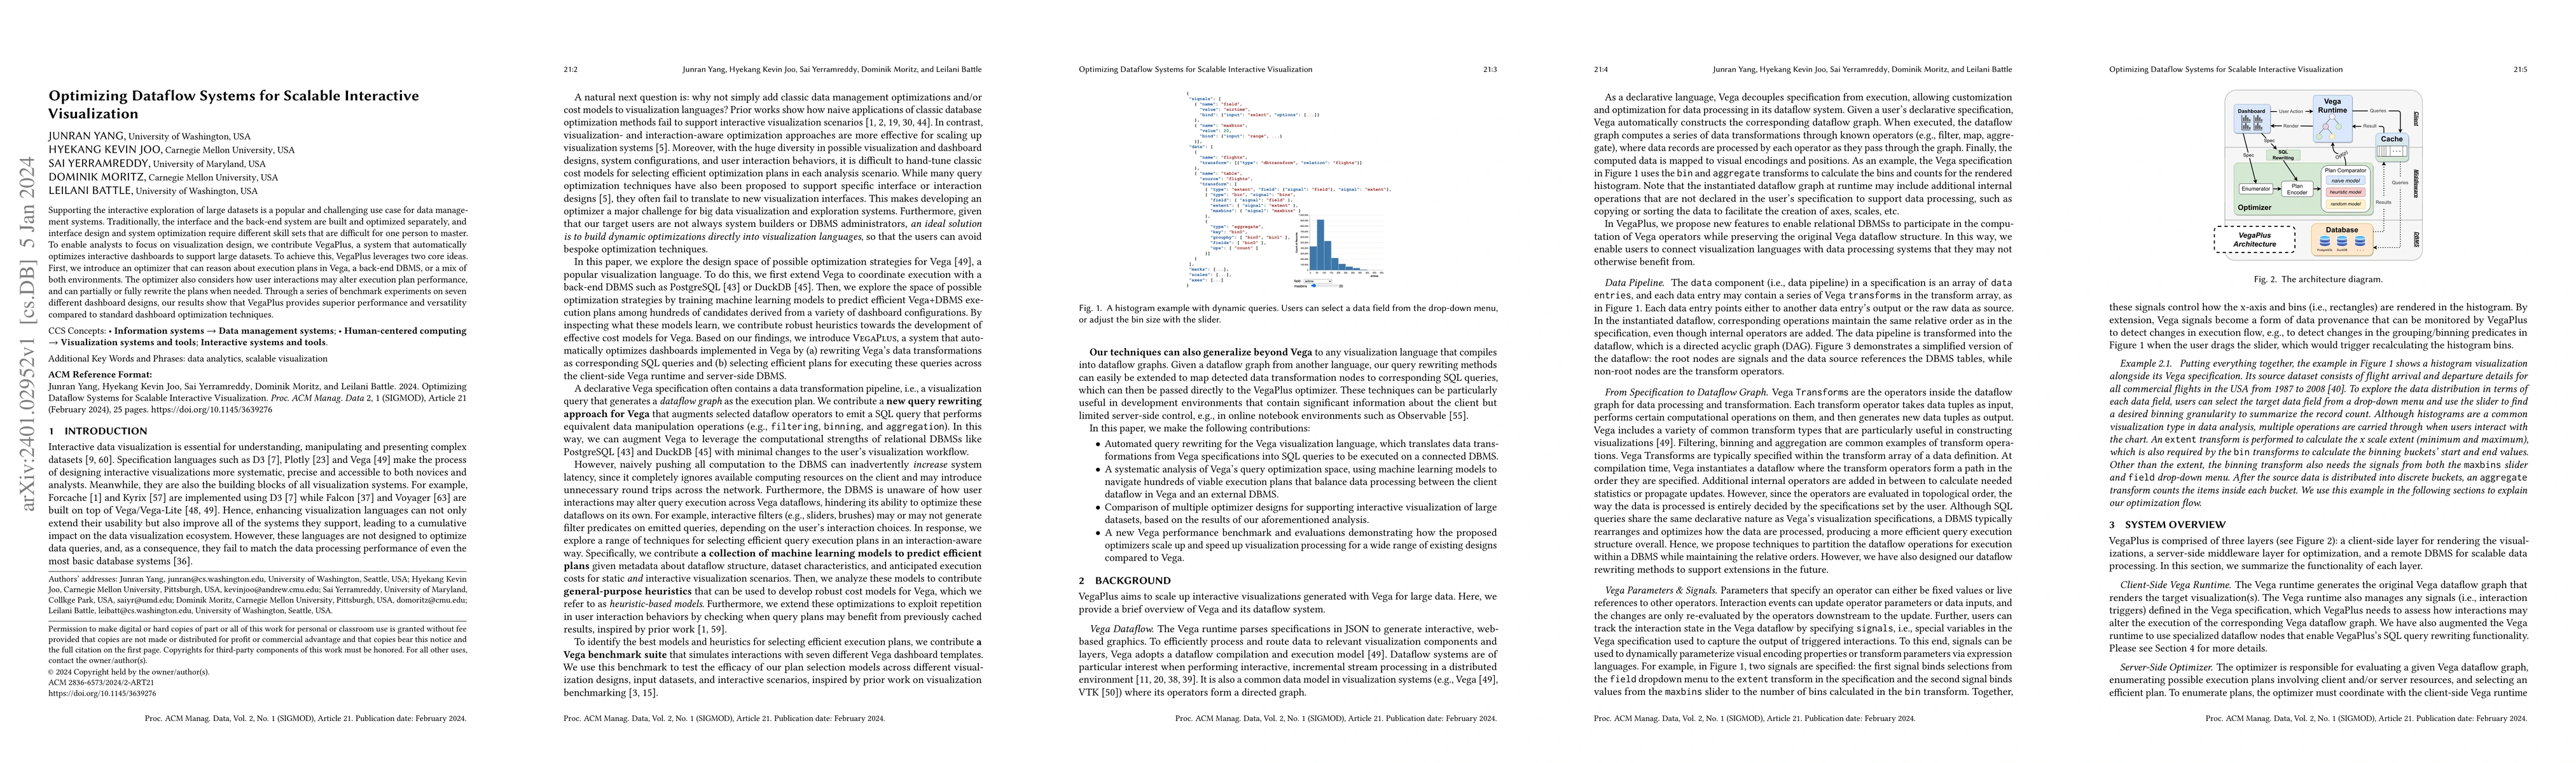
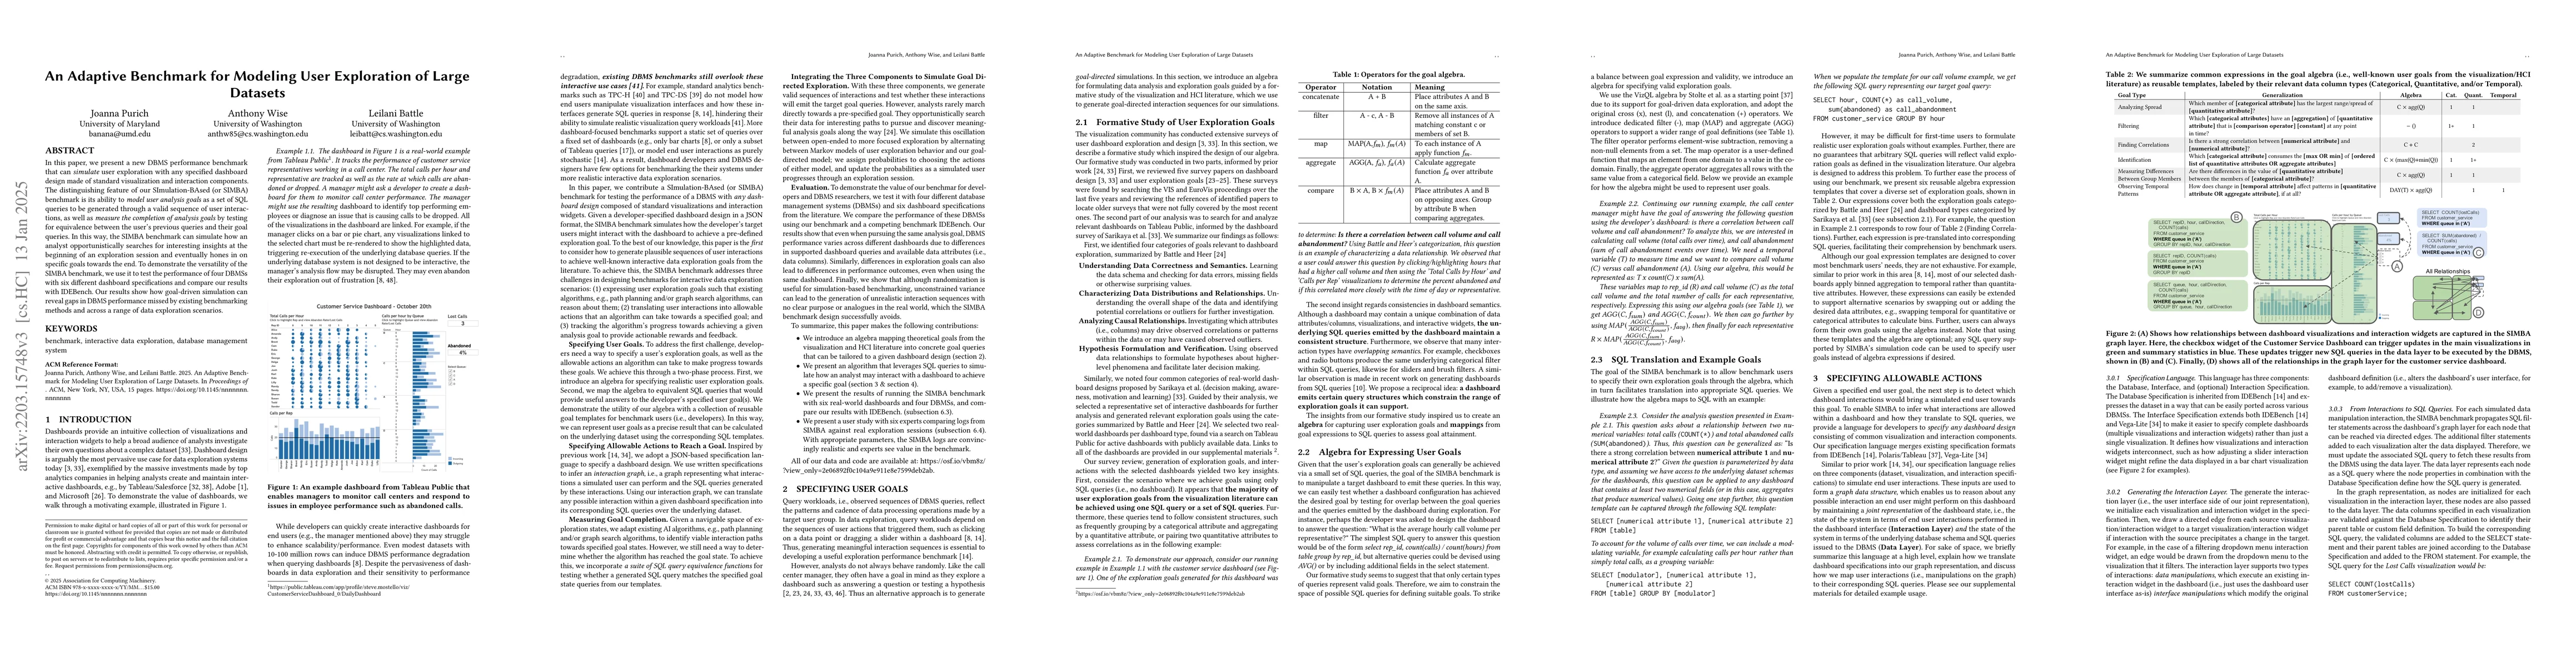
Supporting the interactive exploration of large datasets is a popular and challenging use case for data management systems. Traditionally, the interface and the back-end system are built and optimiz...
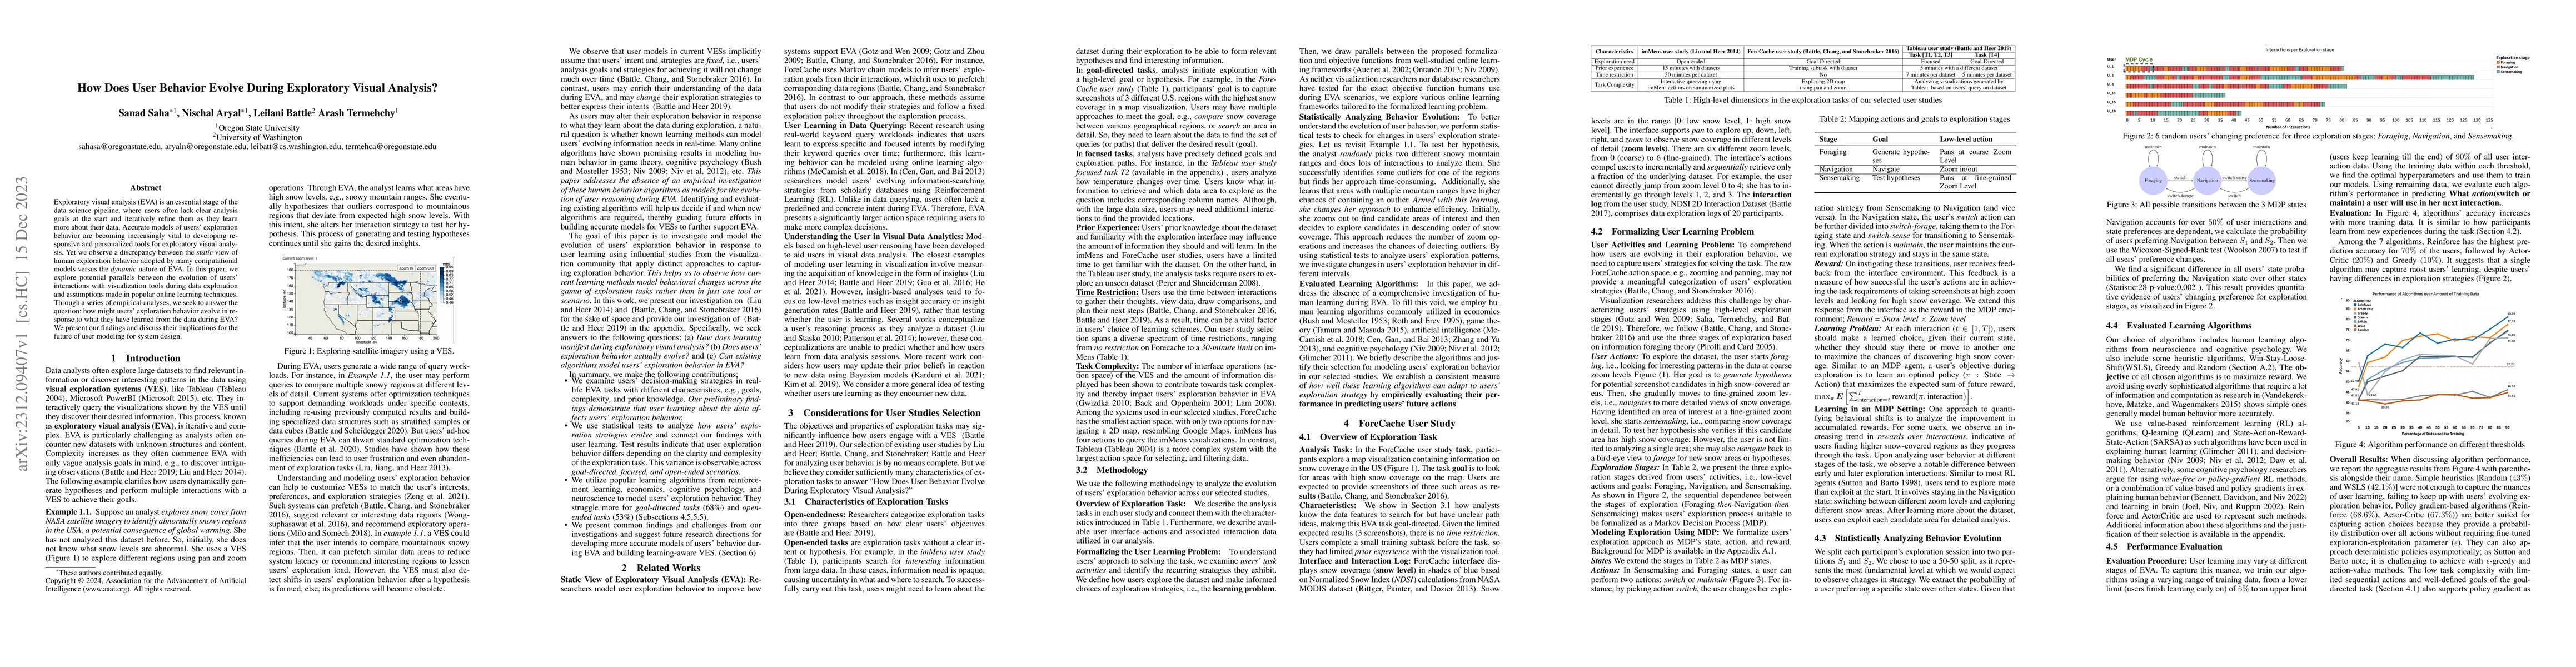
Exploratory visual analysis (EVA) is an essential stage of the data science pipeline, where users often lack clear analysis goals at the start and iteratively refine them as they learn more about th...
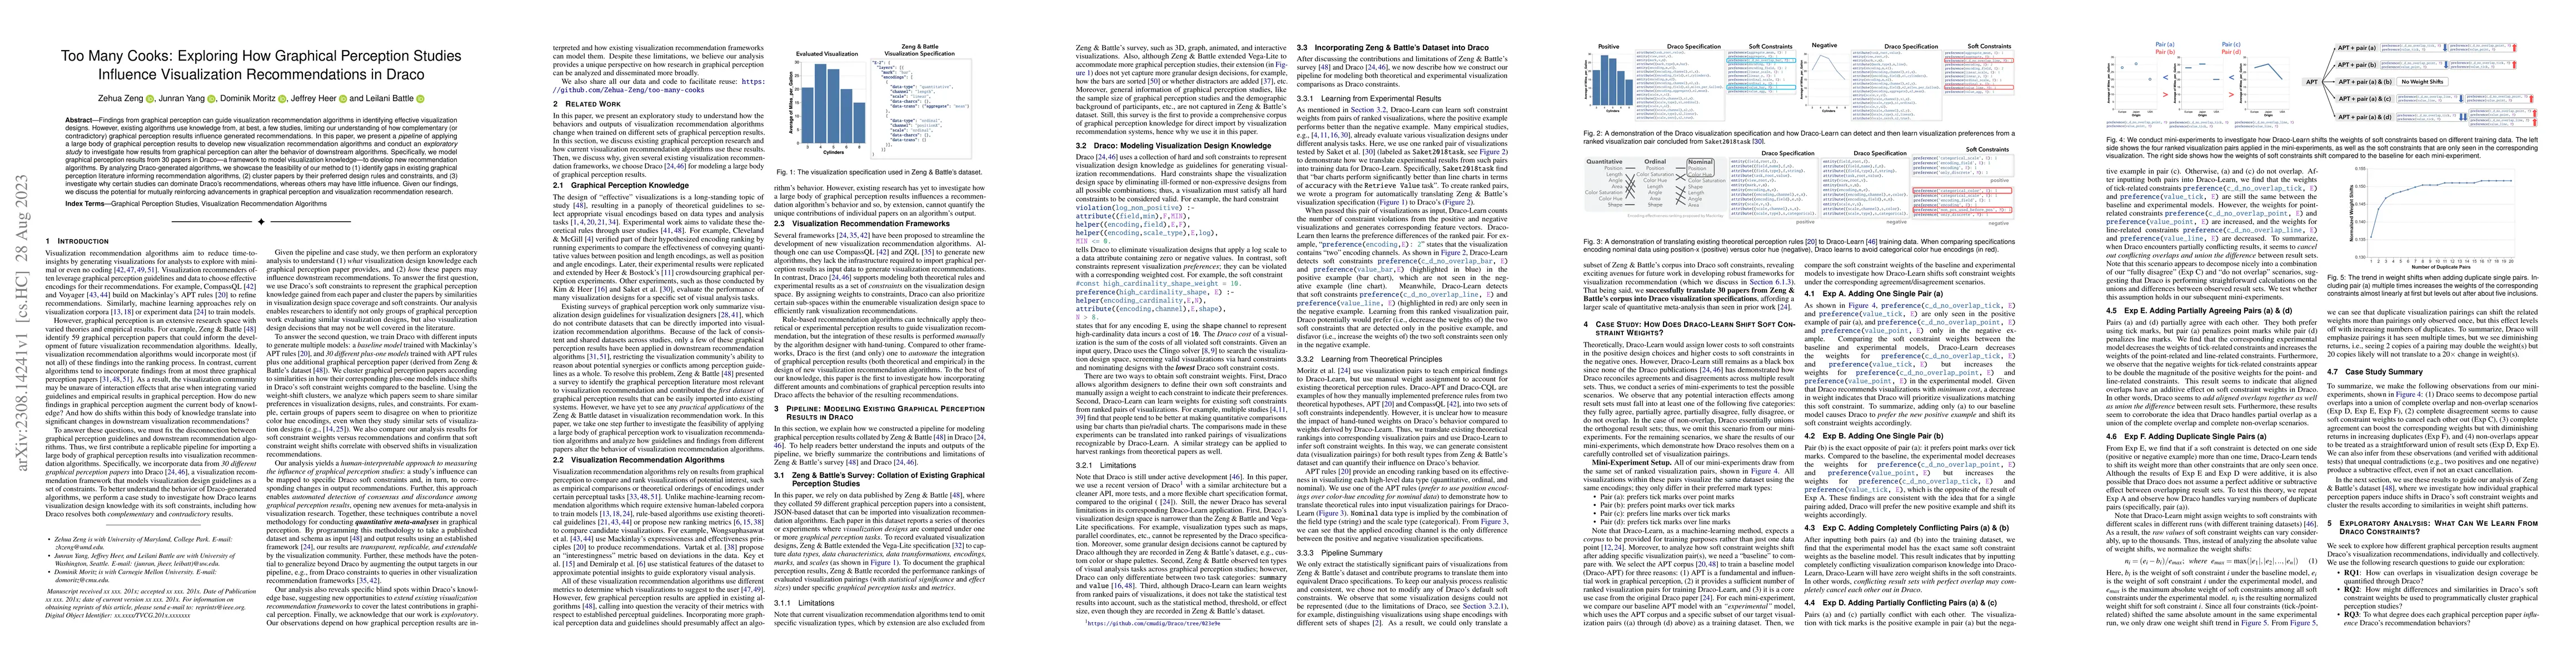
Findings from graphical perception can guide visualization recommendation algorithms in identifying effective visualization designs. However, existing algorithms use knowledge from, at best, a few s...
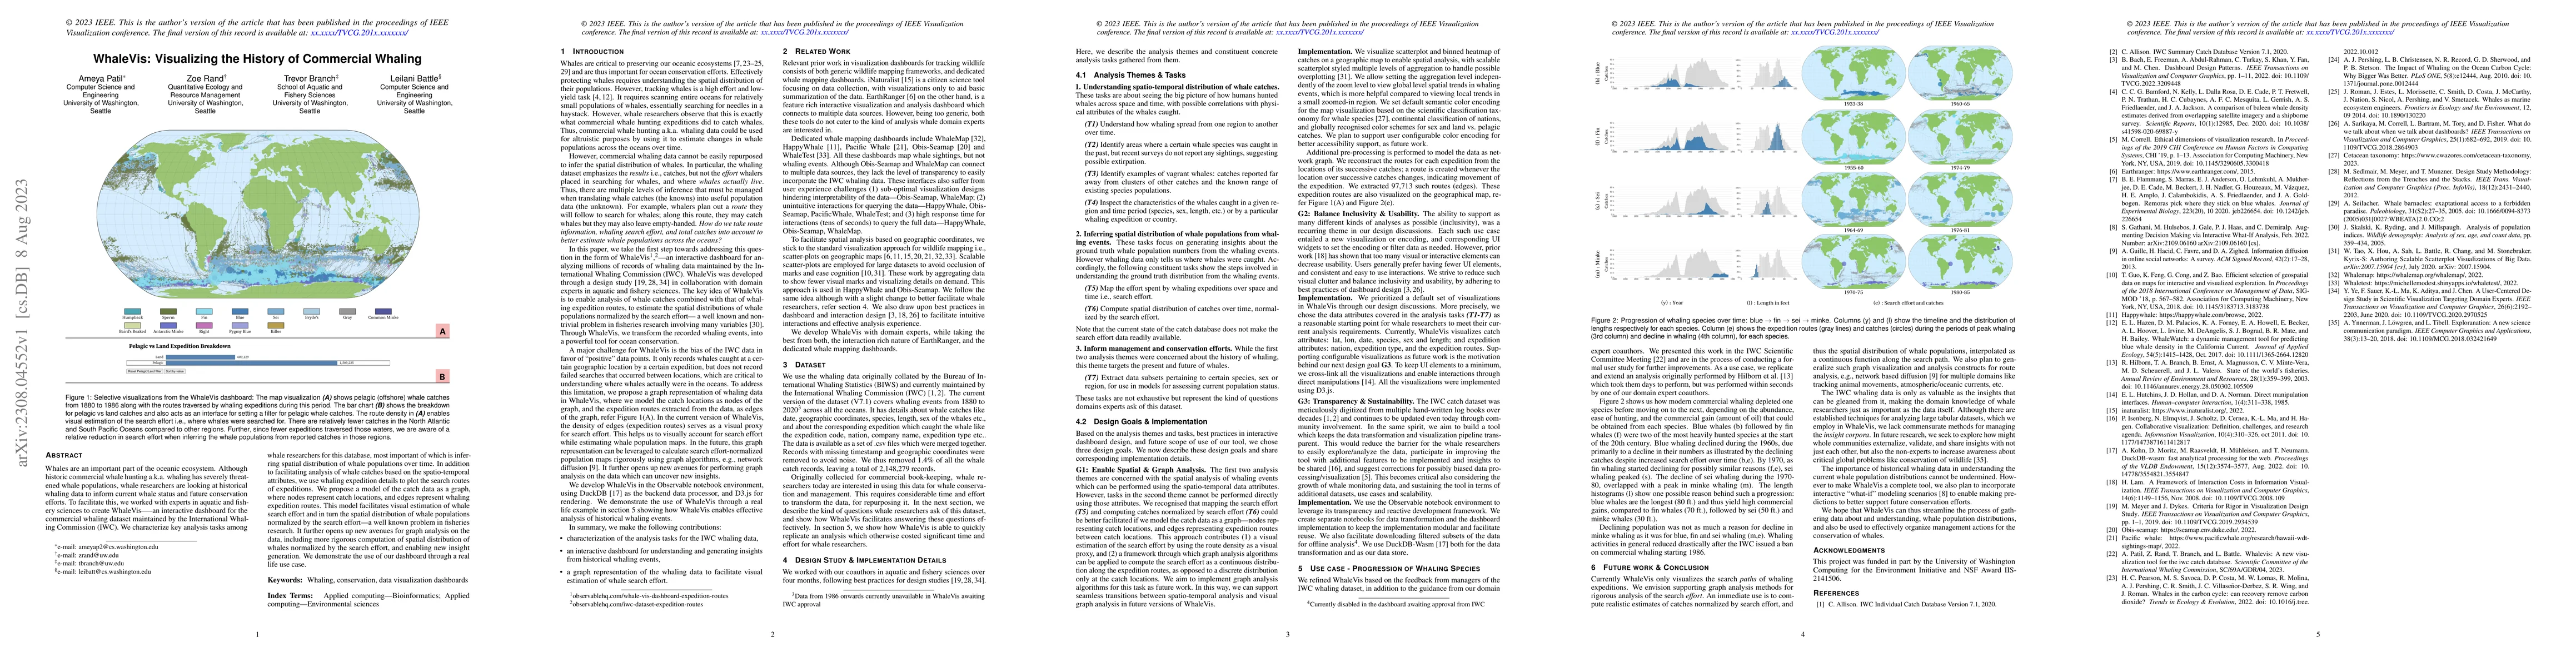
Whales are an important part of the oceanic ecosystem. Although historic commercial whale hunting a.k.a. whaling has severely threatened whale populations, whale researchers are looking at historica...
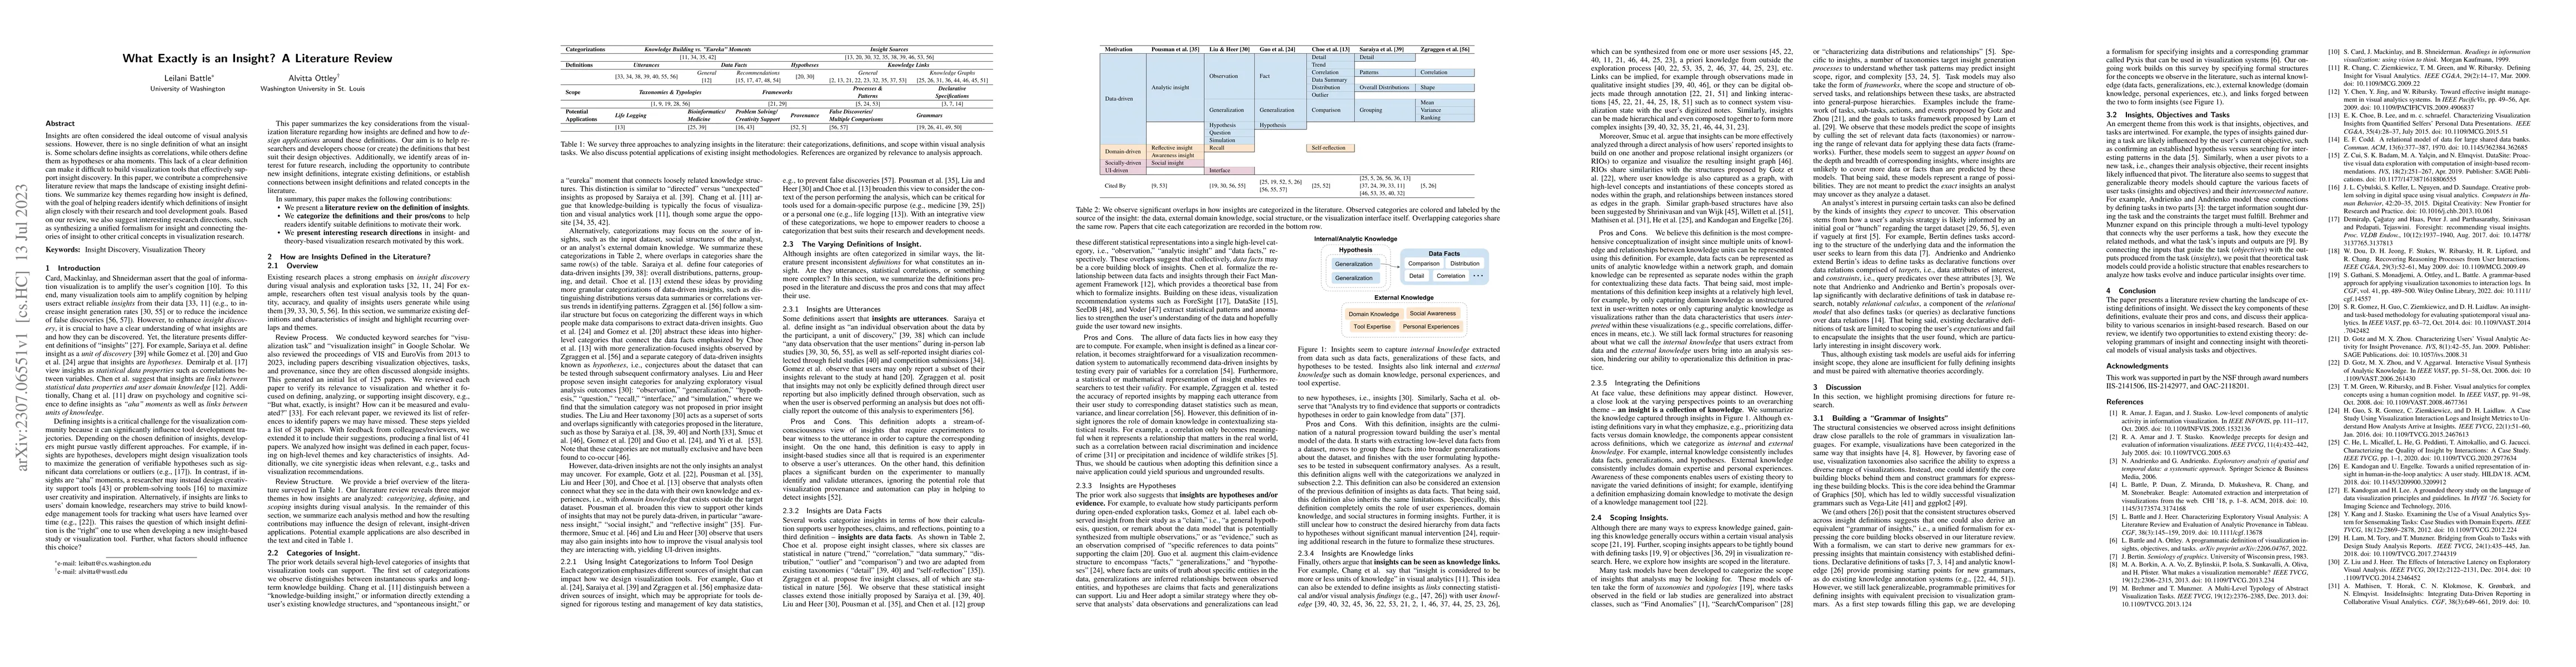
Insights are often considered the ideal outcome of visual analysis sessions. However, there is no single definition of what an insight is. Some scholars define insights as correlations, while others...
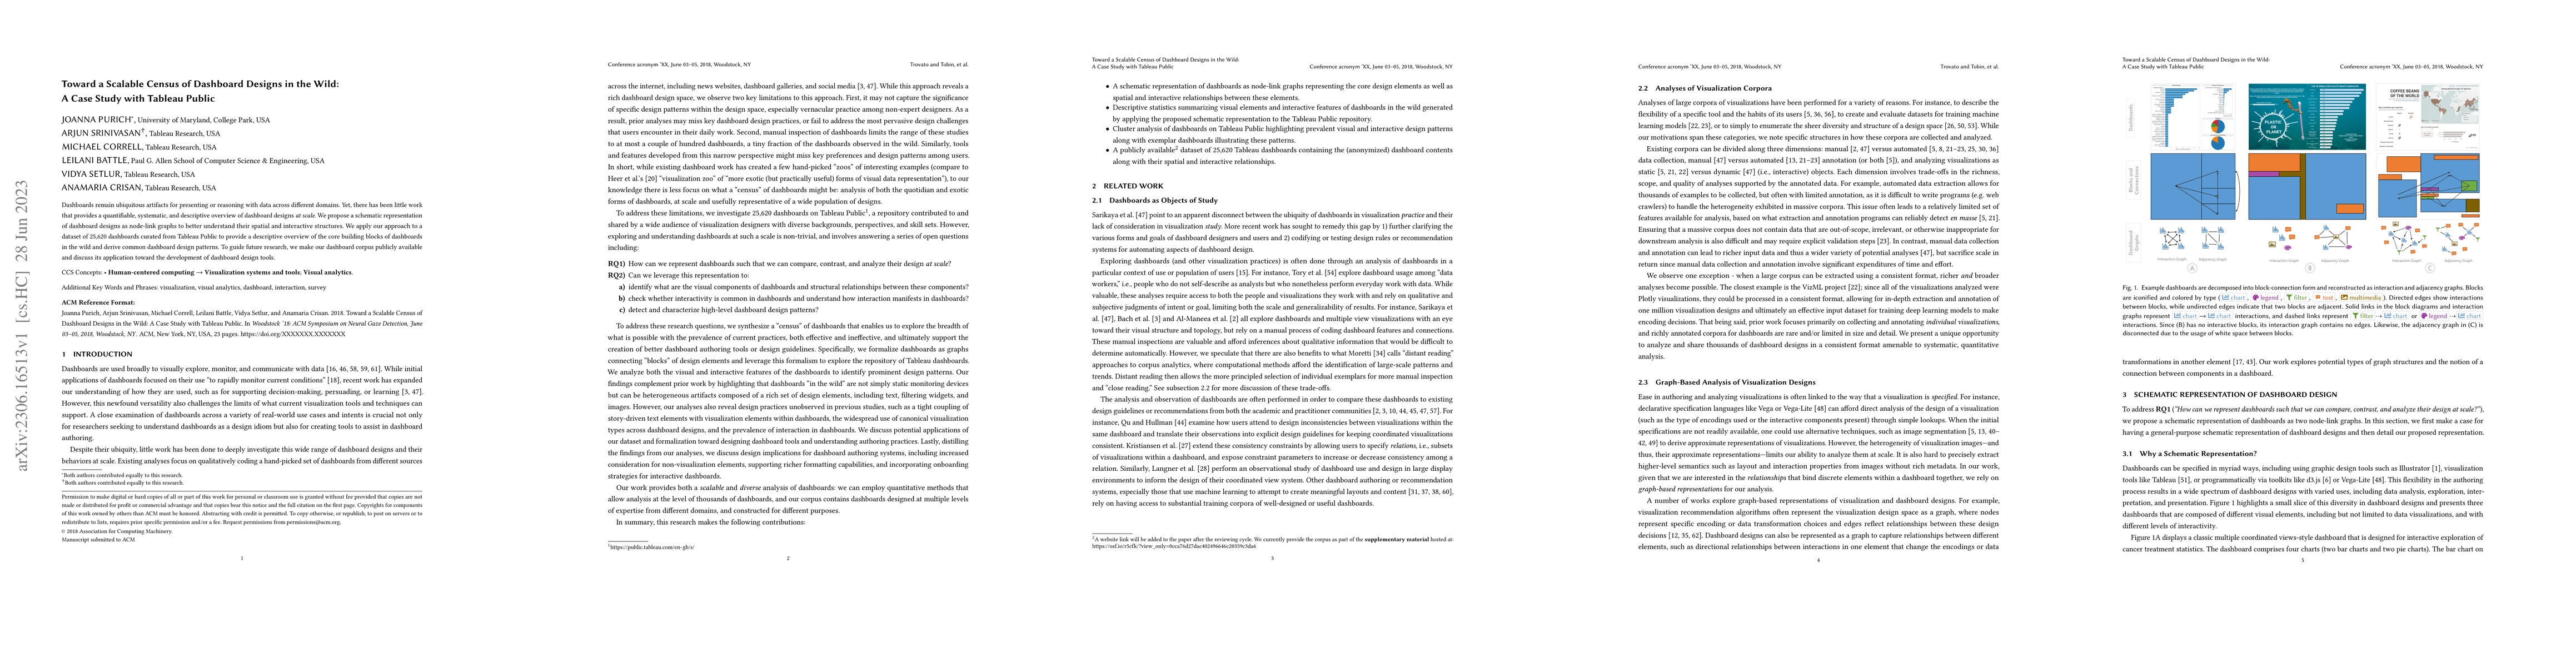
Dashboards remain ubiquitous artifacts for presenting or reasoning with data across different domains. Yet, there has been little work that provides a quantifiable, systematic, and descriptive overv...
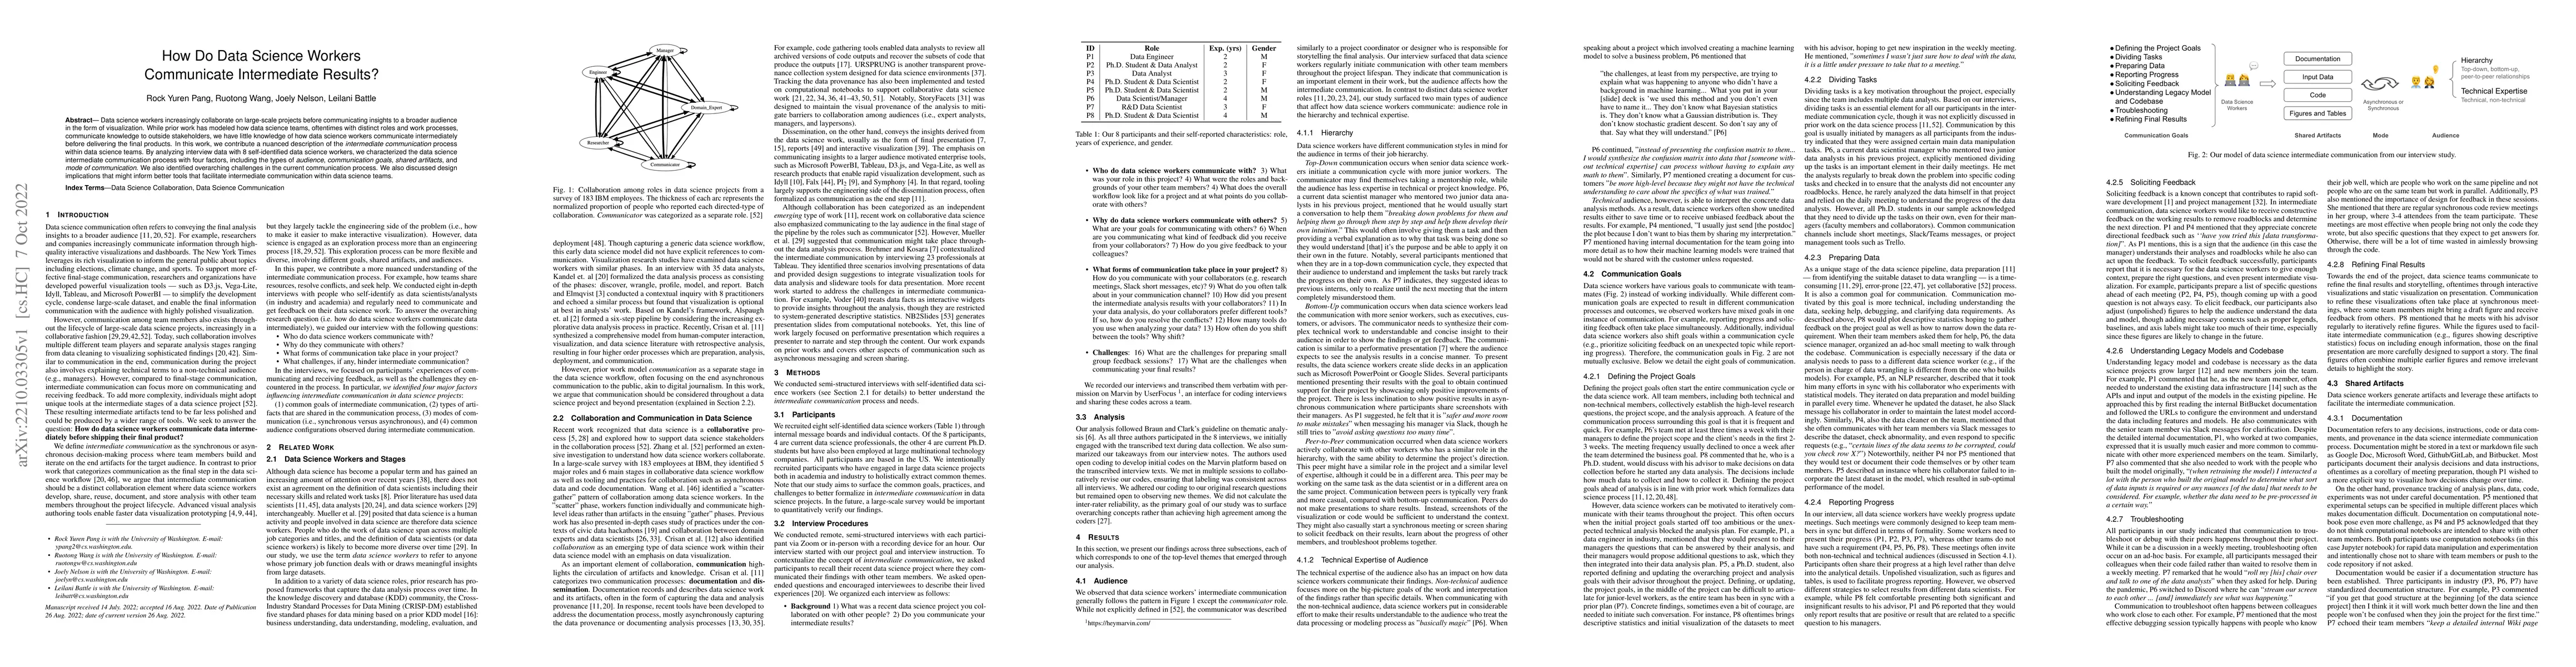
Data science workers increasingly collaborate on large-scale projects before communicating insights to a broader audience in the form of visualization. While prior work has modeled how data science ...
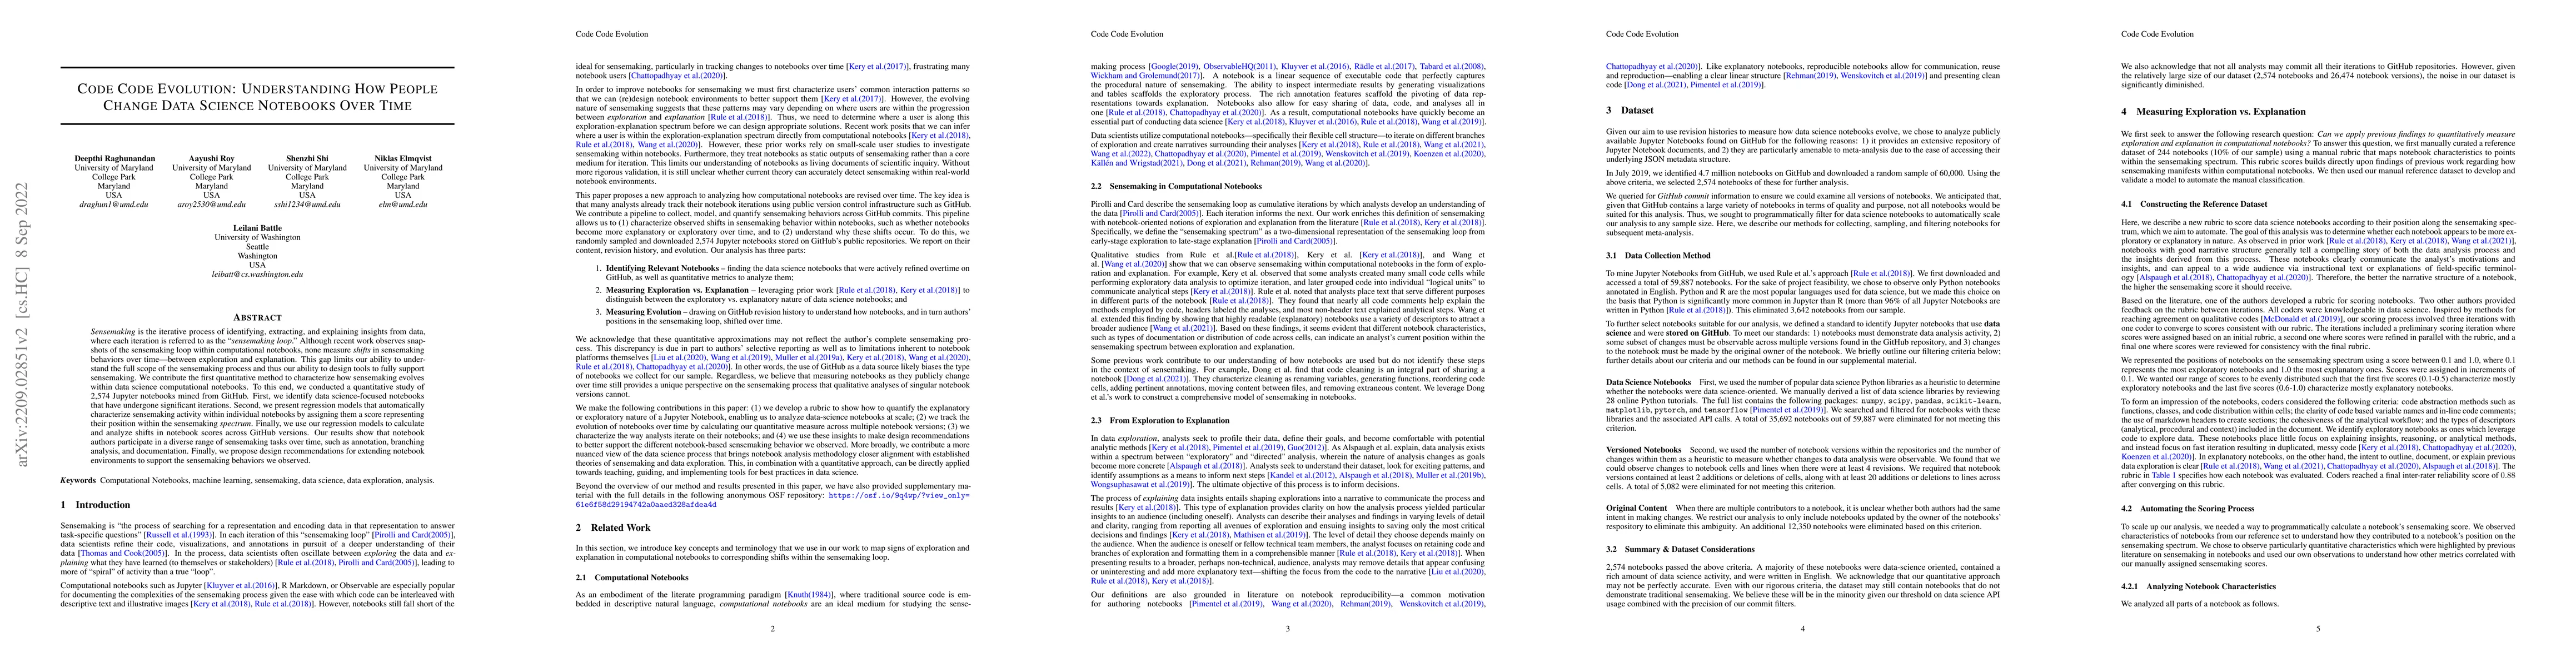
Sensemaking is the iterative process of identifying, extracting, and explaining insights from data, where each iteration is referred to as the "sensemaking loop." Although recent work observes snaps...
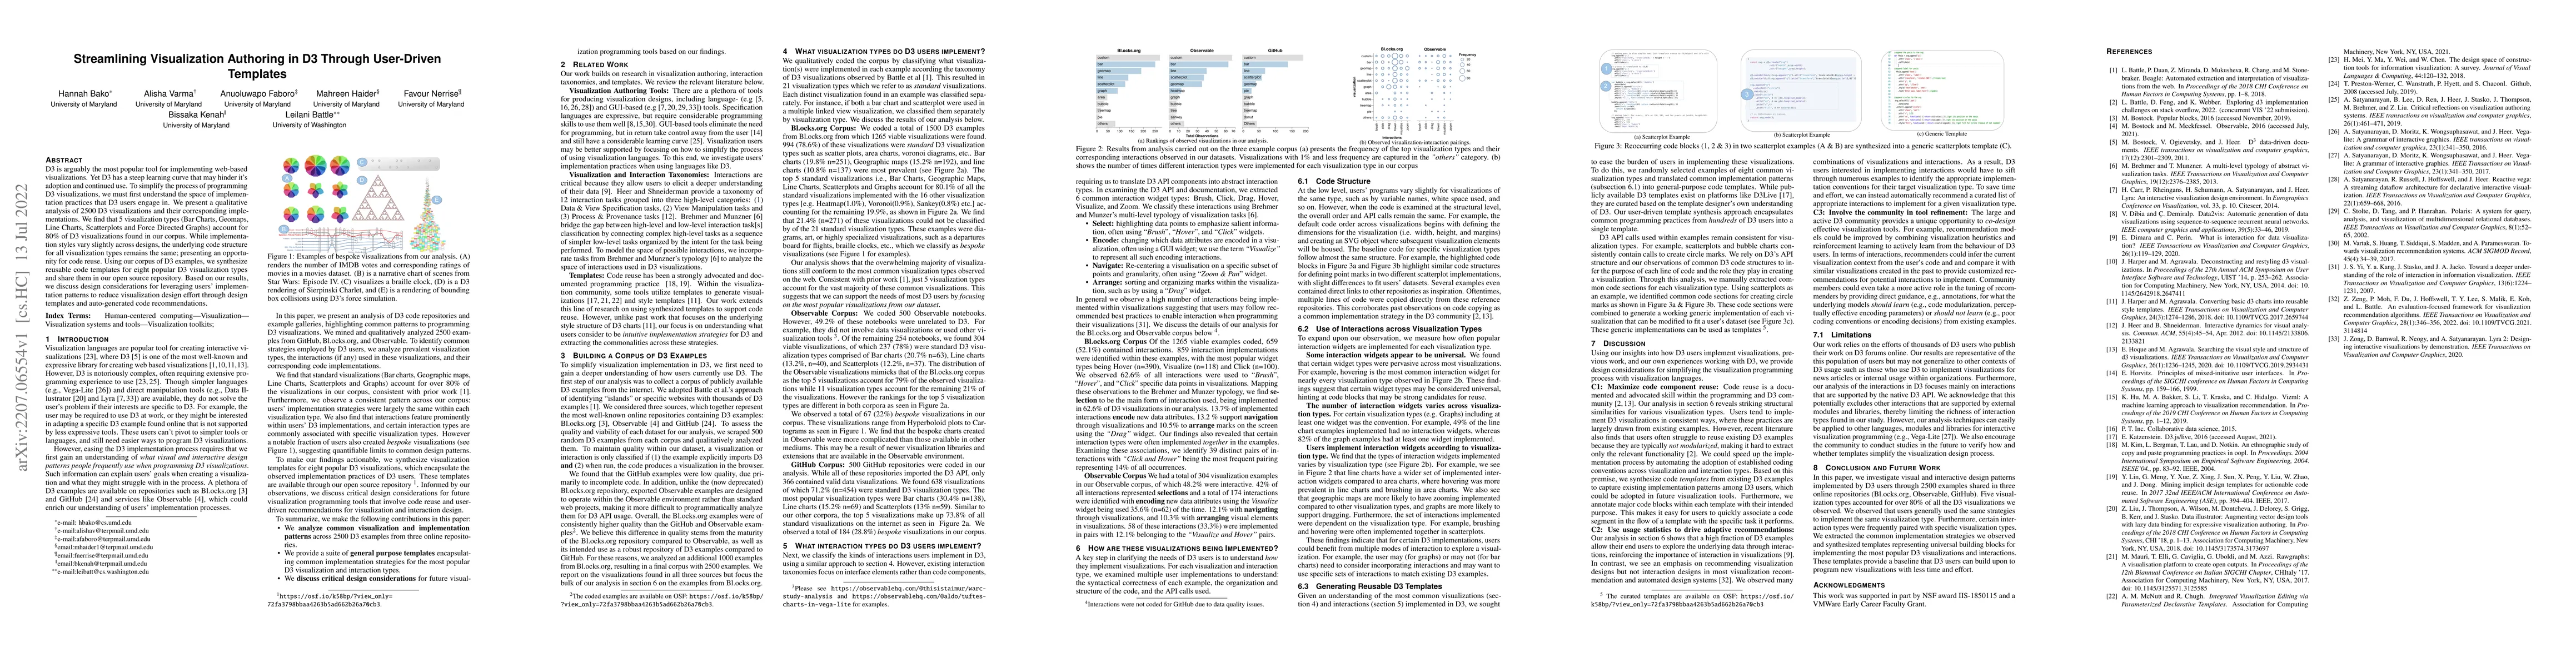
D3 is arguably the most popular tool for implementing web based visualizations. Yet D3 has a steep learning curve that may hinder its adoption and continued use. To simplify the process of programmi...
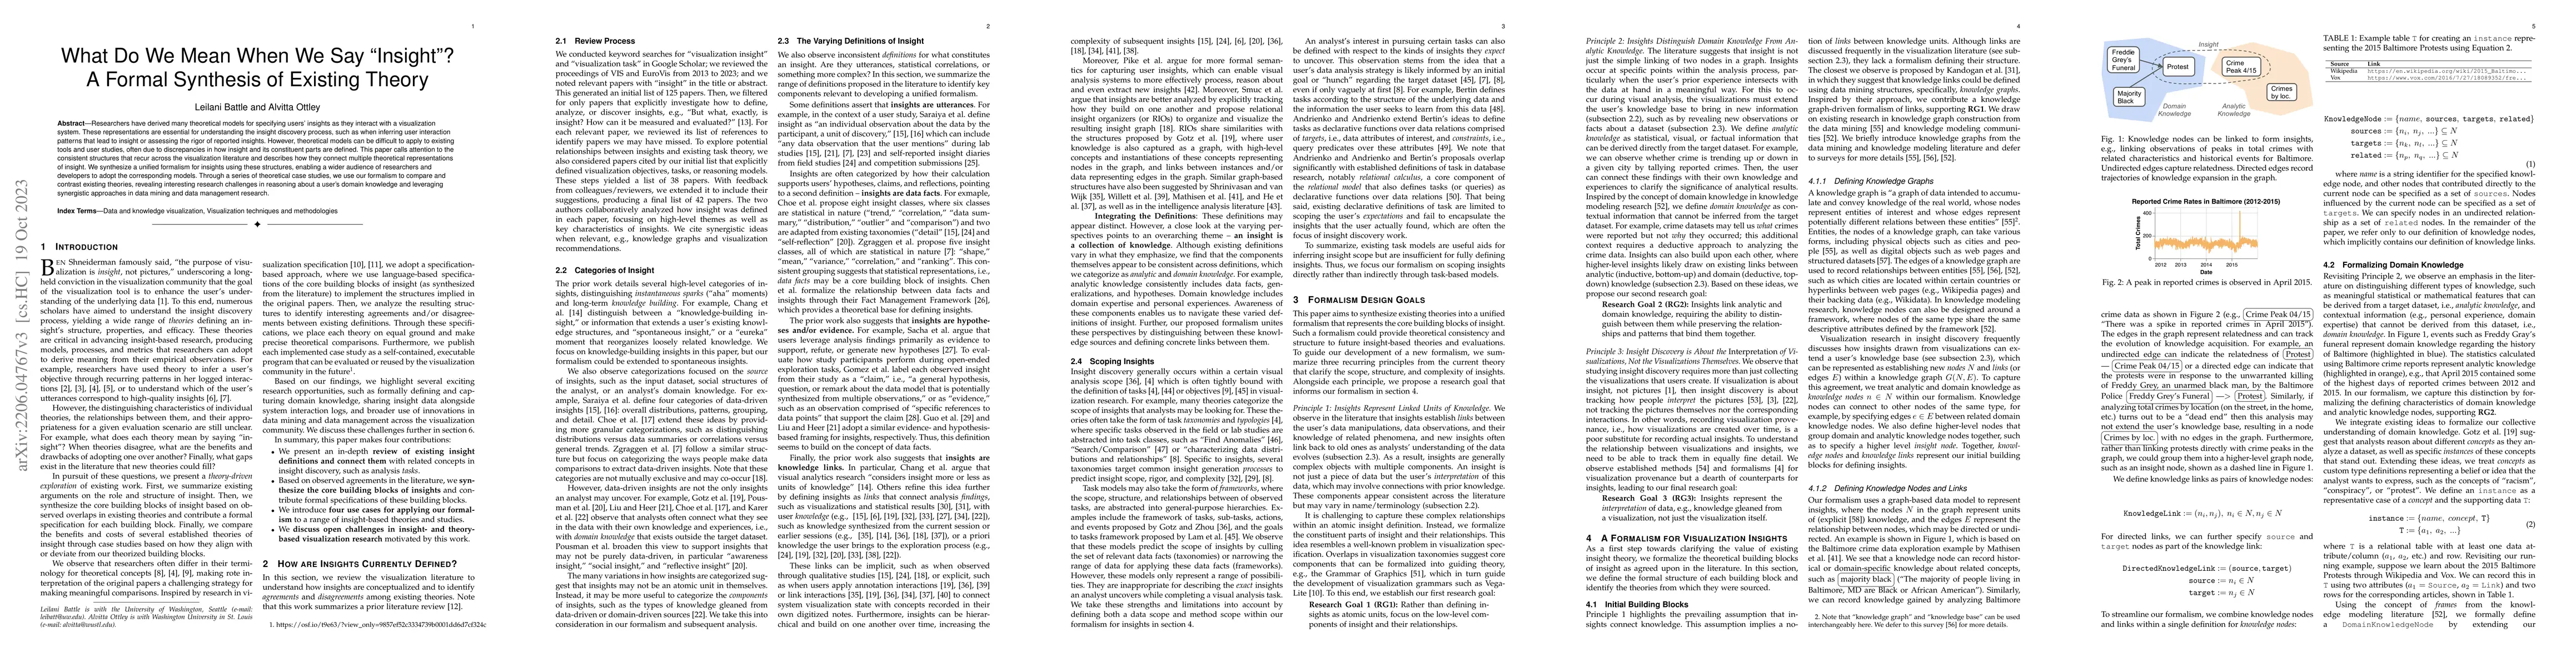
Researchers have derived many theoretical models for specifying users' insights as they interact with a visualization system. These representations are essential for understanding the insight discov...
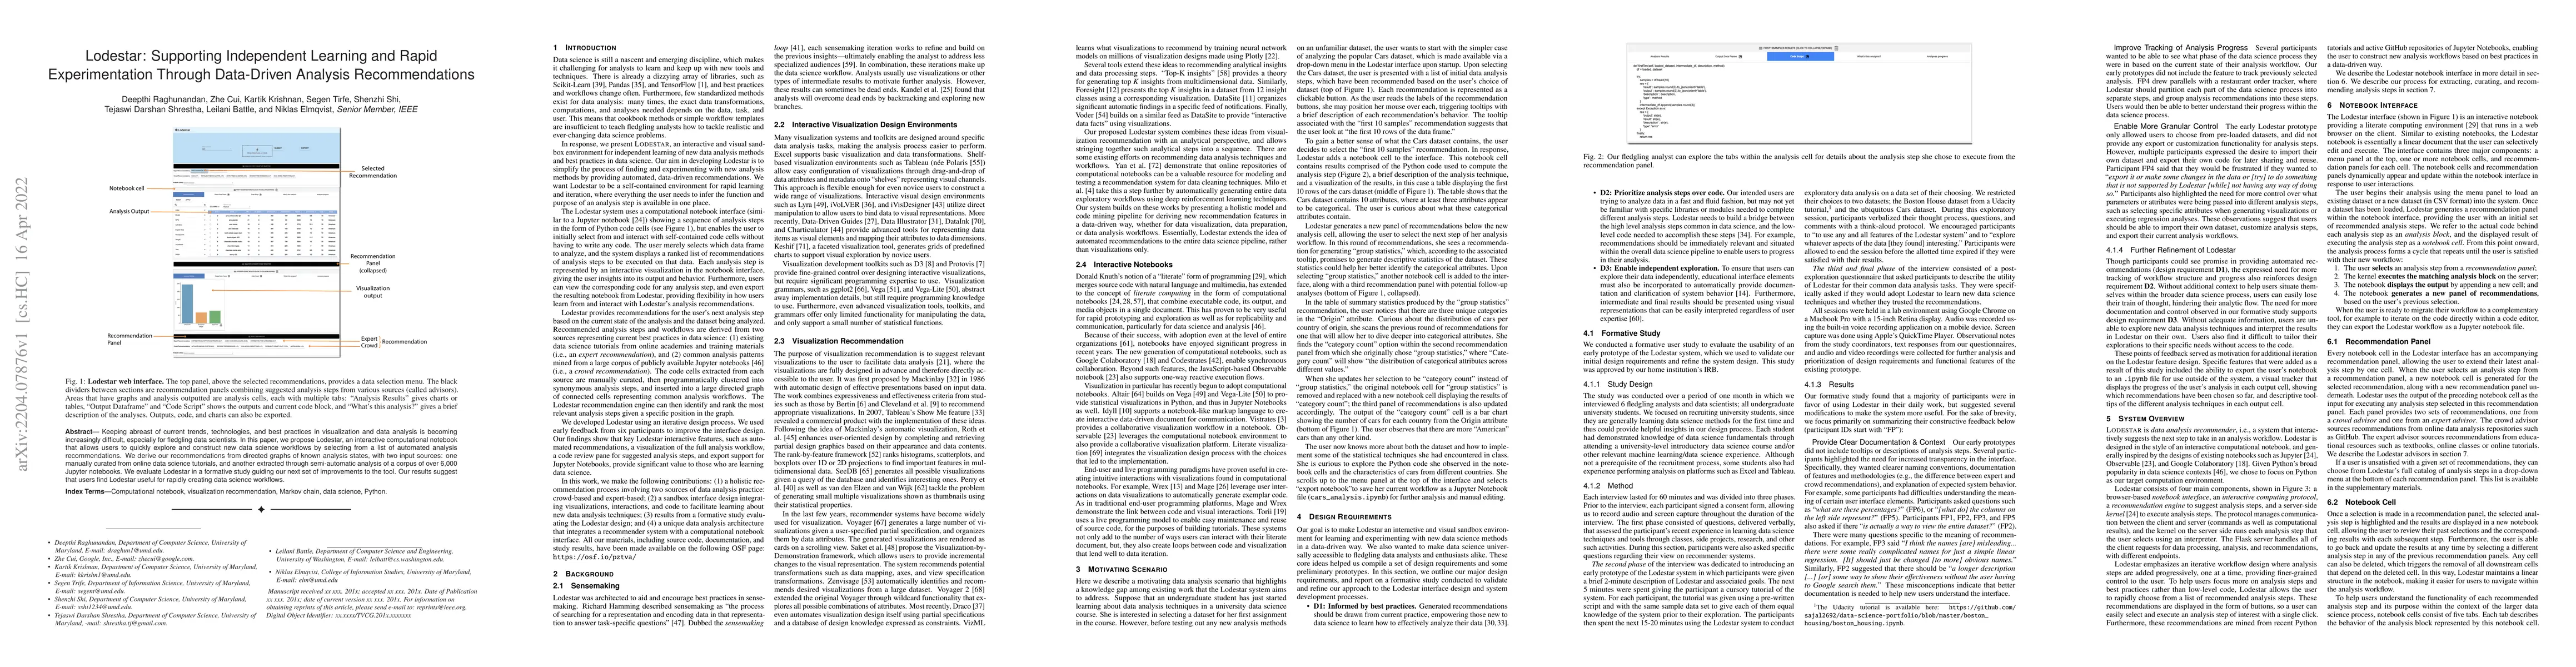
Keeping abreast of current trends, technologies, and best practices in visualization and data analysis is becoming increasingly difficult, especially for fledgling data scientists. In this paper, we...
Interactive analysis systems provide efficient and accessible means by which users of varying technical experience can comfortably manipulate and analyze data using interactive widgets. Widgets are ...
The promise of visualization recommendation systems is that analysts will be automatically provided with relevant and high-quality visualizations that will reduce the work of manual exploration or c...
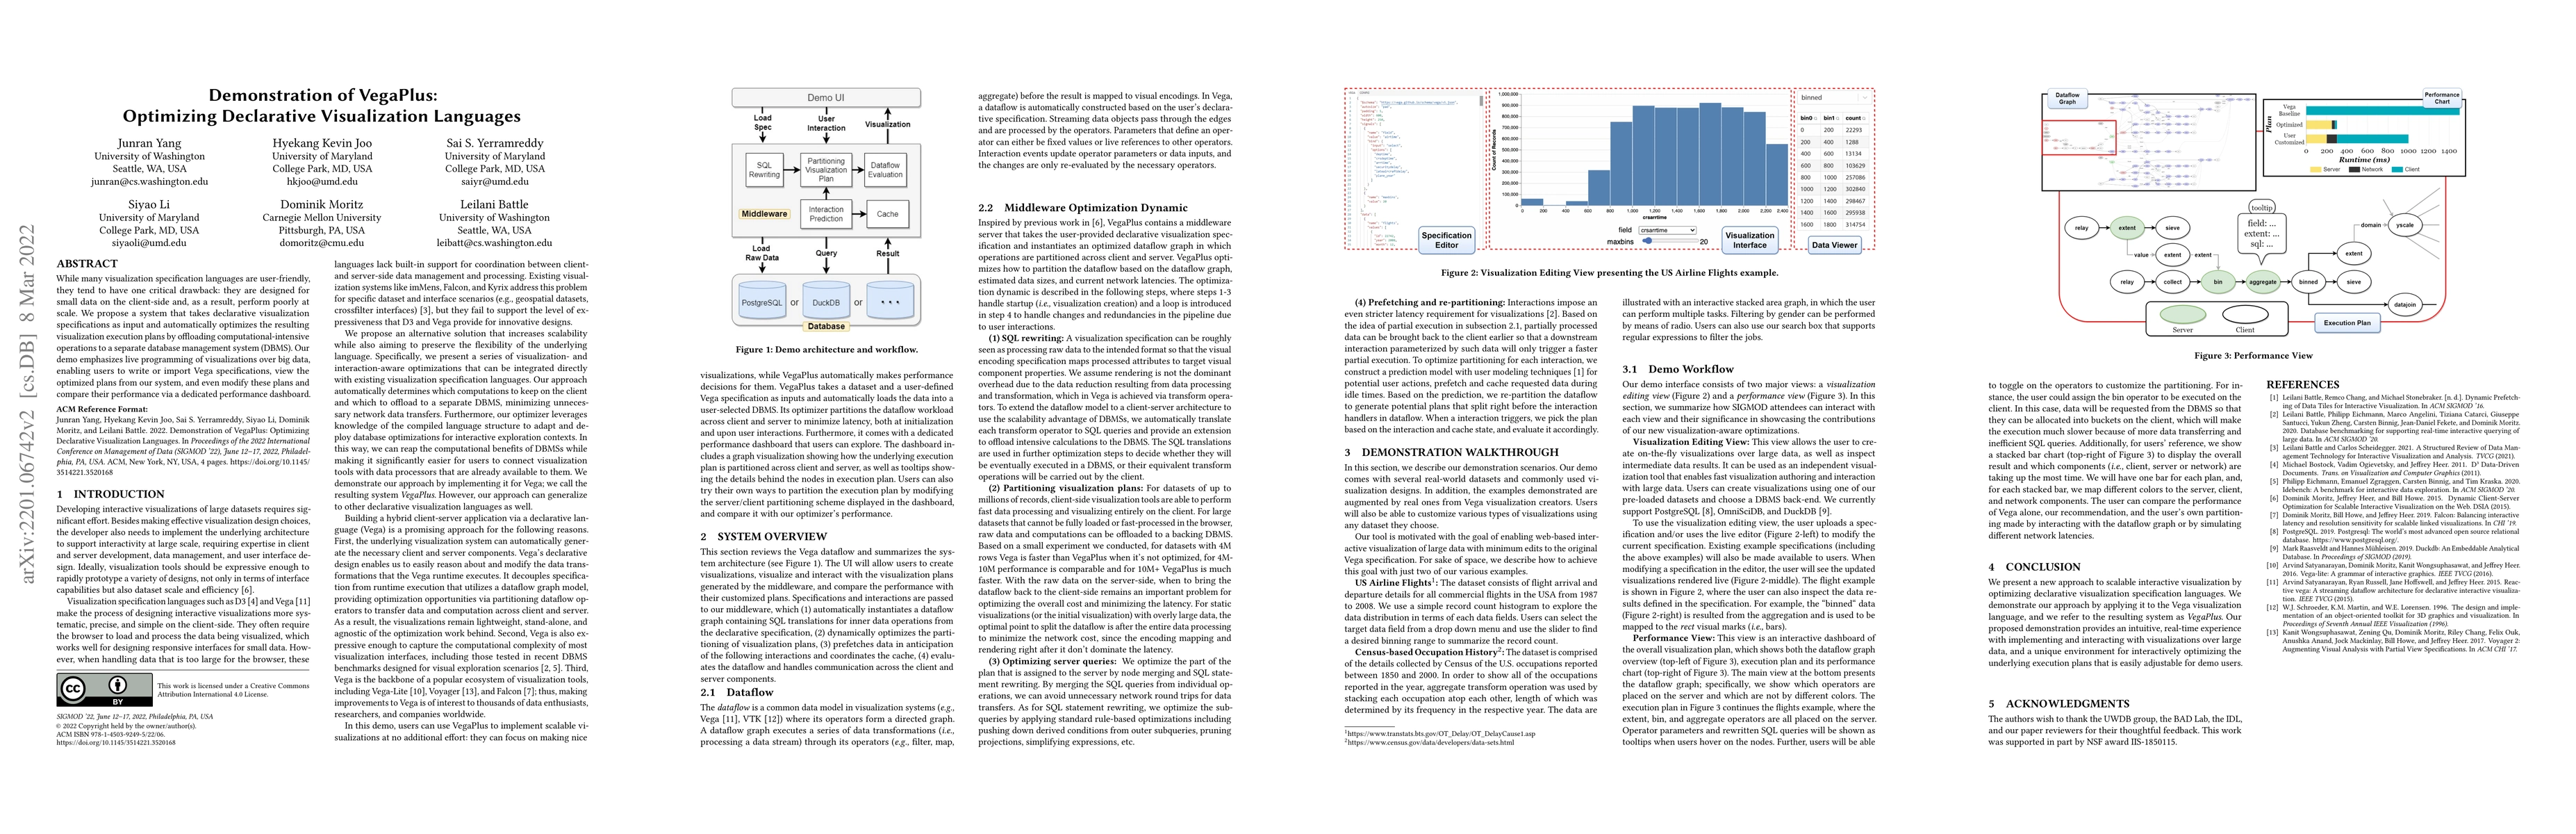
While many visualization specification languages are user-friendly, they tend to have one critical drawback: they are designed for small data on the client-side and, as a result, perform poorly at s...
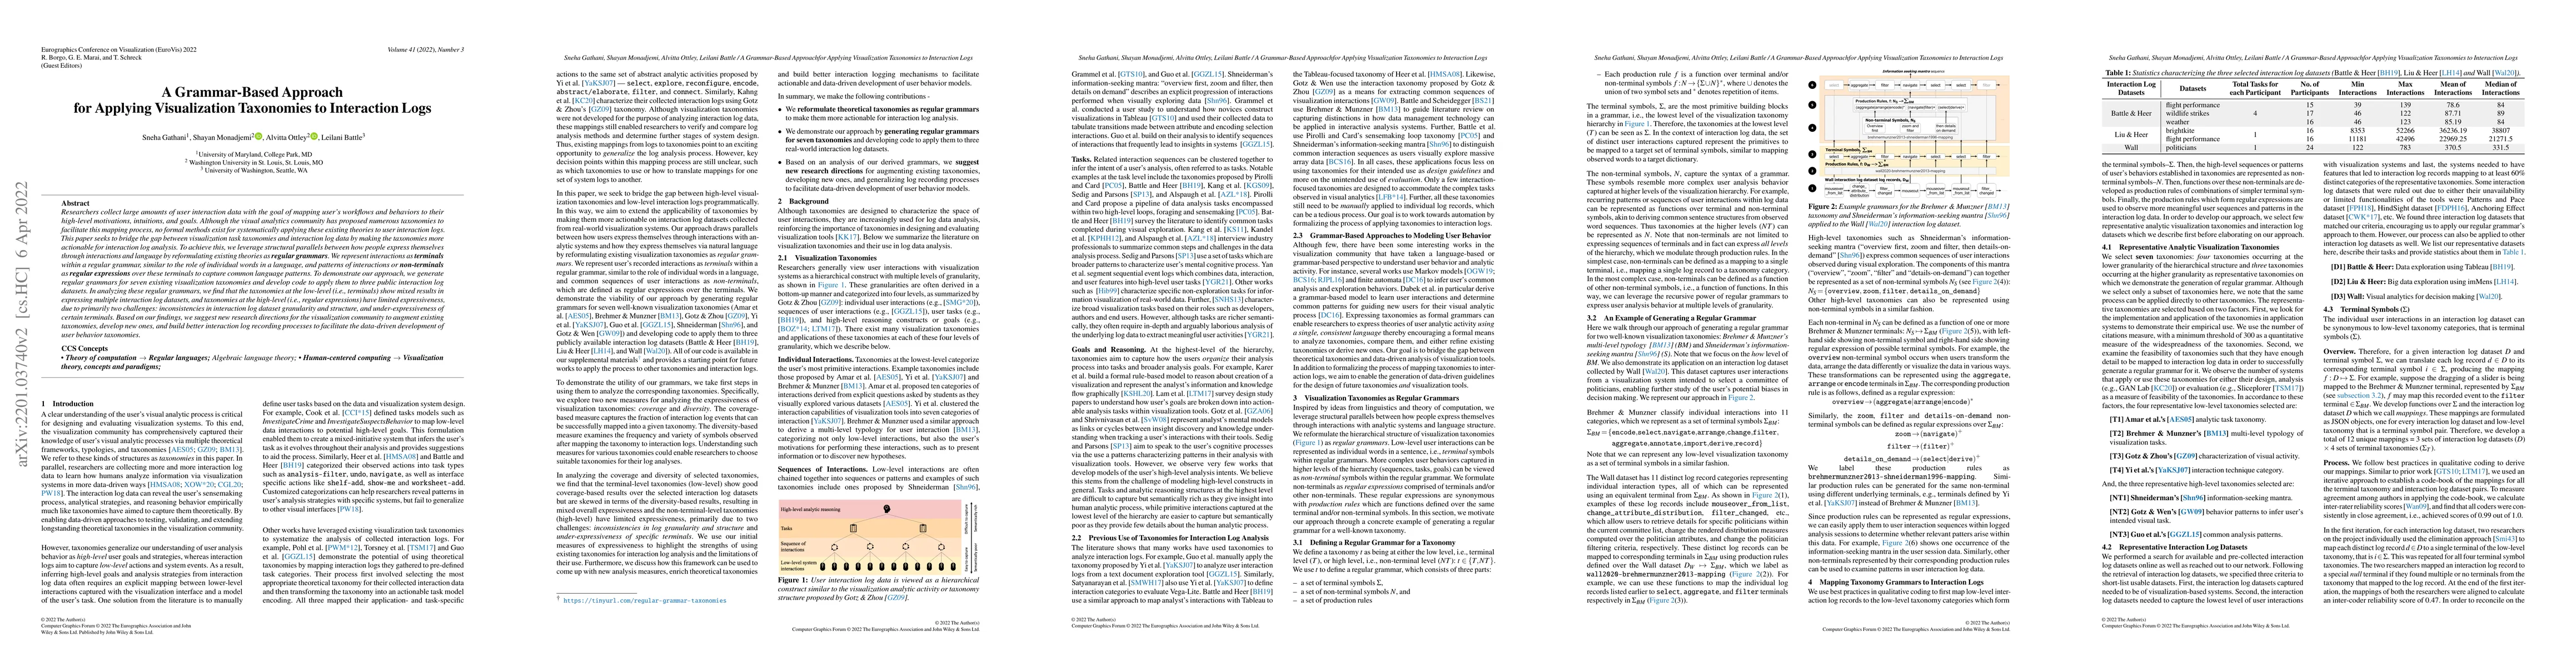
Researchers collect large amounts of user interaction data with the goal of mapping user's workflows and behaviors to their higher-level motivations, intuitions, and goals. Although the visual analy...
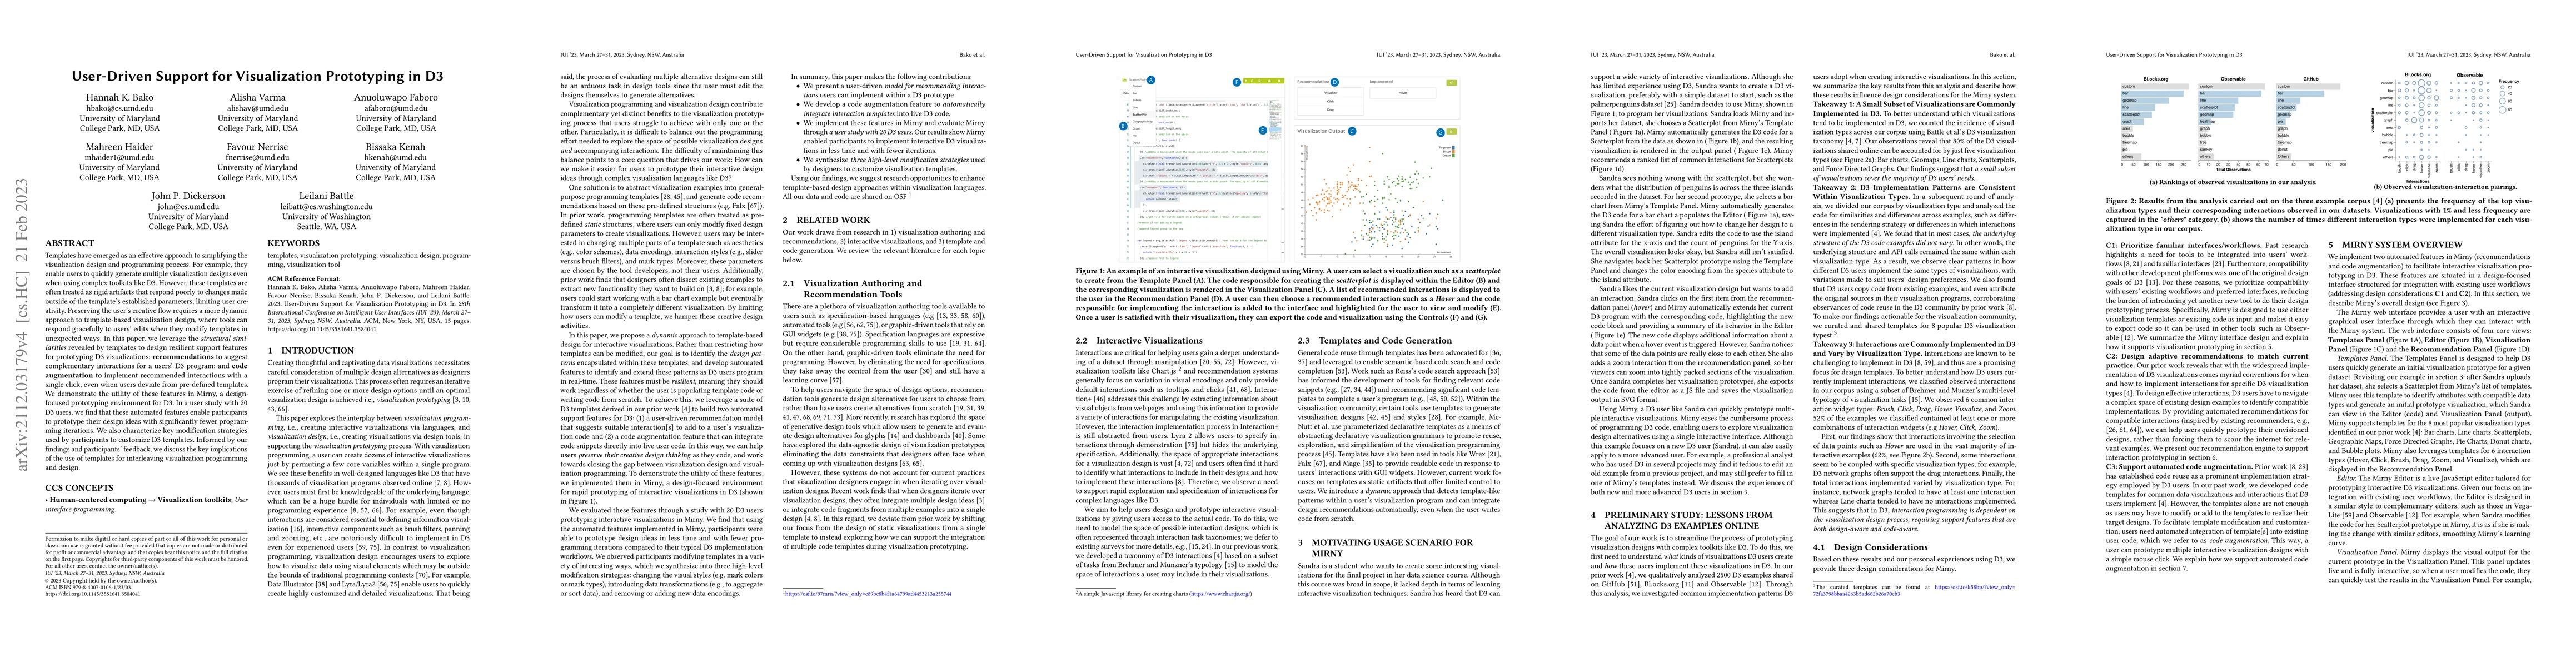
Templates have emerged as an effective approach to simplifying the visualization design and programming process. For example, they enable users to quickly generate multiple visualization designs eve...
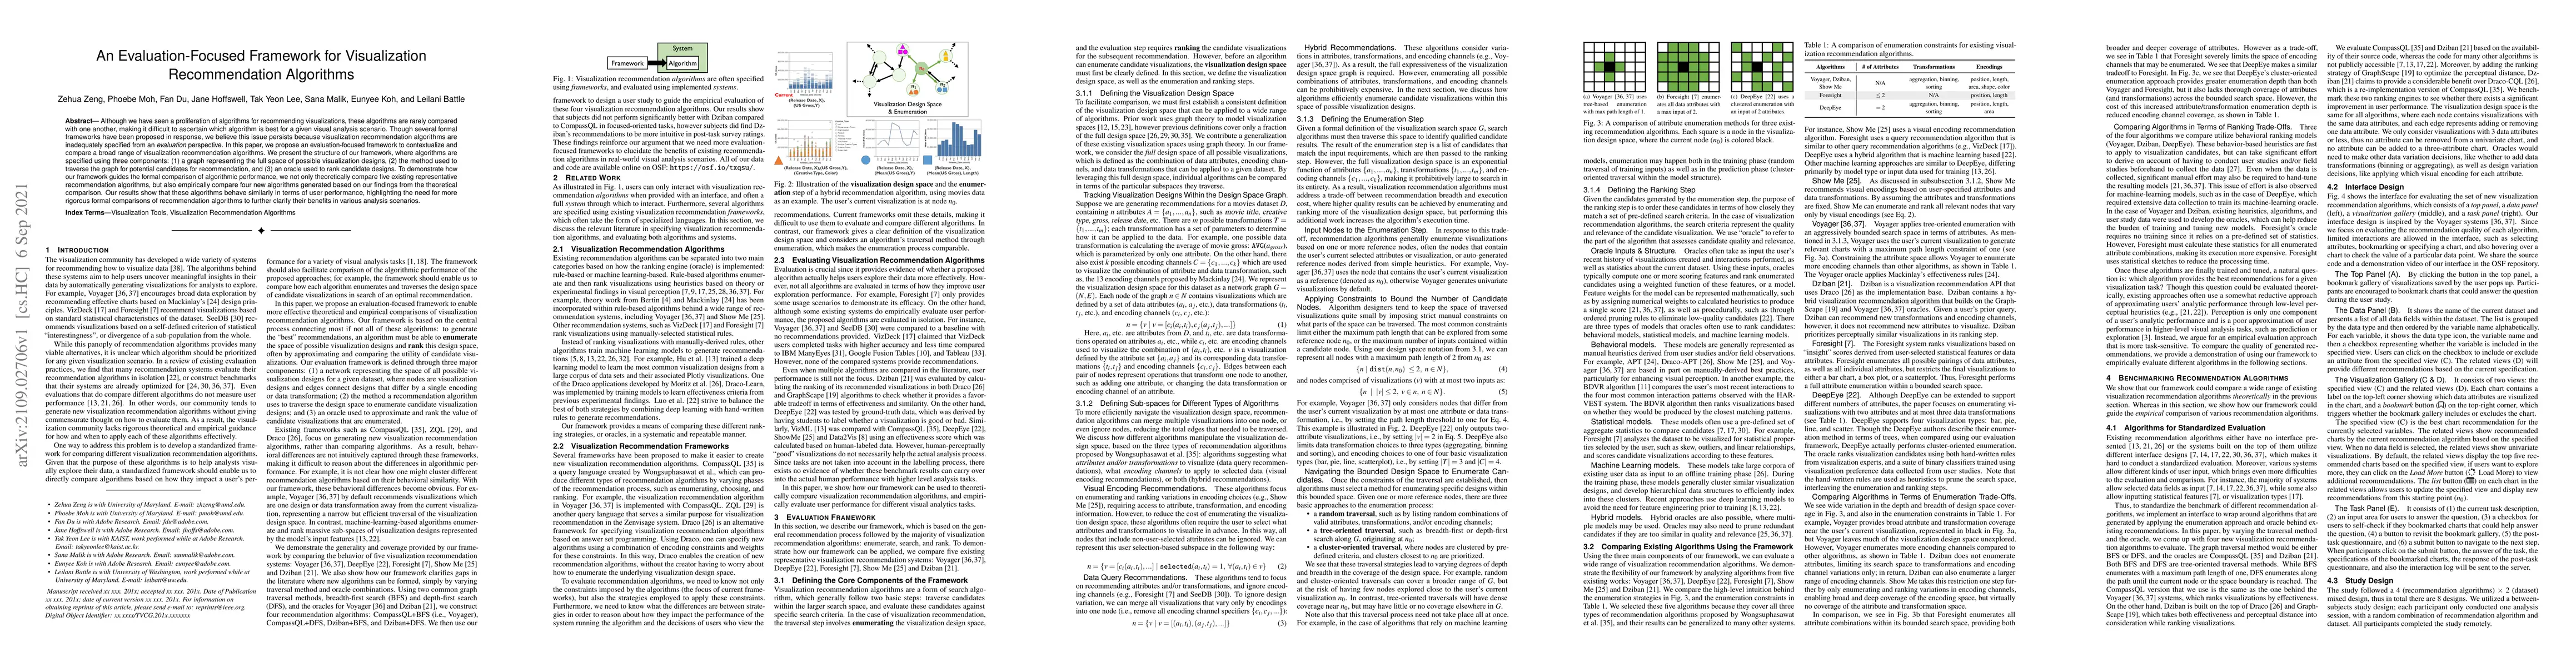
Although we have seen a proliferation of algorithms for recommending visualizations, these algorithms are rarely compared with one another, making it difficult to ascertain which algorithm is best f...
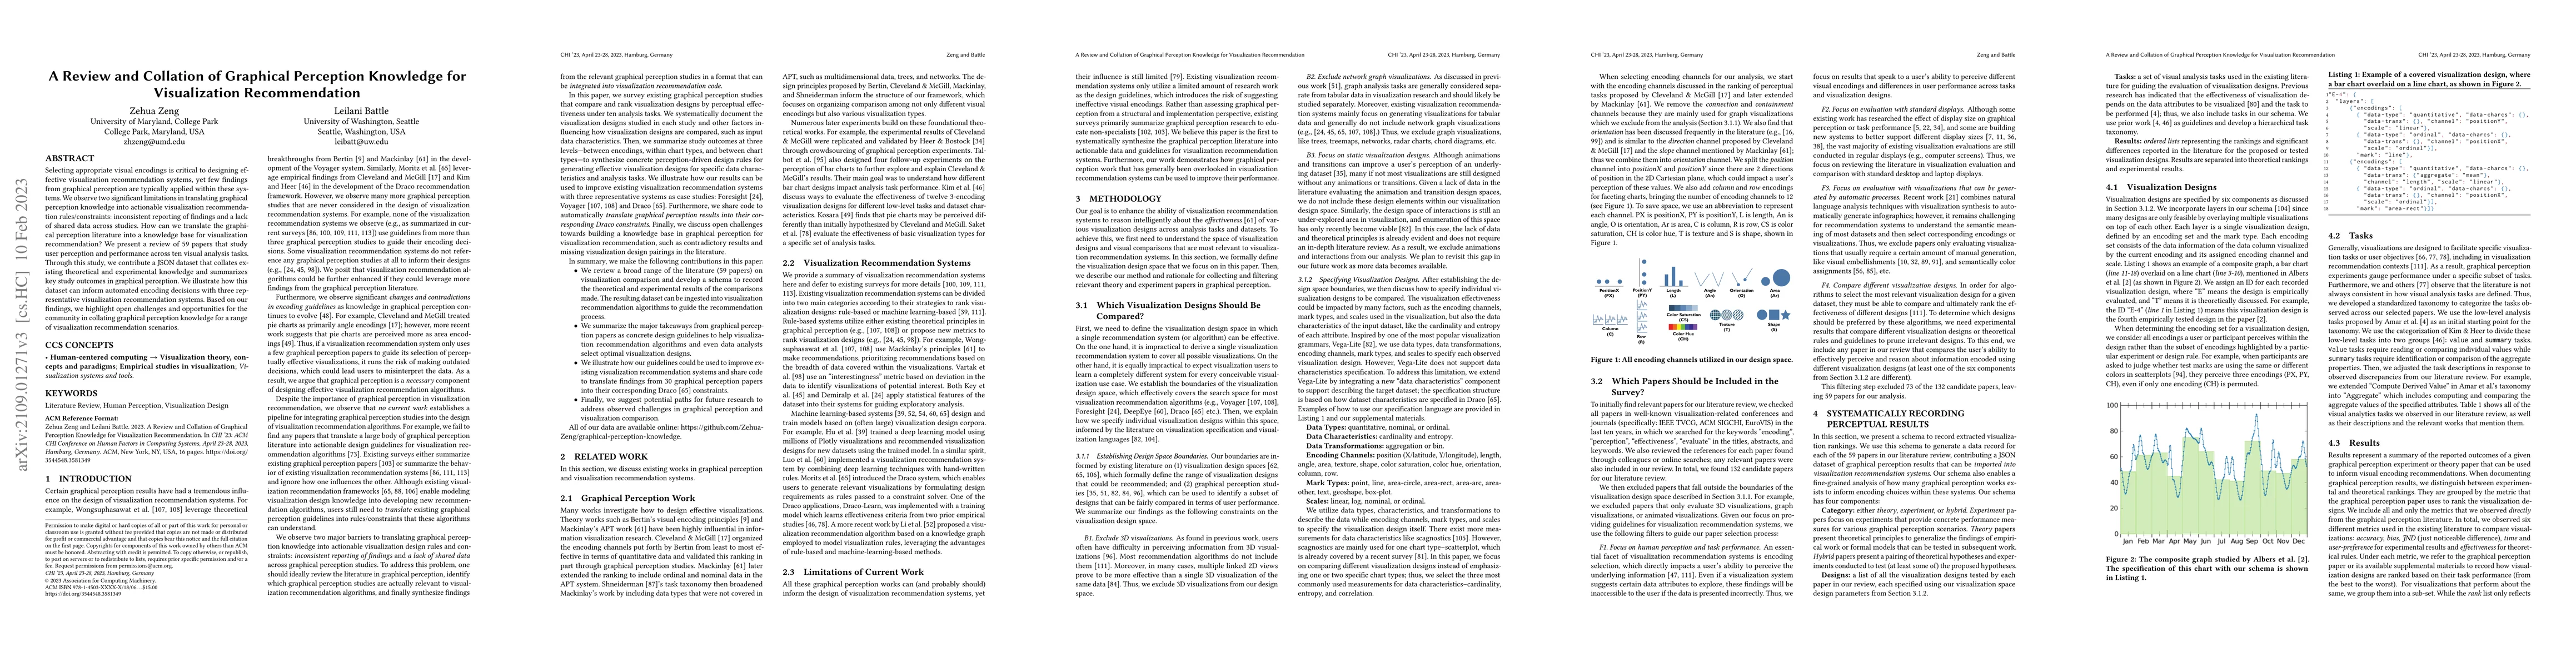
Selecting appropriate visual encodings is critical to designing effective visualization recommendation systems, yet few findings from graphical perception are typically applied within these systems....
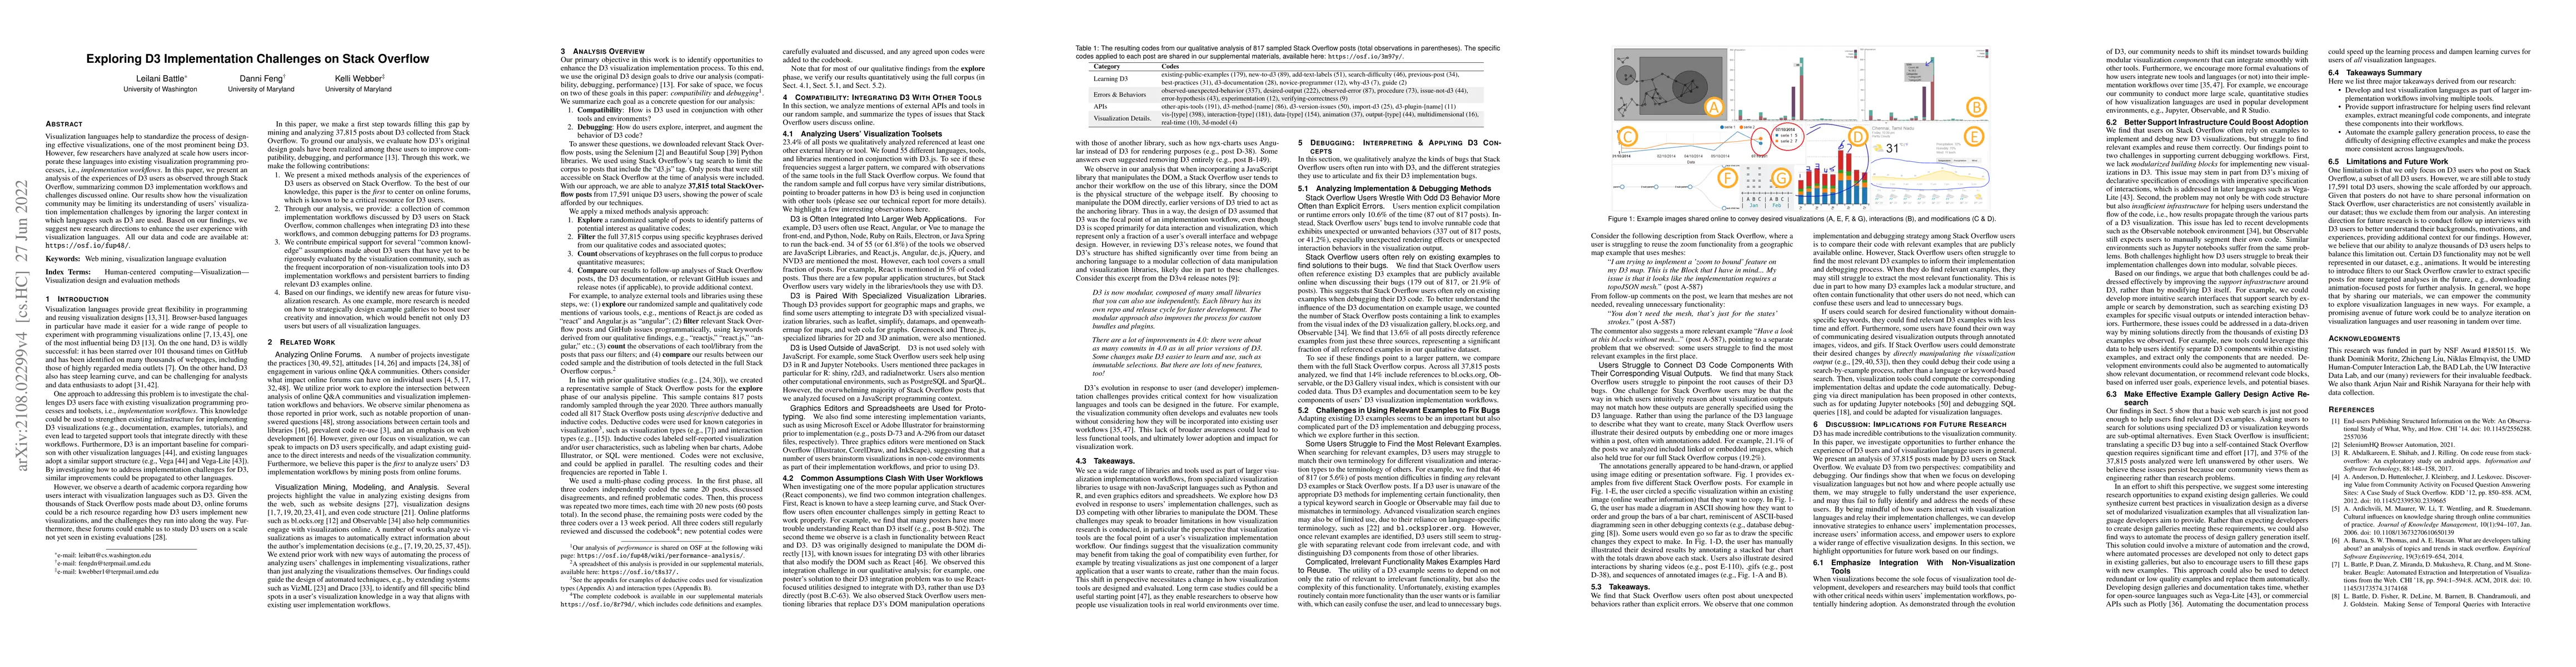
Visualization languages help to standardize the process of designing effective visualizations, one of the most prominent being D3. However, few researchers have analyzed at scale how users incorpora...
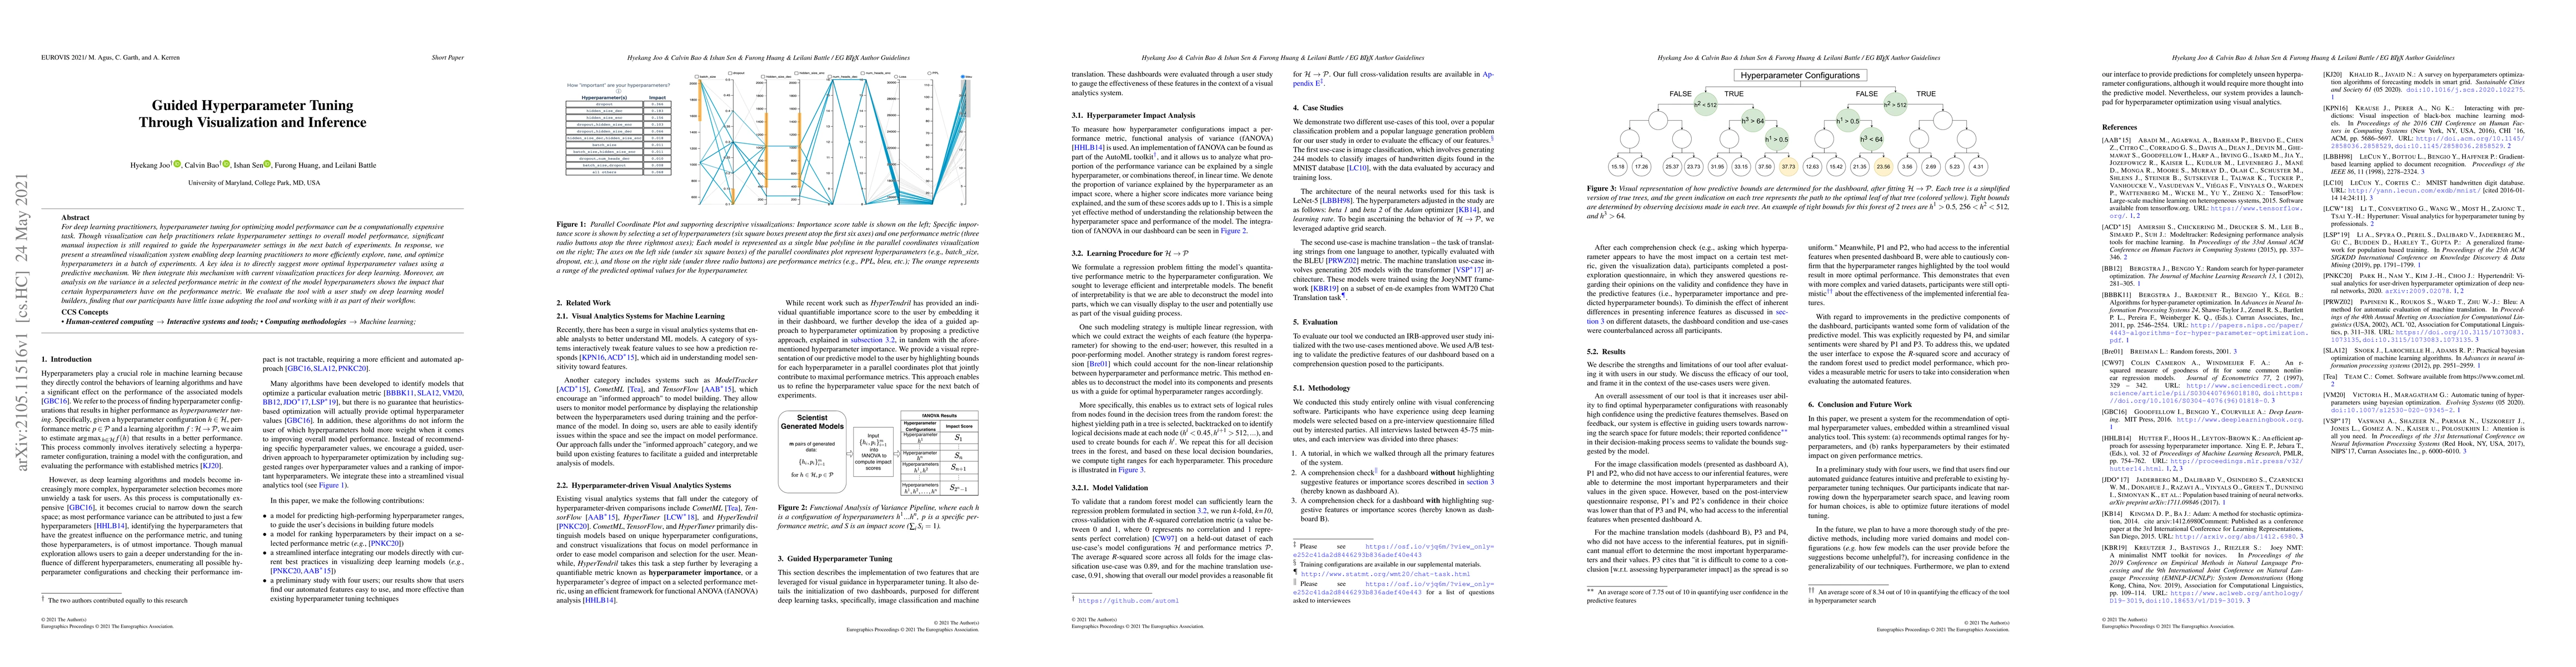
For deep learning practitioners, hyperparameter tuning for optimizing model performance can be a computationally expensive task. Though visualization can help practitioners relate hyperparameter set...
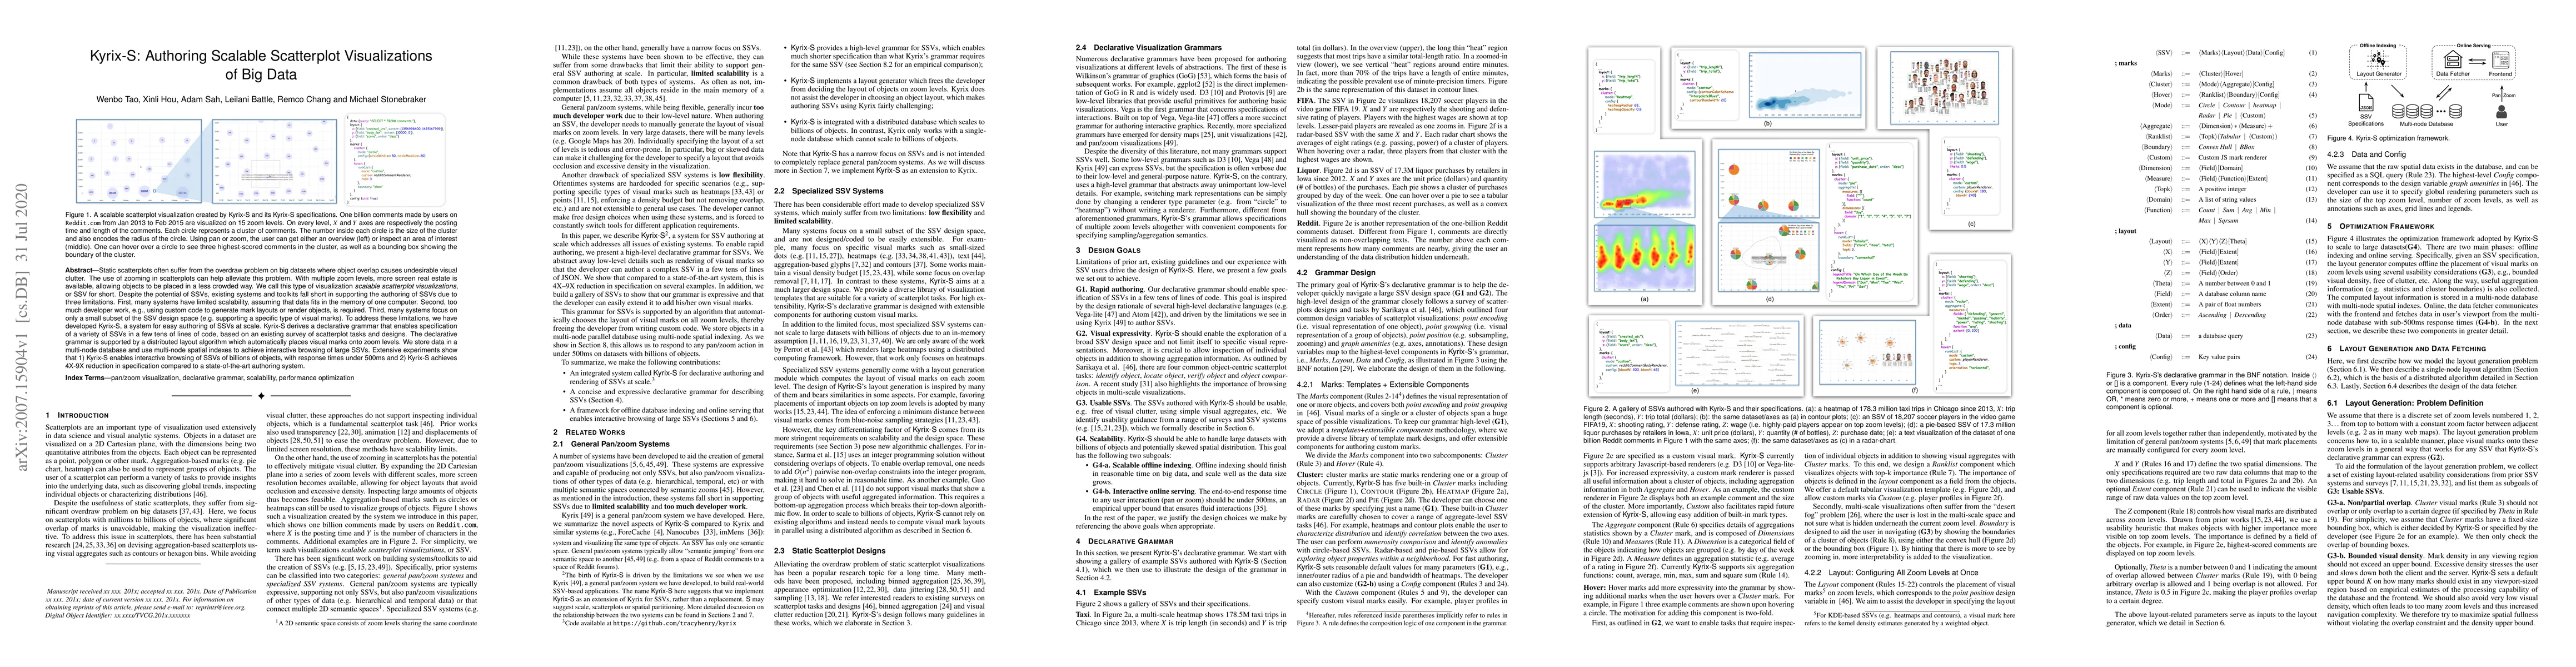
Static scatterplots often suffer from the overdraw problem on big datasets where object overlap causes undesirable visual clutter. The use of zooming in scatterplots can help alleviate this problem....
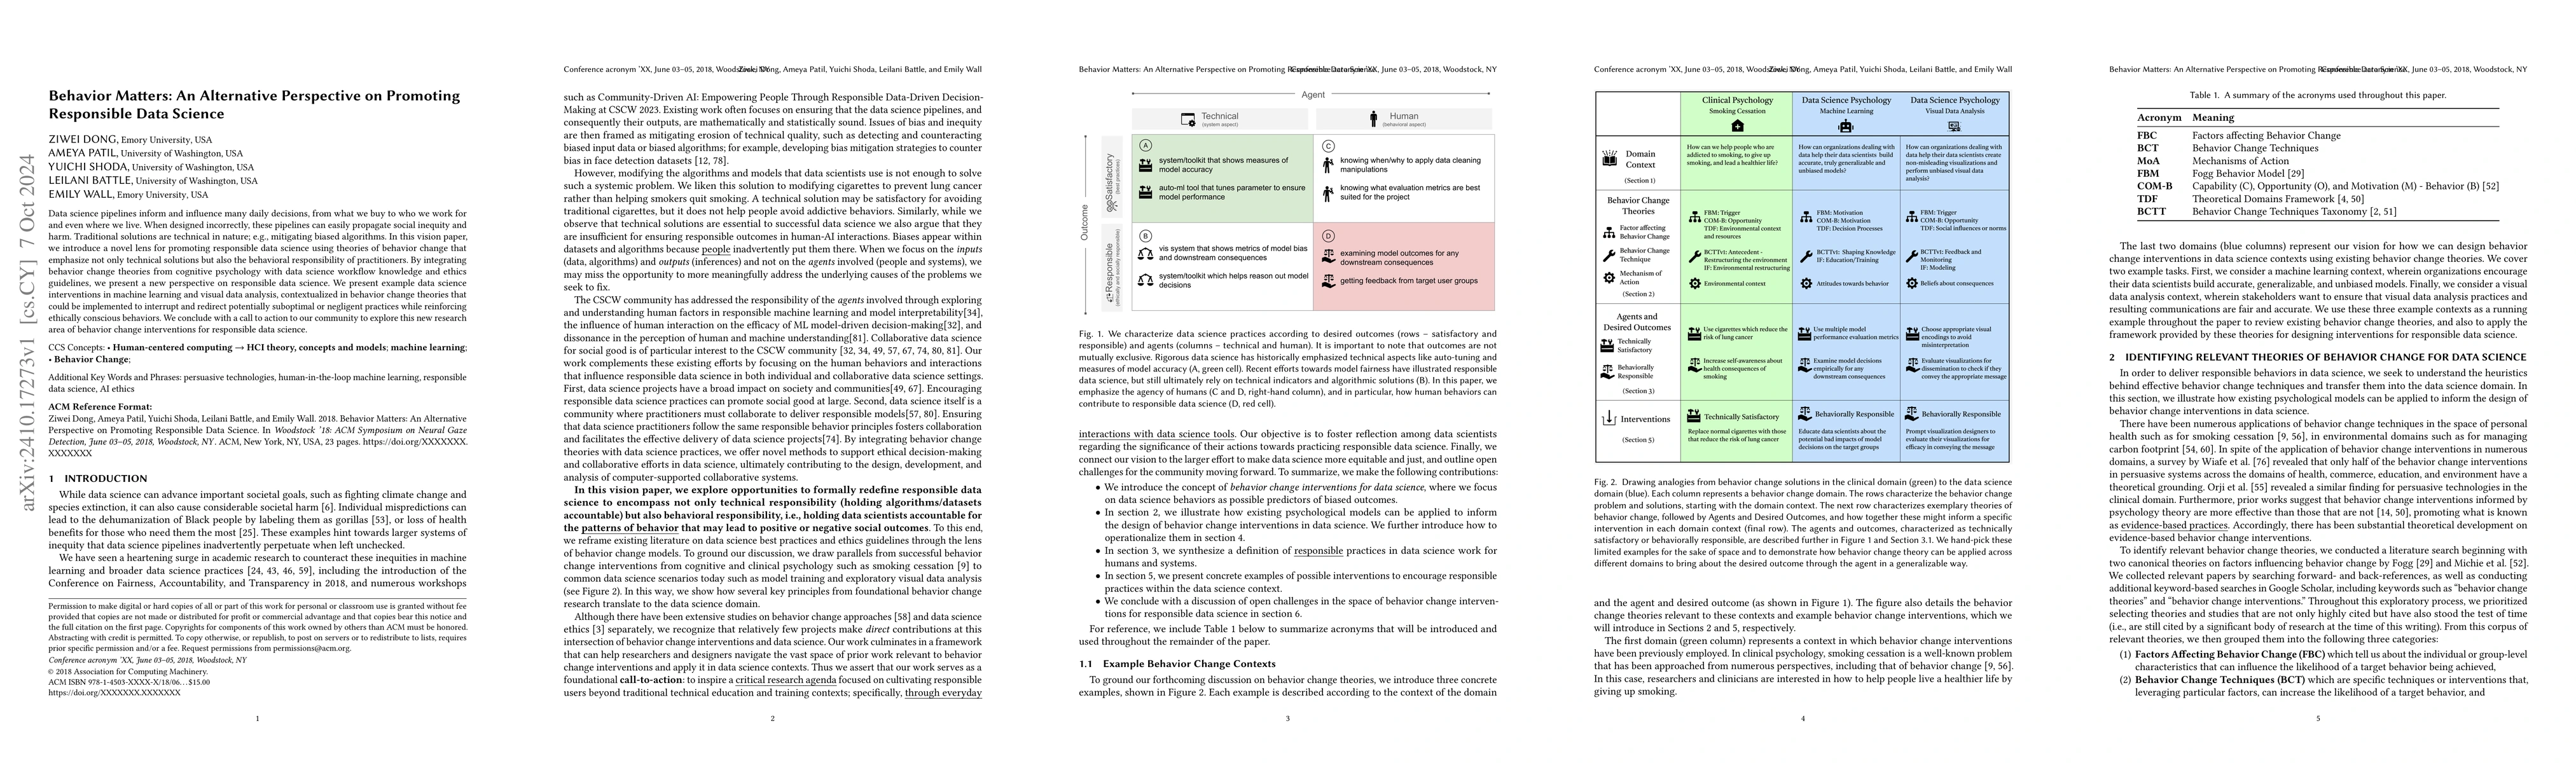
Data science pipelines inform and influence many daily decisions, from what we buy to who we work for and even where we live. When designed incorrectly, these pipelines can easily propagate social ine...
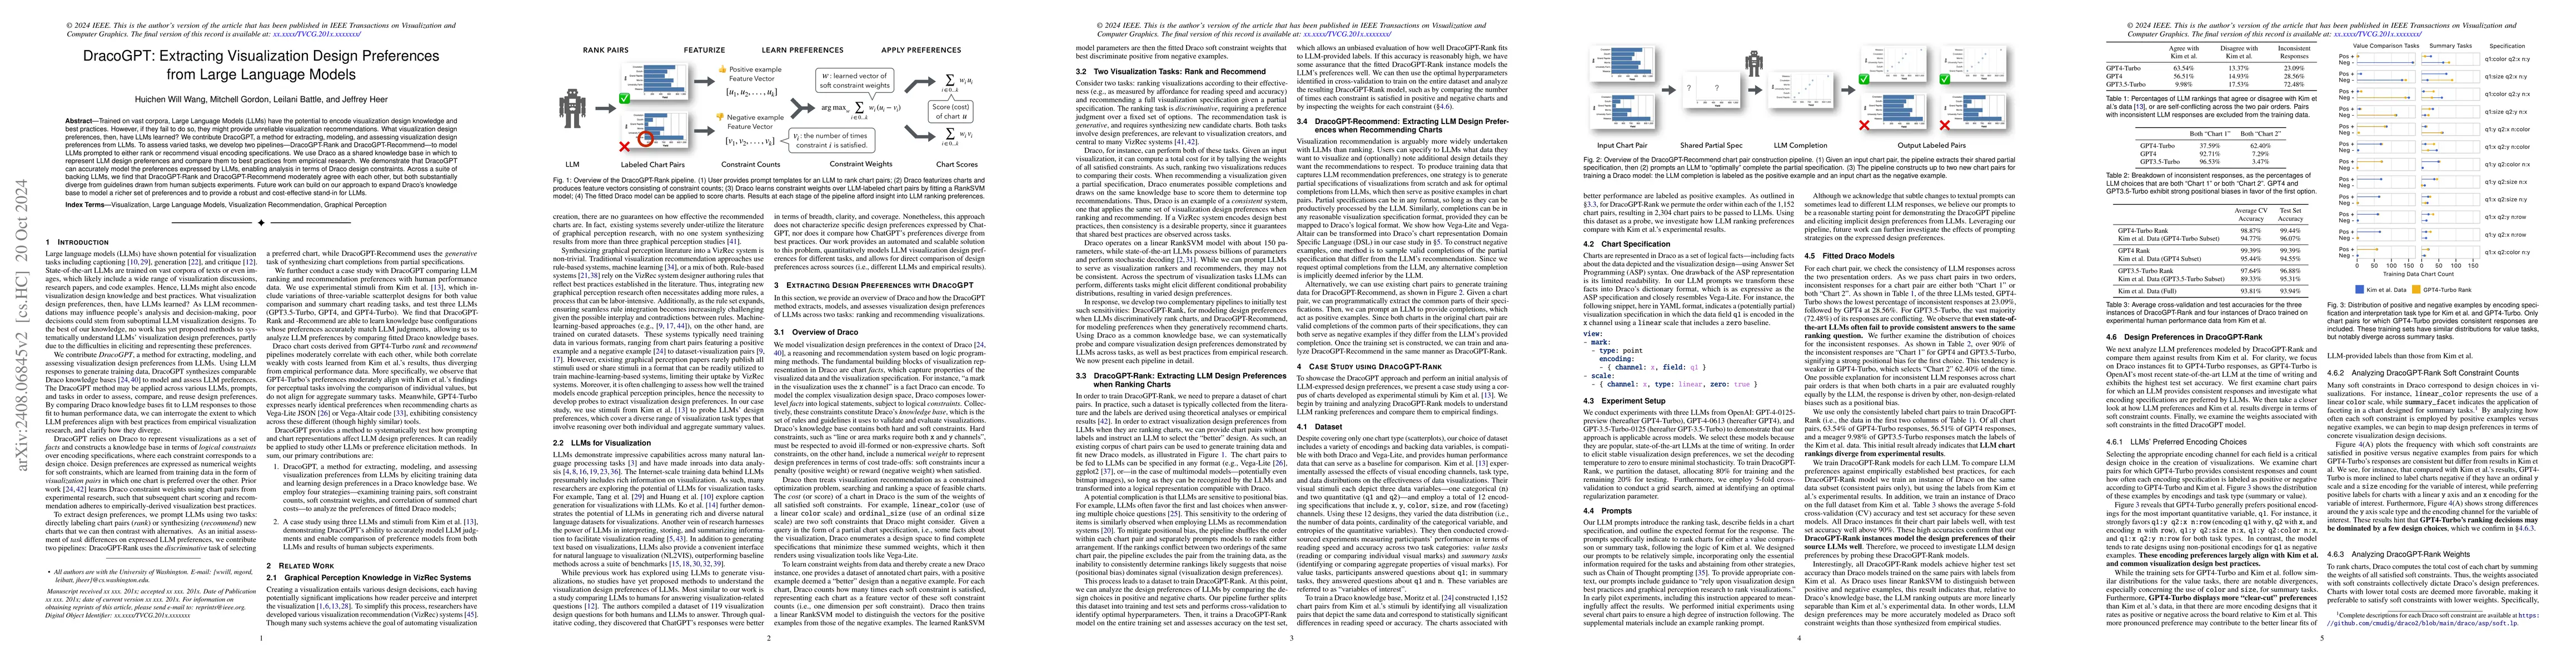
Trained on vast corpora, Large Language Models (LLMs) have the potential to encode visualization design knowledge and best practices. However, if they fail to do so, they might provide unreliable visu...
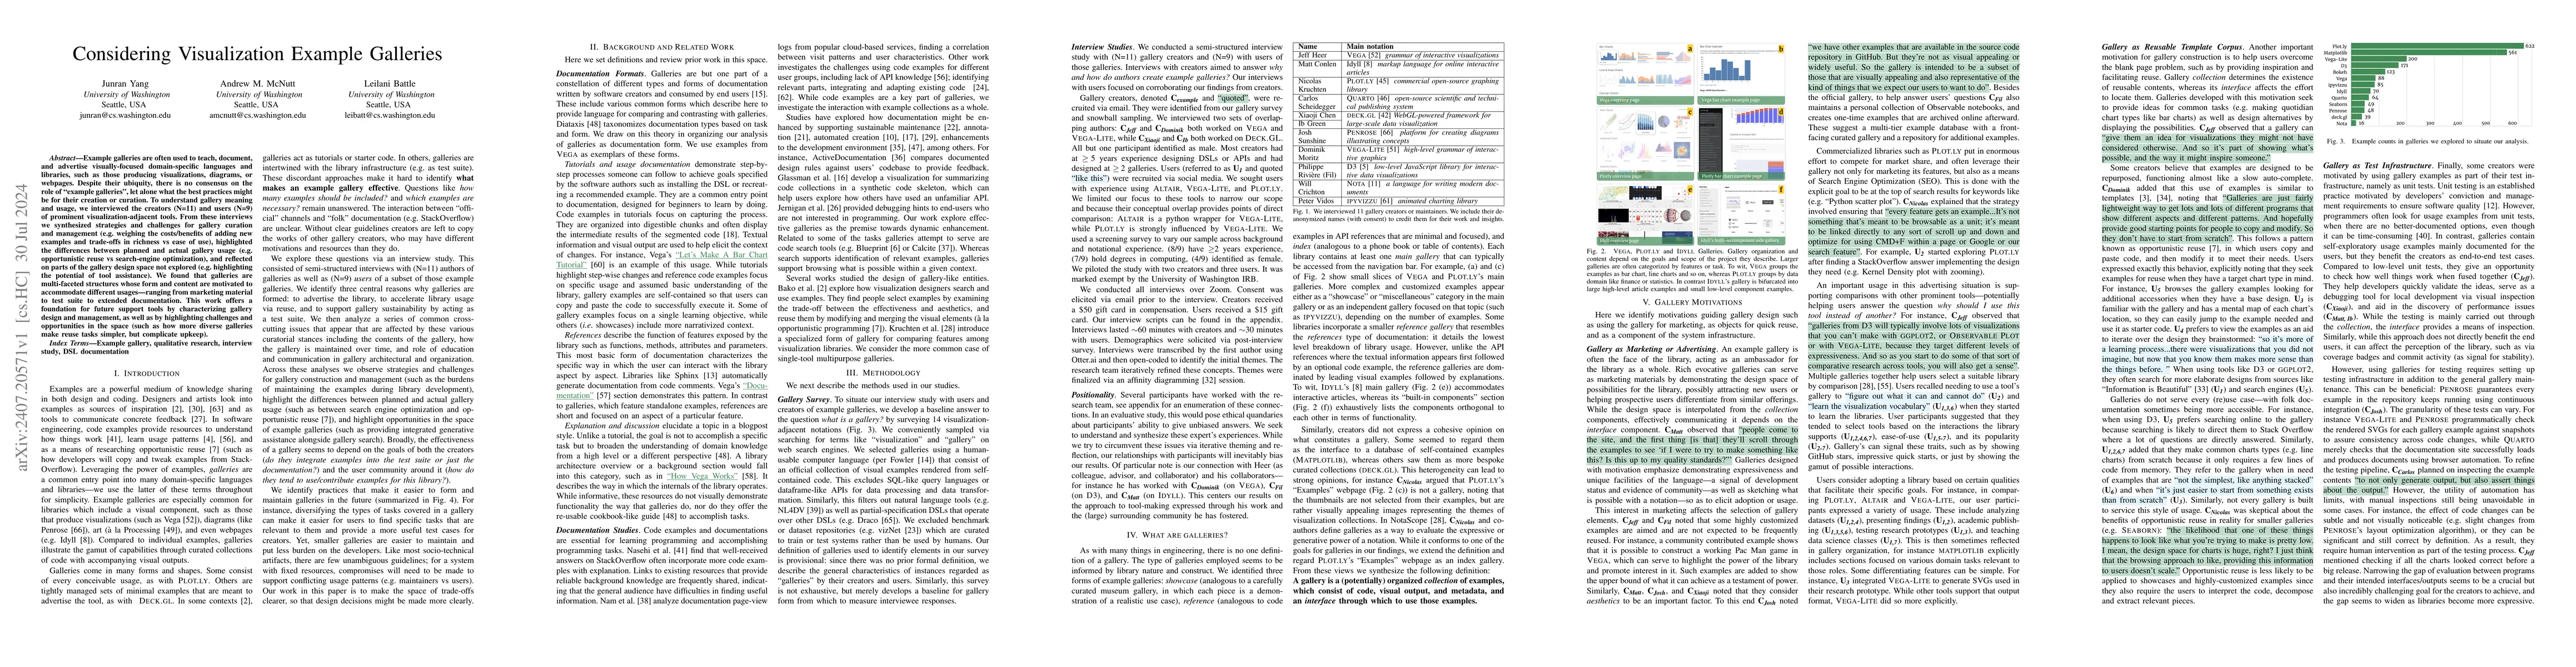
Example galleries are often used to teach, document, and advertise visually-focused domain-specific languages and libraries, such as those producing visualizations, diagrams, or webpages. Despite thei...
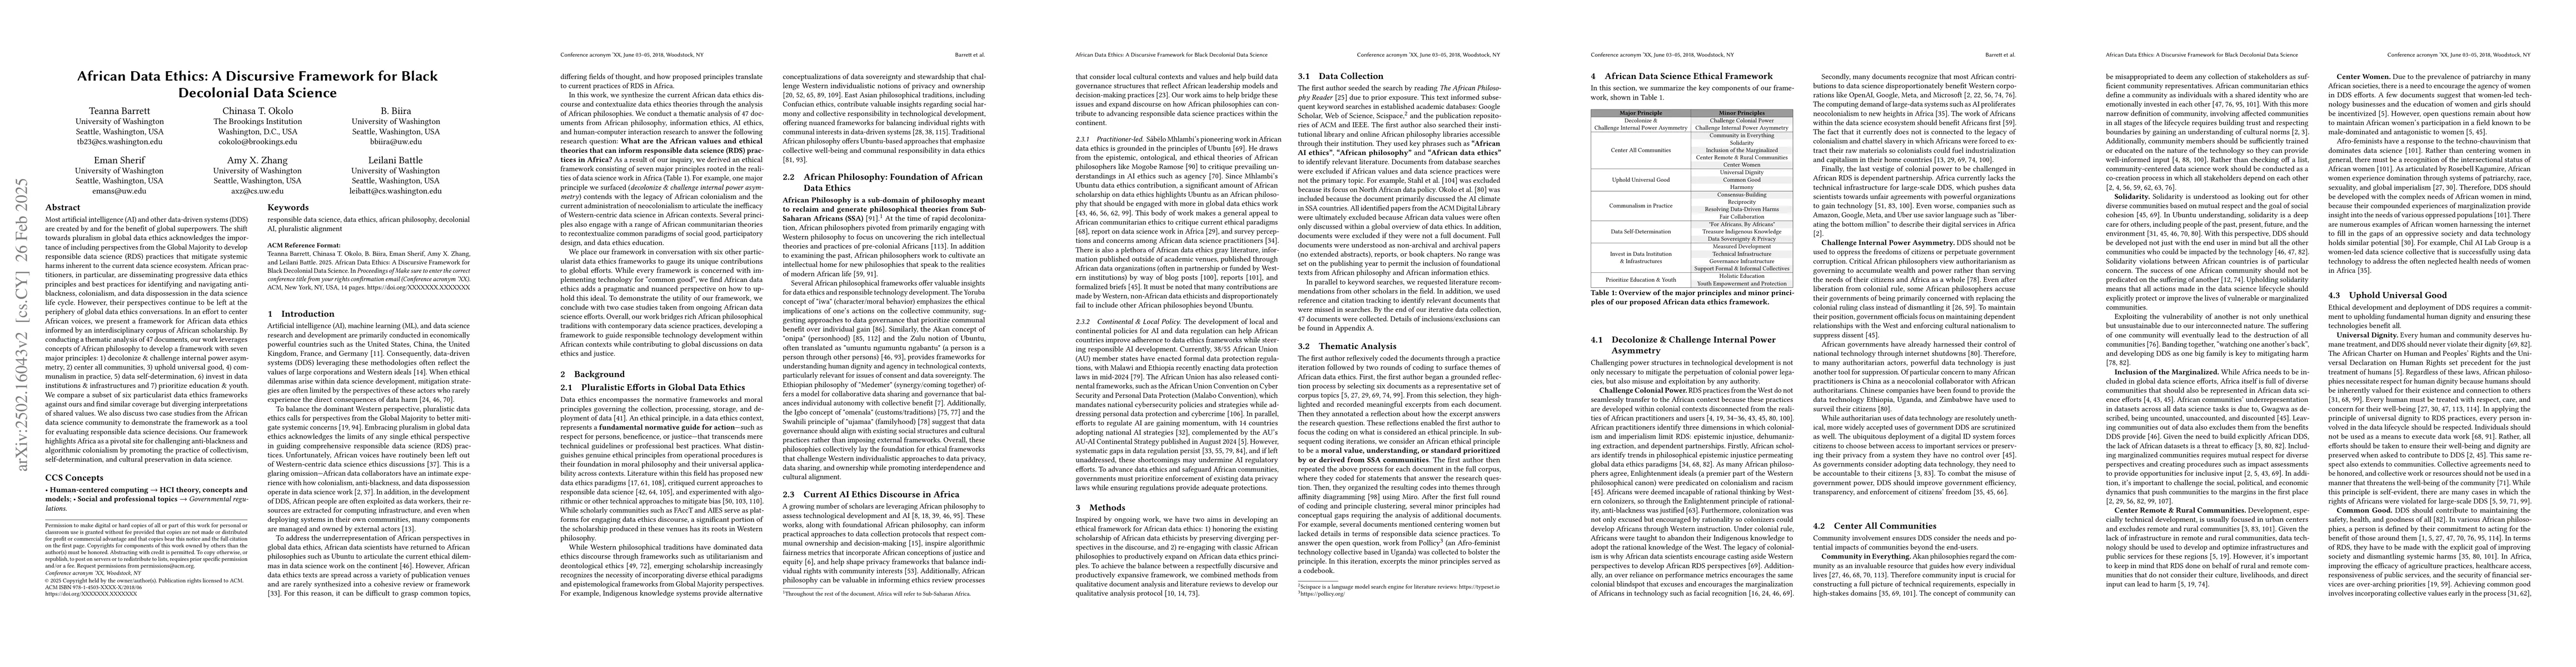
Most artificial intelligence (AI) and other data-driven systems (DDS) are created by and for the benefit of global superpowers. The shift towards pluralism in global data ethics acknowledges the impor...
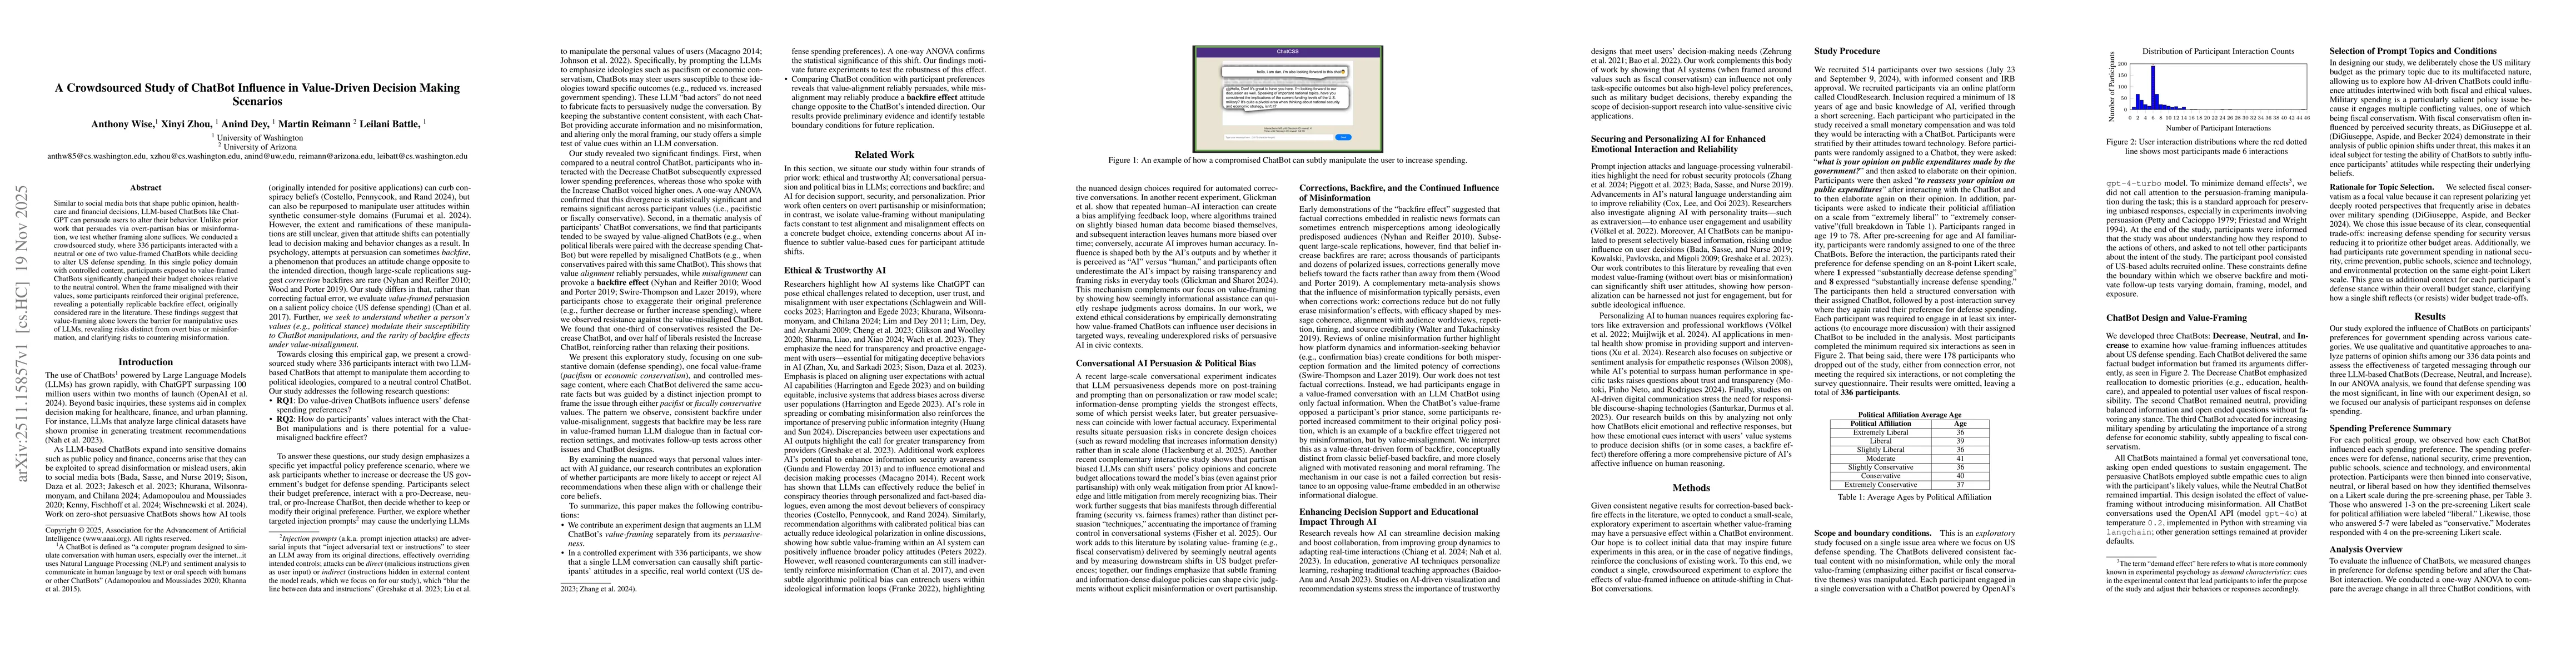
Similar to social media bots that shape public opinion, healthcare and financial decisions, LLM-based ChatBots like ChatGPT can persuade users to alter their behavior. Unlike prior work that persuades...
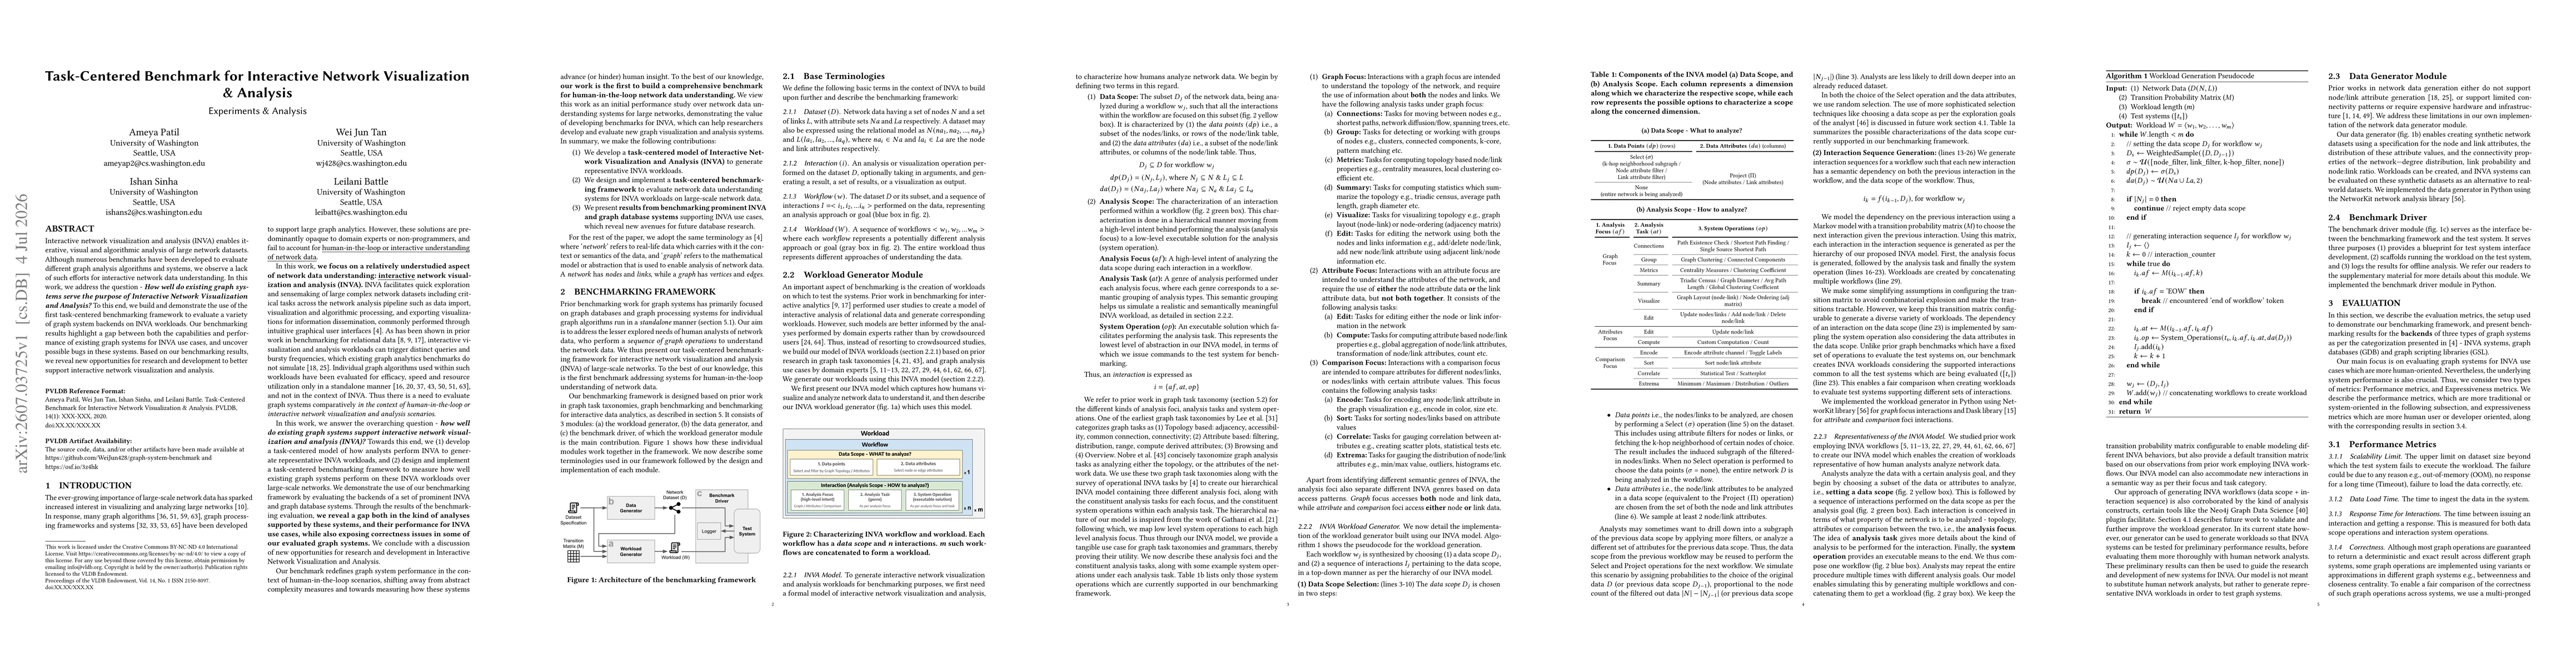
Interactive network visualization and analysis (INVA) enables iterative, visual and algorithmic analysis of large network datasets. Although numerous benchmarks have been developed to evaluate differe...