This paper investigates public health analysts' preferences for visualization recommendations, revealing a preference for simple, clear charts that align with existing data and hypotheses. The study recommends that visualization recommendation systems incorporate contextual and domain-specific information to better meet analyst needs.
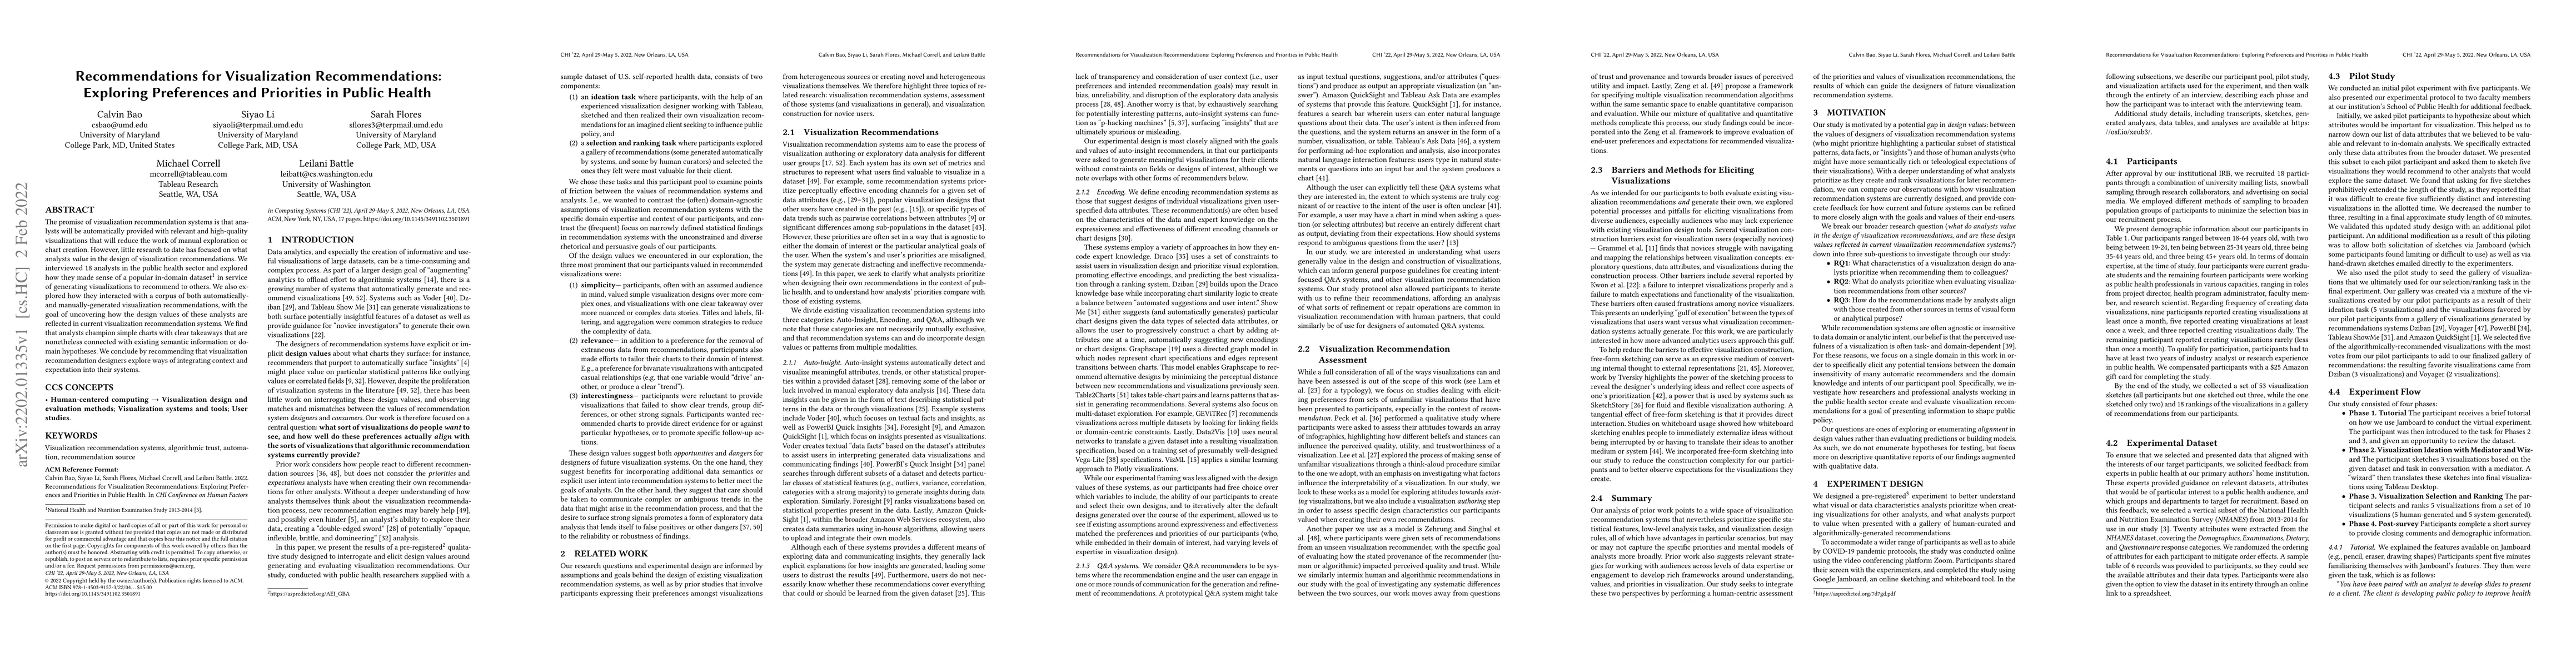
The promise of visualization recommendation systems is that analysts will be automatically provided with relevant and high-quality visualizations that will reduce the work of manual exploration or chart creation. However, little research to date has focused on what analysts value in the design of visualization recommendations. We interviewed 18 analysts in the public health sector and explored how they made sense of a popular in-domain dataset. in service of generating visualizations to recommend to others. We also explored how they interacted with a corpus of both automatically- and manually-generated visualization recommendations, with the goal of uncovering how the design values of these analysts are reflected in current visualization recommendation systems. We find that analysts champion simple charts with clear takeaways that are nonetheless connected with existing semantic information or domain hypotheses. We conclude by recommending that visualization recommendation designers explore ways of integrating context and expectation into their systems.
Get AI-generated insights about this paper's methodology, results, and significance.
Current paper (gray), citations (green), references (blue)
Zahner, Susan J, Gillespie, Katie, Merss, Kristin et al.
Title | Authors | Year | Actions |
---|---|---|---|
Confirmation Bias: The Double-Edged Sword of Data Facts in Visual Data Communication
|
Shiyao Li, Thomas James Davidson, Cindy Xiong Bearfield, Emily Wall
|
2025
|
View Paper |
Analyzing the Shifts in Users Data Focus in Exploratory Visual Analysis
|
Sanad Saha, Nischal Aryal, Leilani Battle, Arash Termehchy
|
2025
|
View Paper |
"The Diagram is like Guardrails": Structuring GenAI-assisted Hypotheses Exploration with an Interactive Shared Representation
|
Zijian Ding, Michelle Brachman, Joel Chan, Werner Geyer
|
2025
|
View Paper |
Empirical Insights into Analytic Provenance Summarization: A Study on Segmenting Data Analysis Workflows
|
Shaghayegh Esmaeili, Irelis D. Suarez, Ezekiel Ajayi, Eric D. Ragan
|
2024
|
View Paper |
ShiftScope: Adapting Visualization Recommendations to Users' Dynamic Data Focus
|
Sanad Saha, Nischal Aryal, Leilani Battle, Arash Termehchy
|
2024
|
View Paper |
Challenges and Opportunities in Data Visualization Education: A Call to Action
|
B. Bach, Mandy Keck, Fateme Rajabiyazdi, Tatiana Losev, Isabel Meirelles, J. Dykes, R. Laramee, Mashael AlKadi, Christina Stoiber, Samuel Huron, Charles Perin, Luiz Morais, W. Aigner, Doris Kosminsky, Magdalena Boucher, S. Knudsen, A. Manataki, J. Aerts, Uta Hinrichs, J. C. Roberts, Sheelagh Carpendale
|
2023
|
View Paper |
Doom or Deliciousness: Challenges and Opportunities for Visualization in the Age of Generative Models
|
V. Schetinger, Sara Di Bartolomeo, Mennatallah El-Assady, A. Mcnutt, M. Miller, J. P. A. Passos, J. L. Adams
|
2023
|
View Paper |
A Design Space for Surfacing Content Recommendations in Visual Analytic Platforms
|
Zhilan Zhou, Wenyuan Wang, Mengtian Guo, Yue Wang, D. Gotz
|
2022
|
View Paper |
User-Driven Support for Visualization Prototyping in D3
|
Hannah K. Bako, Alisha Varma, Anuoluwapo Faboro, Mahreen Haider, Favour Nerrise, B. Kenah, John P. Dickerson, L. Battle
|
2021
|
View Paper |
A Systematic Review of Visualization Recommendation Systems: Goals, Strategies, Interfaces, and Evaluations
|
Zehua Zeng, Leilani Battle
|
2024
|
View Paper |
User-Driven Support for Rapid Visualization Prototyping in D3
|
Hannah K. Bako, Alisha Varma, Anuoluwapo Faboro, Mahreen Haider, Favour Nerrise, B. Kenah, John P. Dickerson, L. Battle
|
2023
|
View Paper |
A Programmatic Definition of Visualization Tasks, Insights, and Objectives
|
L. Battle, Alvitta Ottley
|
2022
|
View Paper |
User-Driven Support for Rapid Visualization Programming in D3
|
Hannah K. Bako, Alisha Varma, Anuoluwapo Faboro, Mahreen Haider, Favour Nerrise, John P. Dickerson, L. Battle
|
2022
|
View Paper |
Pyxis: A Programmatic Definition of Visualization Insights, Objectives, and Tasks
|
Alvitta Ottley
|
2022
|
View Paper |
Michael Correll Research Statement
|
M. Correll
|
2021
|
View Paper |
Comments (0)