Toward a Scalable Census of Dashboard Designs in the Wild: A Case Study with Tableau Public
Publication
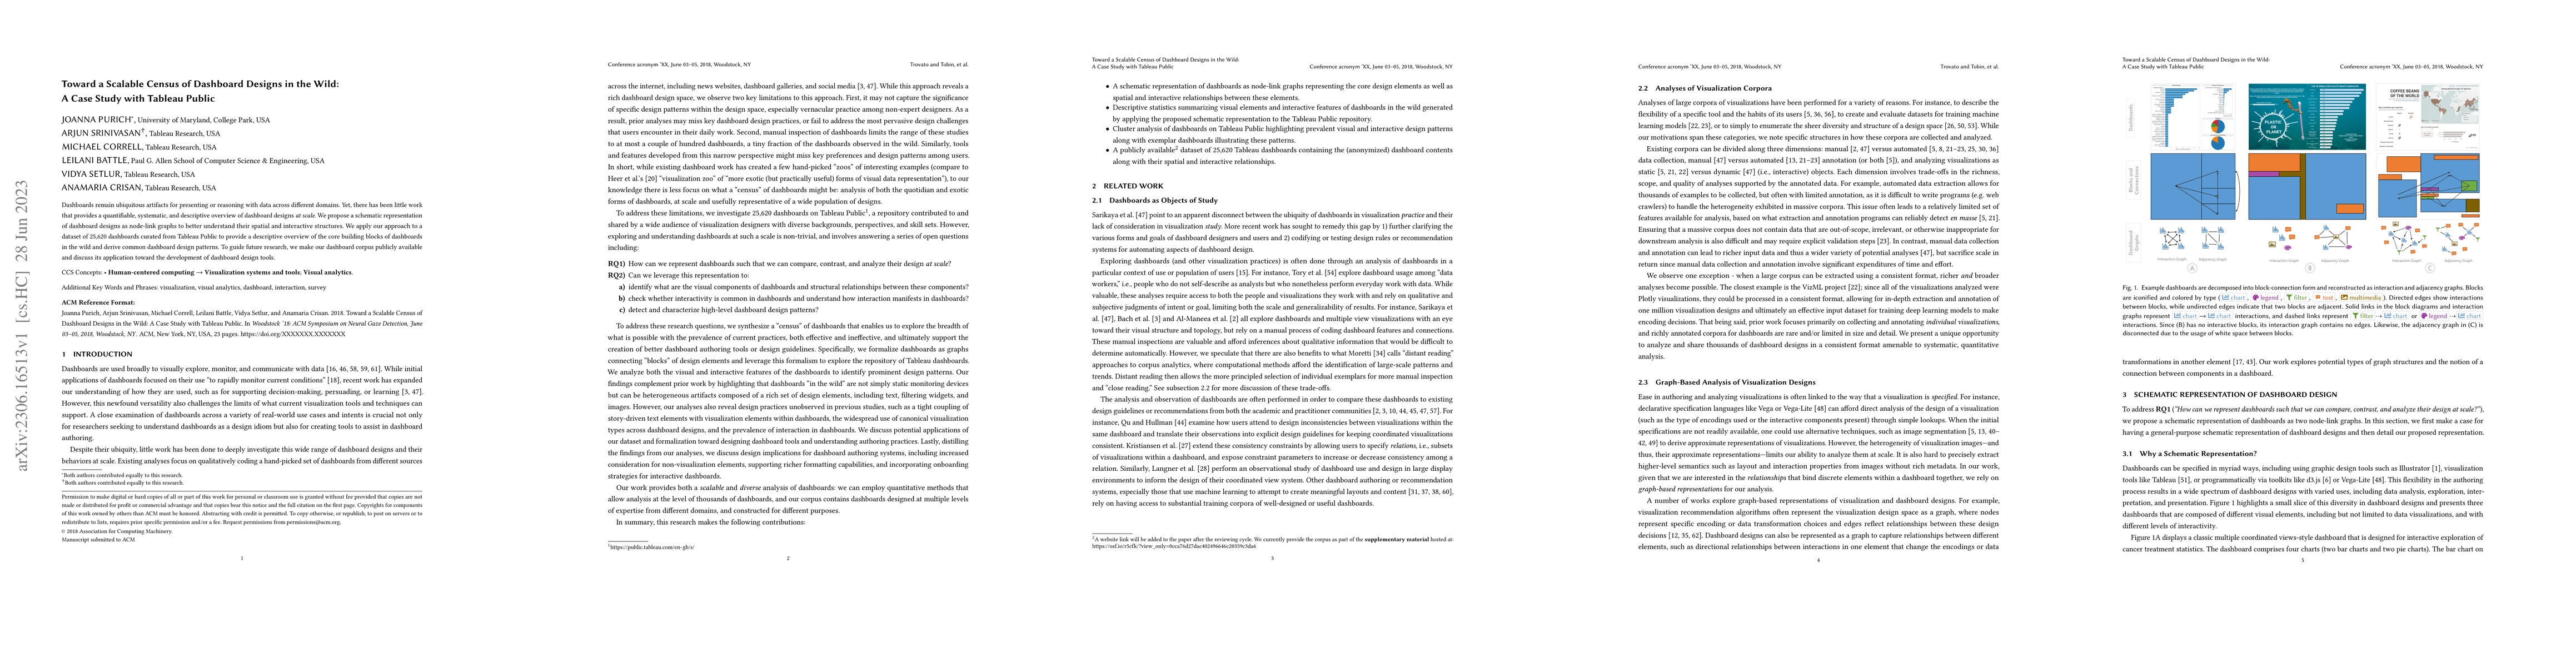
Metrics
AI Quick Summary
This paper proposes a method to systematically analyze dashboard designs using node-link graphs, applied to a dataset of 25,620 dashboards from Tableau Public. The study aims to identify common design patterns and make the dataset publicly available to support future research on dashboard design tools.
Paper Preview
Abstract
Dashboards remain ubiquitous artifacts for presenting or reasoning with data across different domains. Yet, there has been little work that provides a quantifiable, systematic, and descriptive overview of dashboard designs at scale. We propose a schematic representation of dashboard designs as node-link graphs to better understand their spatial and interactive structures. We apply our approach to a dataset of 25,620 dashboards curated from Tableau Public to provide a descriptive overview of the core building blocks of dashboards in the wild and derive common dashboard design patterns. To guide future research, we make our dashboard corpus publicly available and discuss its application toward the development of dashboard design tools.
AI Key Findings
Get AI-generated insights about this paper's methodology, results, significance, and more — seven facets brought into focus.
Impact
Paper Details
Authors
PDF Preview
Key Terms
Citation Network
Current paper (gray), citations (green), references (blue)
Display is limited for performance on very large graphs.
Discussion 0