Thread review sentimental analysis with tkinter GUI & tableau dashboard
Publication
Metrics
AI Quick Summary
This research develops a Tkinter-based GUI for sentiment analysis on thread reviews and visualizes results using Tableau. The project preprocesses and analyzes reviews to classify sentiments, providing stakeholders with interactive insights and a comprehensive Tableau dashboard for informed decision-making.
Paper Preview
Abstract
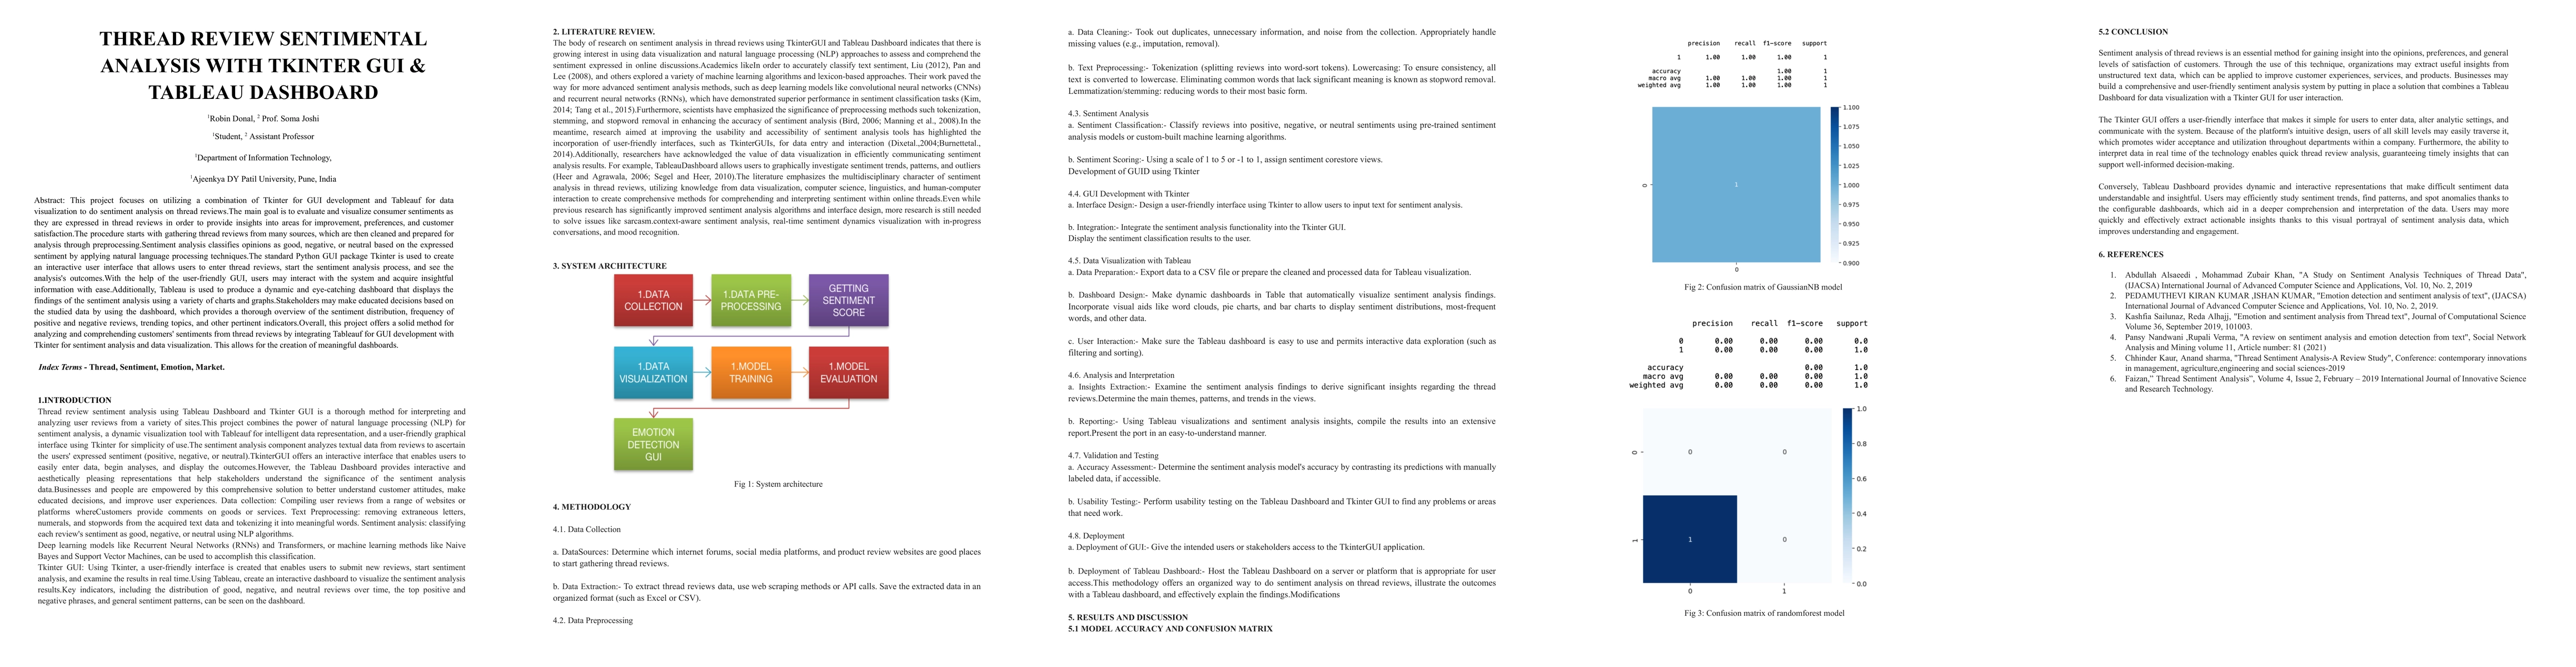
This project focuses on utilizing a combination of Tkinter for GUI development and Tableauf for data visualization to do sentiment analysis on thread reviews.The main goal is to evaluate and visualize consumer sentiments as they are expressed in thread reviews in order to provide insights into areas for improvement, preferences, and customer satisfaction.The procedure starts with gathering thread reviews from many sources, which are then cleaned and prepared for analysis through preprocessing.Sentiment analysis classifies opinions as good, negative, or neutral based on the expressed sentiment by applying natural language processing techniques.The standard Python GUI package Tkinter is used to create an interactive user interface that allows users to enter thread reviews, start the sentiment analysis process, and see the analysis's outcomes.With the help of the user-friendly GUI, users may interact with the system and acquire insightful information with ease.Additionally, Tableau is used to produce a dynamic and eye-catching dashboard that displays the findings of the sentiment analysis using a variety of charts and graphs.Stakeholders may make educated decisions based on the studied data by using the dashboard, which provides a thorough overview of the sentiment distribution, frequency of positive and negative reviews, trending topics, and other pertinent indicators.Overall, this project offers a solid method for analyzing and comprehending customers' sentiments from thread reviews by integrating Tableauf for GUI development with Tkinter for sentiment analysis and data visualization. This allows for the creation of meaningful dashboards.
AI Key Findings
Get AI-generated insights about this paper's methodology, results, significance, and more — seven facets brought into focus.
Impact
Paper Details
Authors
PDF Preview
Key Terms
Citation Network
Current paper (gray), citations (green), references (blue)
Display is limited for performance on very large graphs.
Discussion 0