Publication
Metrics
AI Quick Summary
This paper analyzes 2500 D3 visualizations to identify common implementation practices and synthesizes reusable code templates for 8 popular types, aiming to simplify D3 visualization programming by reducing the learning curve through user-driven templates and auto-generated code recommendations.
Paper Preview
Abstract
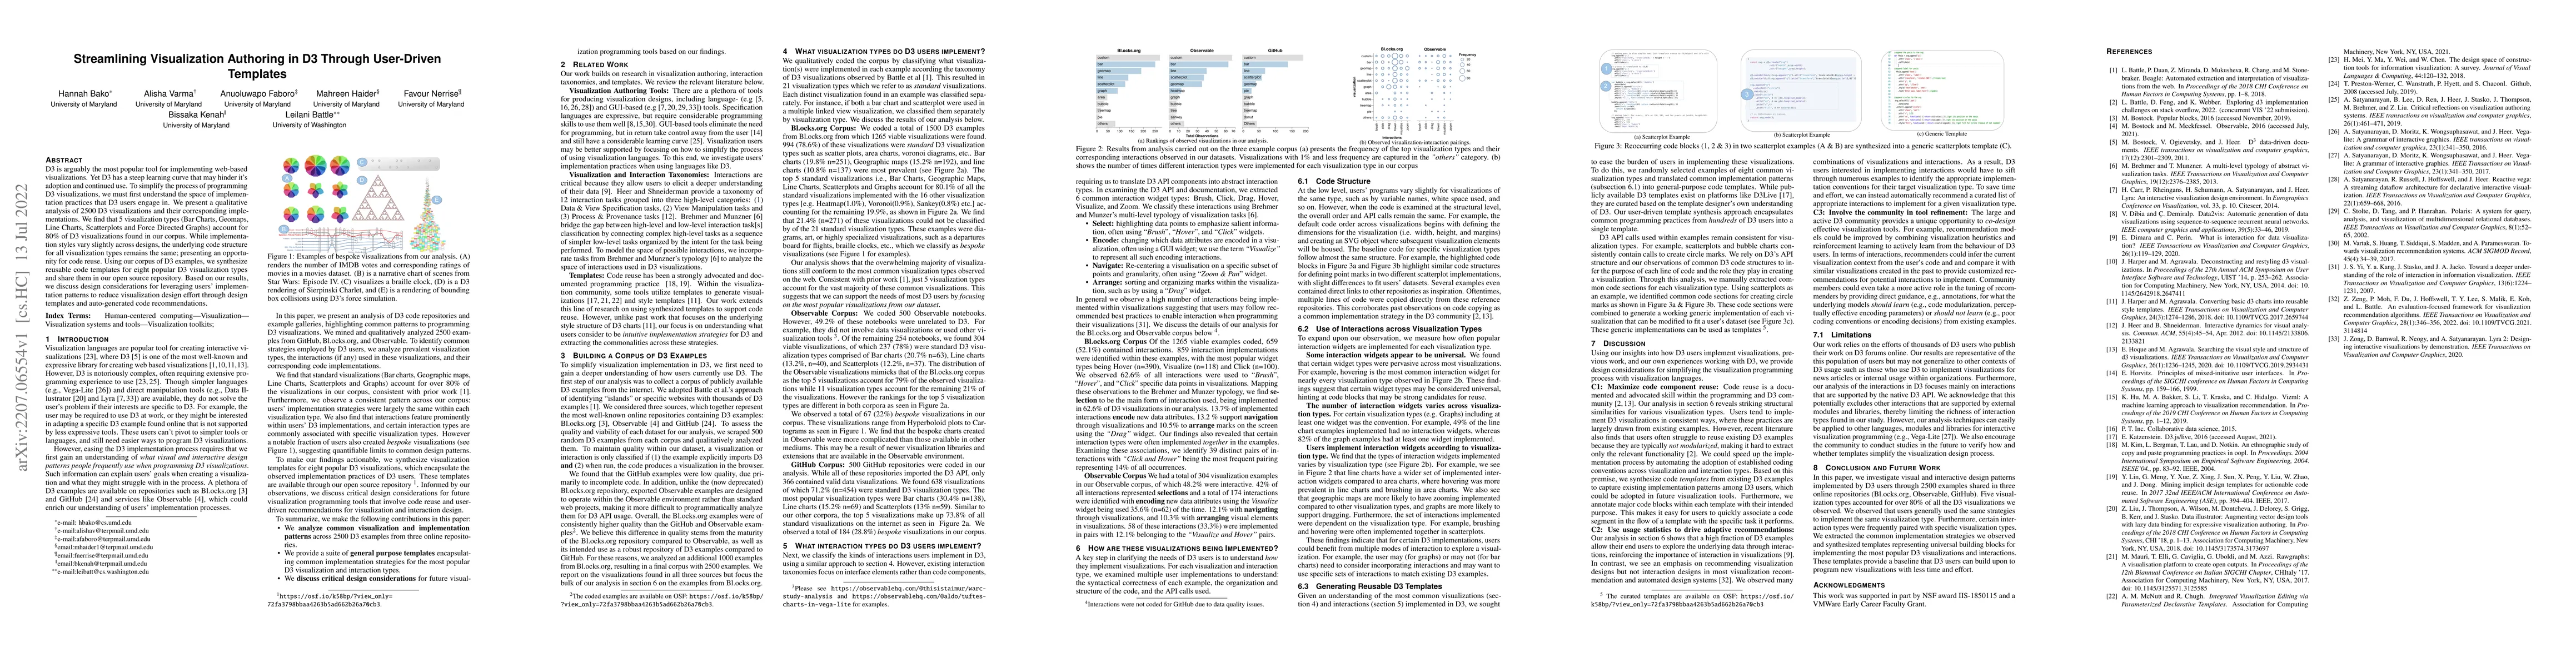
D3 is arguably the most popular tool for implementing web based visualizations. Yet D3 has a steep learning curve that may hinder its adoption and continued use. To simplify the process of programming D3 visualizations, we must first understand the space of implementation practices that D3 users engage in. We present a qualitative analysis of 2500 D3 visualizations and their corresponding implementations. We find that 5 visualization types (Bar Charts, Geomaps, Line Charts, Scatterplots, and Force Directed Graphs) account for 80% of D3 visualizations found in our corpus. While implementation styles vary slightly across designs, the underlying code structure for all visualization types remains the same; presenting an opportunity for code reuse. Using our corpus of D3 examples, we synthesize reusable code templates for eight popular D3 visualization types and share them in our open source repository. Based on our results, we discuss design considerations for leveraging users' implementation patterns to reduce visualization design effort through design templates and auto-generated code recommendations.
AI Key Findings
Get AI-generated insights about this paper's methodology, results, significance, and more — seven facets brought into focus.
Impact
Paper Details
Authors
PDF Preview
Key Terms
Citation Network
Current paper (gray), citations (green), references (blue)
Display is limited for performance on very large graphs.
Discussion 0