Publication
Metrics
AI Quick Summary
This study compares Bitcoin and the S&P 500 index using a seven-parameter General Tempered Stable distribution, revealing Bitcoin's heavier-tailed return distribution and greater potential for extreme returns, with an average value-at-risk four times higher than that of the S&P 500.
Paper Preview
Abstract
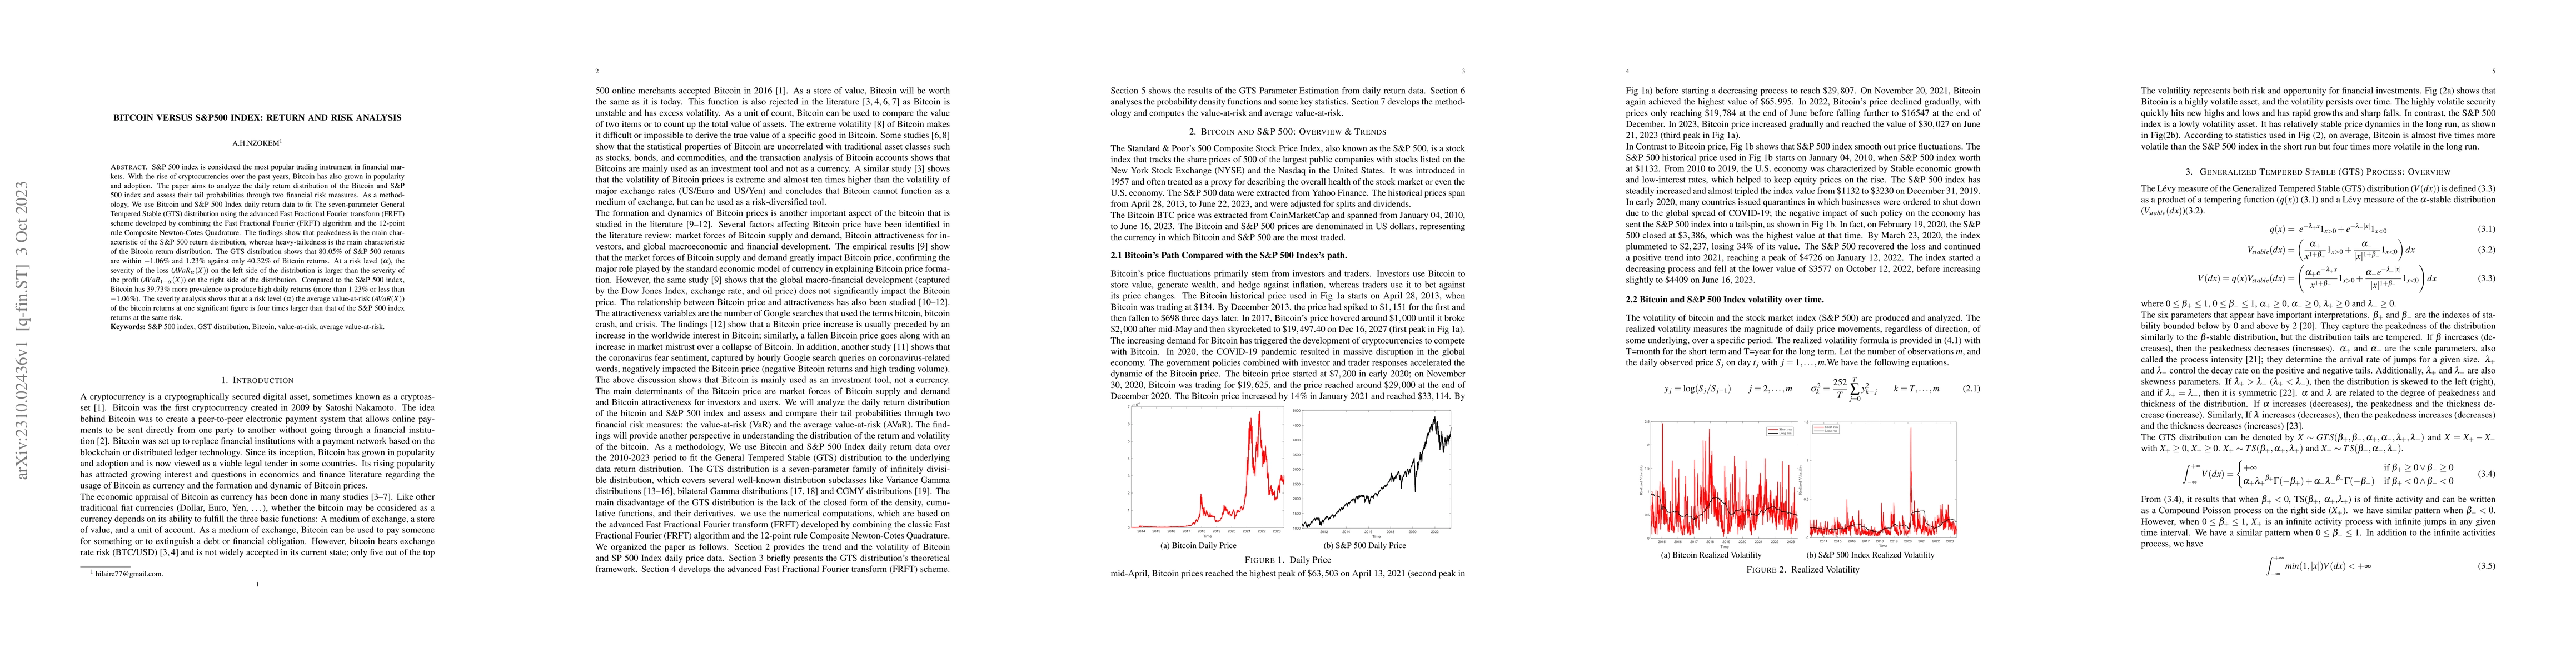
The S&P 500 index is considered the most popular trading instrument in financial markets. With the rise of cryptocurrencies over the past years, Bitcoin has also grown in popularity and adoption. The paper aims to analyze the daily return distribution of the Bitcoin and S&P 500 index and assess their tail probabilities through two financial risk measures. As a methodology, We use Bitcoin and S&P 500 Index daily return data to fit The seven-parameter General Tempered Stable (GTS) distribution using the advanced Fast Fractional Fourier transform (FRFT) scheme developed by combining the Fast Fractional Fourier (FRFT) algorithm and the 12-point rule Composite Newton-Cotes Quadrature. The findings show that peakedness is the main characteristic of the S&P 500 return distribution, whereas heavy-tailedness is the main characteristic of the Bitcoin return distribution. The GTS distribution shows that $80.05\%$ of S&P 500 returns are within $-1.06\%$ and $1.23\%$ against only $40.32\%$ of Bitcoin returns. At a risk level ($\alpha$), the severity of the loss ($AVaR_{\alpha}(X)$) on the left side of the distribution is larger than the severity of the profit ($AVaR_{1-\alpha}(X)$) on the right side of the distribution. Compared to the S&P 500 index, Bitcoin has $39.73\%$ more prevalence to produce high daily returns (more than $1.23\%$ or less than $-1.06\%$). The severity analysis shows that at a risk level ($\alpha$) the average value-at-risk ($AVaR(X)$) of the bitcoin returns at one significant figure is four times larger than that of the S&P 500 index returns at the same risk.
AI Key Findings
Get AI-generated insights about this paper's methodology, results, significance, and more — seven facets brought into focus.
Impact
Paper Details
Authors
PDF Preview
Key Terms
Citation Network
Current paper (gray), citations (green), references (blue)
Display is limited for performance on very large graphs.
Discussion 0