Boxplots and quartile plots for grouped and periodic angular data
Publication
Metrics
Paper Preview
Abstract
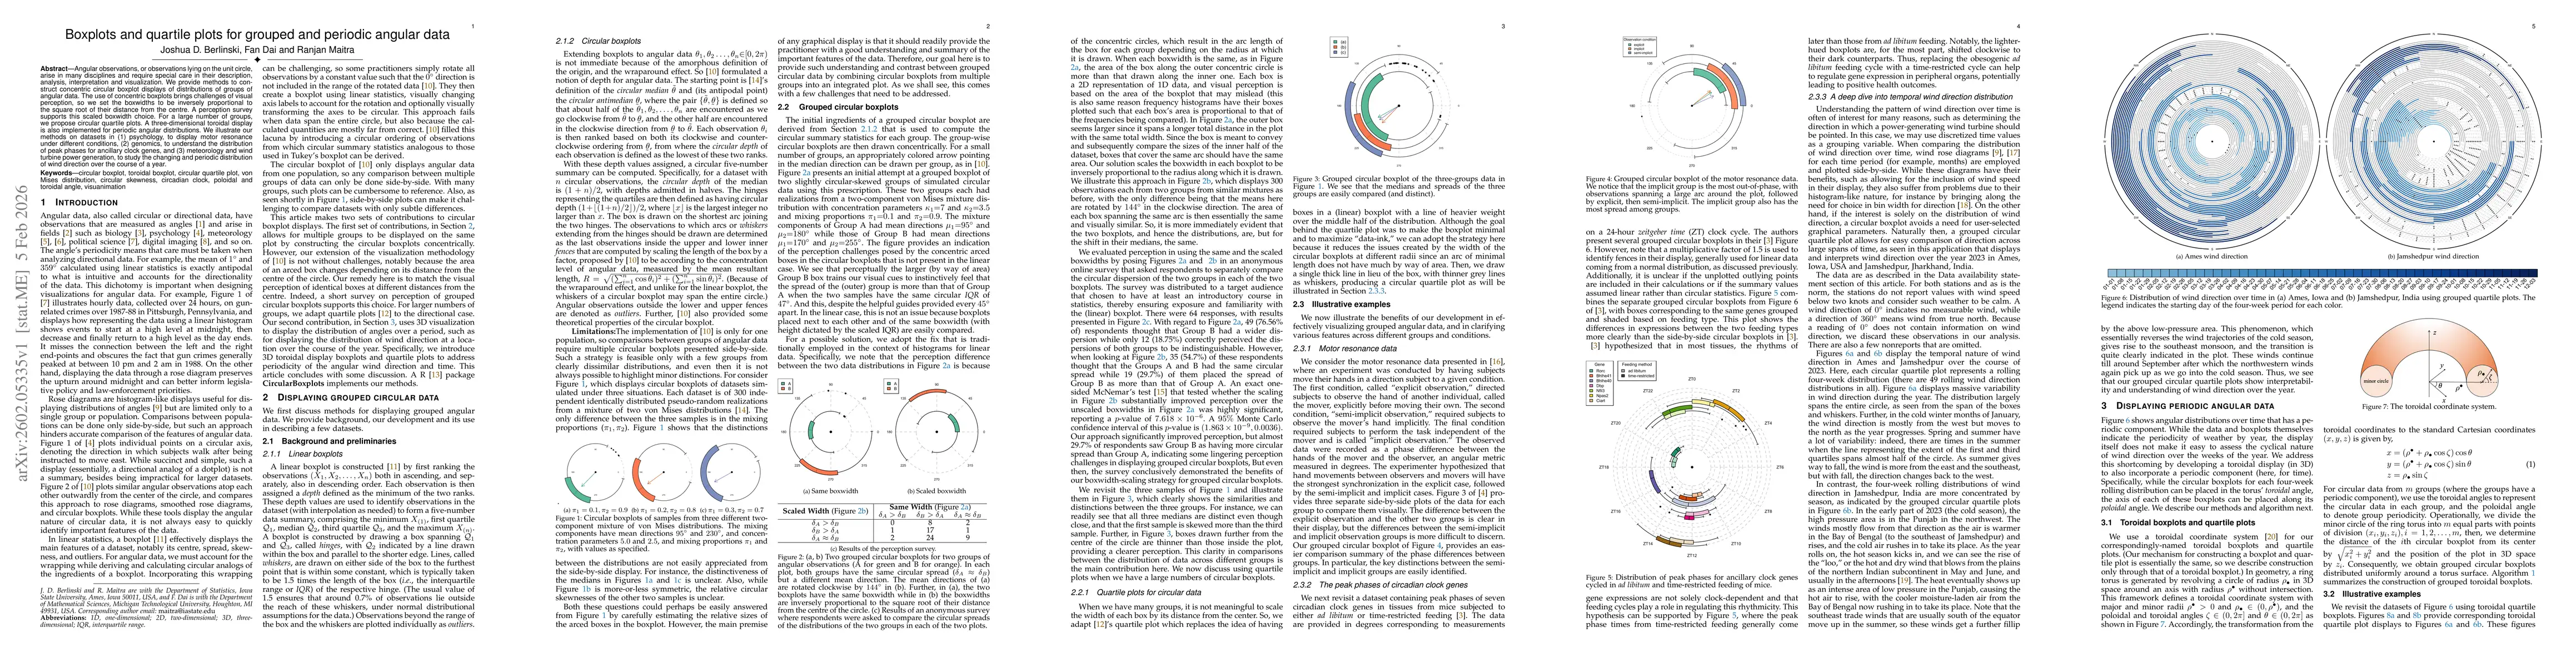
Angular observations, or observations lying on the unit circle, arise in many disciplines and require special care in their description, analysis, interpretation and visualization. We provide methods to construct concentric circular boxplot displays of distributions of groups of angular data. The use of concentric boxplots brings challenges of visual perception, so we set the boxwidths to be inversely proportional to the square root of their distance from the centre. A perception survey supports this scaled boxwidth choice. For a large number of groups, we propose circular quartile plots. A three-dimensional toroidal display is also implemented for periodic angular distributions. We illustrate our methods on datasets in (1) psychology, to display motor resonance under different conditions, (2) genomics, to understand the distribution of peak phases for ancillary clock genes, and (3) meteorology and wind turbine power generation, to study the changing and periodic distribution of wind direction over the course of a year.
AI Key Findings
Get AI-generated insights about this paper's methodology, results, significance, and more — seven facets brought into focus.
Discussion 0