Breviz: Visualizing Spreadsheets using Dataflow Diagrams
Publication
Metrics
AI Quick Summary
This paper introduces Breviz, a tool that creates data flow diagrams from spreadsheets to aid understanding and design assessment. It demonstrates this through three case studies, showcasing its utility for both collaboration and quality evaluation.
Paper Preview
Abstract
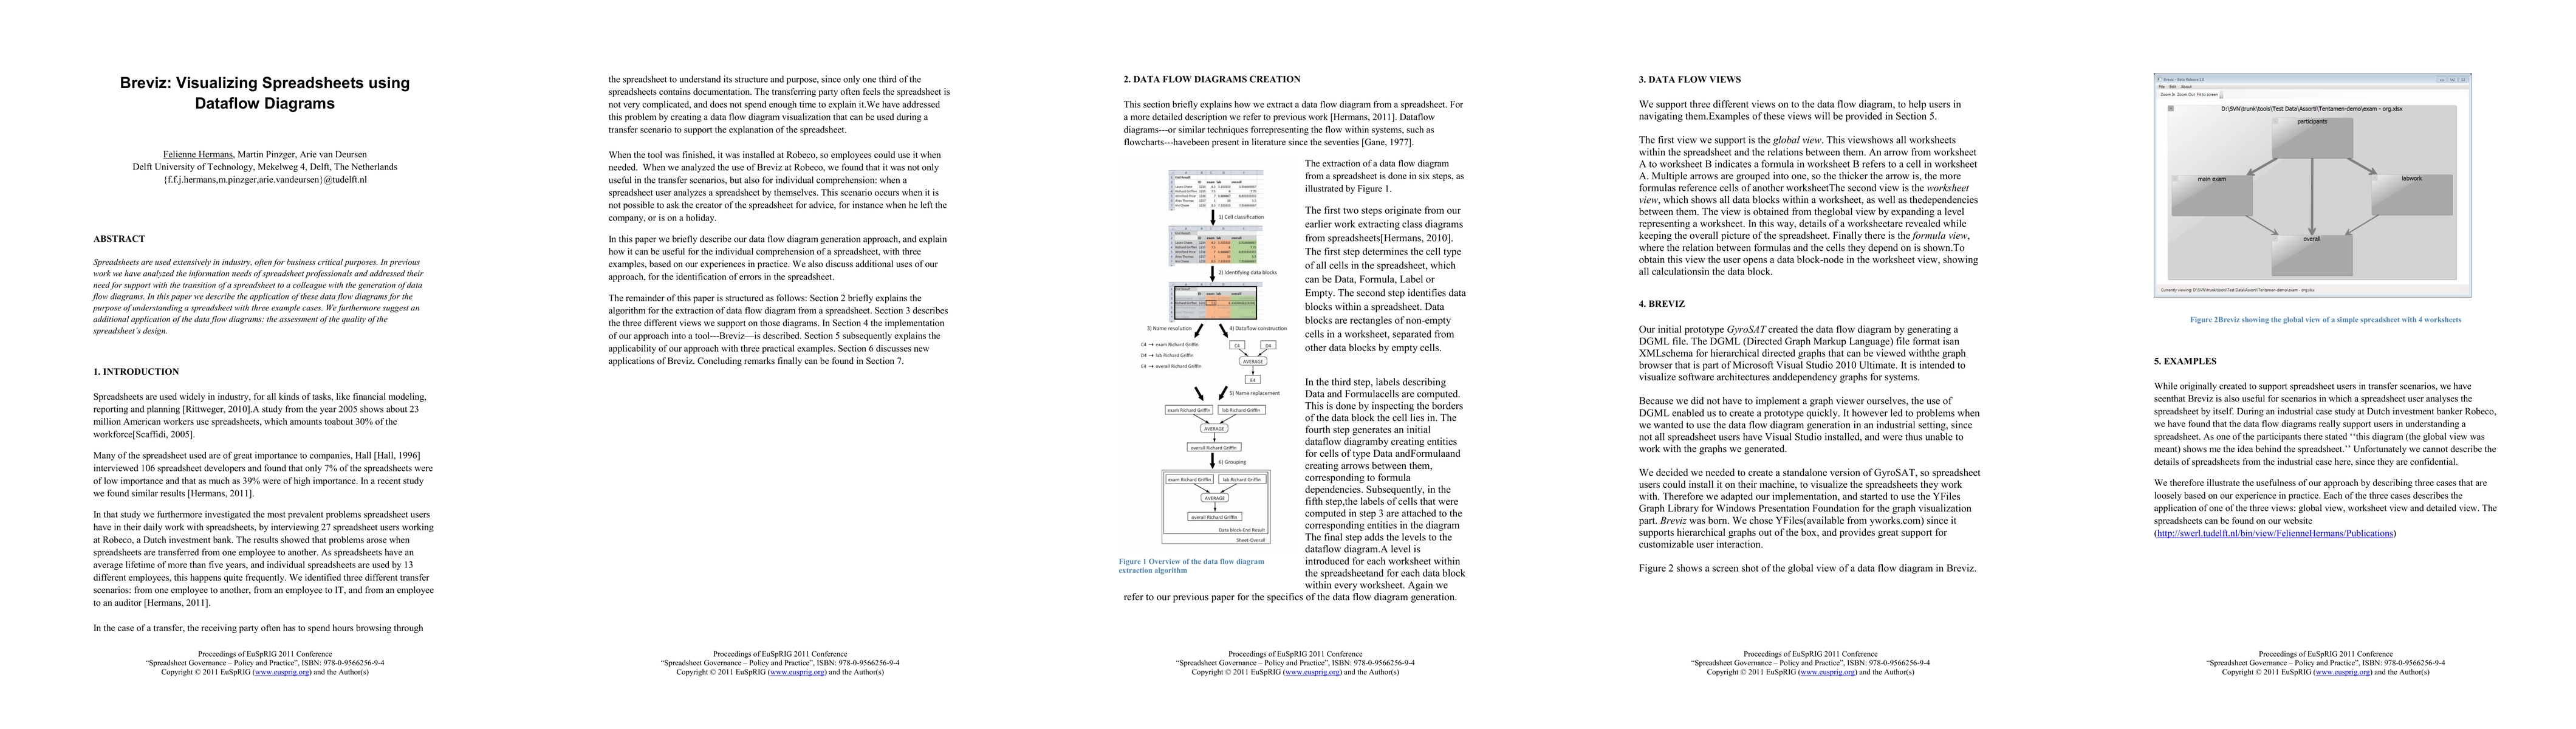
Spreadsheets are used extensively in industry, often for business critical purposes. In previous work we have analyzed the information needs of spreadsheet professionals and addressed their need for support with the transition of a spreadsheet to a colleague with the generation of data flow diagrams. In this paper we describe the application of these data flow diagrams for the purpose of understanding a spreadsheet with three example cases. We furthermore suggest an additional application of the data flow diagrams: the assessment of the quality of the spreadsheet's design.
AI Key Findings
Get AI-generated insights about this paper's methodology, results, significance, and more — seven facets brought into focus.
Impact
Paper Details
PDF Preview
Key Terms
Citation Network
Current paper (gray), citations (green), references (blue)
Display is limited for performance on very large graphs.
Discussion 0